What is matplotlib?
it is the most popular ploting library for python and gives you control cover every aspect of a figure.It is designed to have a similar feel to Matplotlab’s graphical plotting and works very well with pandas and numpy.
installation
pip install matplotlib
conda install matplotlib
まず表示用のデモデータを作ります。
import matplotlib.pyplot as plt
import numpy as np

x=np.linspace(0,5,11)
y=x**2
Plotを作るのに、Functional method・Object oriented method二種類があります。
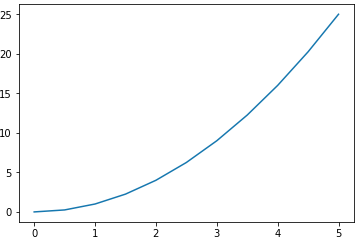
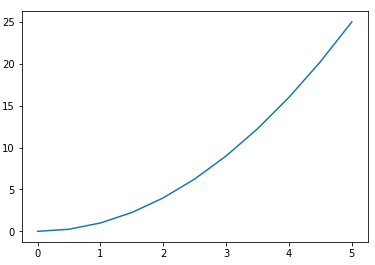
Functional method
plt.plot(x,y)
plt.show()
毎回もshow()を入れるとちょっと面倒くさいので、これを入れます。
%matplotlib inline
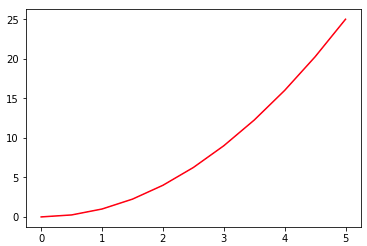
線の色を変えてみます。
plt.plot(x,y,'-r')
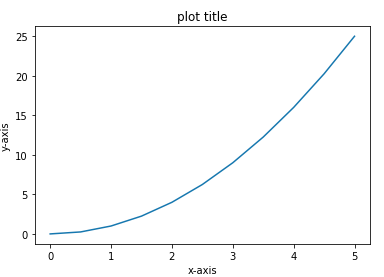
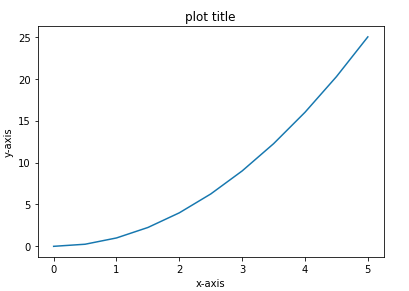
TitleとAxisのラベルを入れます。
plt.plot(x,y)
plt.xlabel('x-axis')
plt.ylabel('y-axis')
plt.title('plot title')
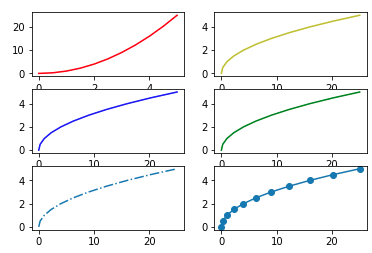
subplot()を使って複数のPlotを表示します。まずsubplotのパラメータを説明します。
plt.subplot( 3, #how many rows
2, #how many columns
1 #your current plot refer to
)
では実際にPlotを作ってみましょう。3×2の複数Plotを表示します。
plt.subplot(3,2,1)
plt.plot(x,y,'-r')
plt.subplot(3,2,2)
plt.plot(y,x,'-y')
plt.subplot(3,2,3)
plt.plot(y,x,'-b')
plt.subplot(3,2,4)
plt.plot(y,x,'-g')
plt.subplot(3,2,5)
plt.plot(y,x,'-.')
plt.subplot(3,2,6)
plt.plot(y,x,'-o')
OOP
The main idea in using the more formal object oriented method is to create figure objects and then just call methods of this.
fig=plt.figure()
axes=fig.add_axes([0.1,#left bottom width
0.1,#left bottom height
0.8,#width of axes
0.8 #height of axes
])
axes.plot(x,y)
各Axisにラペルを入れ、PlotにもTitleを入れます。
axes.set_xlabel('x-axis')
axes.set_ylabel('y-axis')
axes.set_title('plot title')
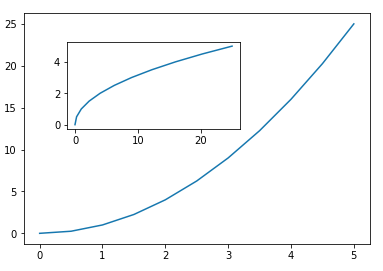
複数のPlotを表示する
fig=plt.figure()
axes.set_xlabel('x-axis')
axes.set_ylabel('y-axis')
axes.set_title('plot title')
axes1=fig.add_axes([0.1,0.1,0.8,0.8])
axes2=fig.add_axes([0.2,0.5,0.4,0.3])
axes1.plot(x,y)
axes2.plot(y,x)
それじゃねー