InfluxDBの第2話です。前回はDockerとInfluxdbの構築・あと実際Phoenix ContactのEdge PC EPC1522内蔵のInfluxとNode-Redの動作確認・そしてInfluxDBの基本コンセプトを説明しました。今回はtelegrafというPlug Inを紹介しようと思います。
よろしくお願いします!
Thanks!
今回の記事で使用するEPC1522エッジPCはフエニックス・コンタクトJapanが貸してくださったものです。誠にありがとうございます。
フエニックス・コンタクトは1923年ドイツで設立、全世界55拠点、20,300名の従業員が働くグローバル企業です。
“All Electric Society”のコンセプトで、すべての産業セクターで包括的に電動化、ネットワーク化、自動化の実現などのソリューションを提供していくことを掲げています。産業用生産設備、インフラ、エネルギー、電子機器の接続など様々な用途にフエニックス・コンタクトの製品が使用されています。
日本のフエニックス・コンタクト株式会社は1987年12月に、アジアで初の現地法人として横浜で設立され、現在は国内10営業拠点で事業を展開しています。
HPはこちらです。
https://www.phoenixcontact.com/ja-jp/

Reference Link
前回のLinkはここです↓
Docker?
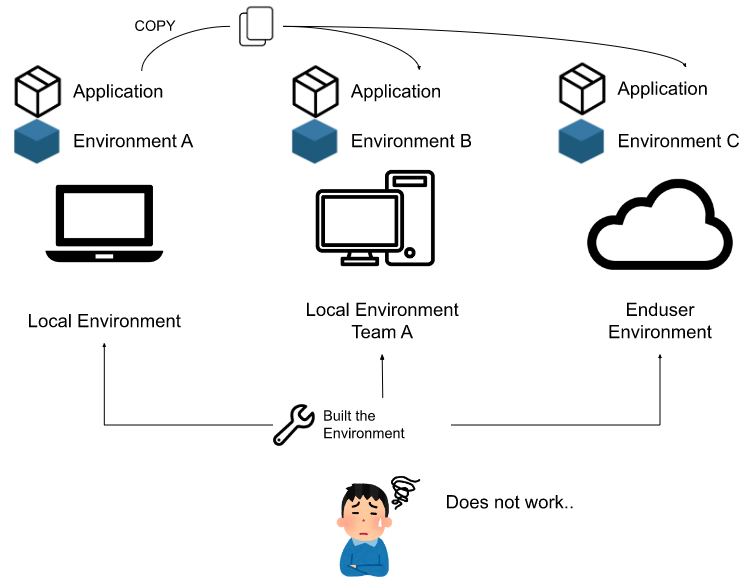
Dockerを紹介する前に、最初にDockerを使用する理由を話します。いままで開発者がローカルの開発環境で作ったアプリケーションがCloudや客の環境で動かないかもしれません。
その環境を再構築する必要がありますね。どこのお客様でも素早く、変動少なくでアプリケーションを稼働できるようにしたい。
でも開発者としては環境を再構築>そしてアプリケーションがOS・言語環境・バージョン様々な違うことでそのままうまく動かない場合が多いです。
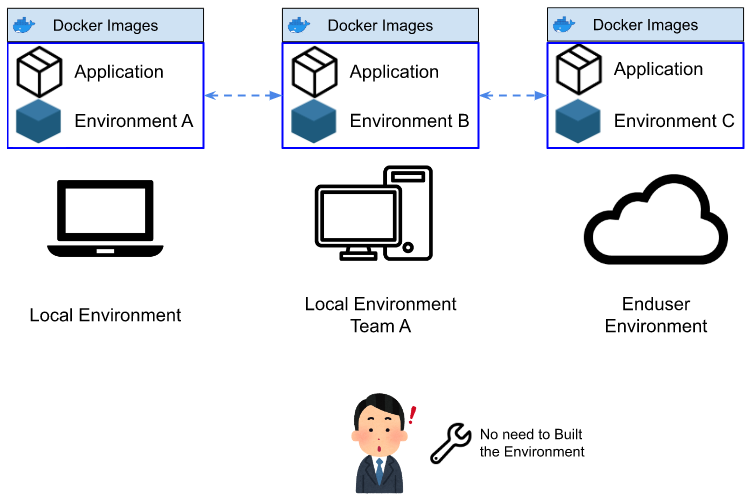
ここで出てきたのはDockerです。DockerはLinuxのコンテナ技術を使ったもので、コンテナはHostのカーネルを利用し、プロセスやユーザなどを隔離することで、別のマシンが動いているかのように動かすことができます。軽量で高速に起動、停止などが可能です。
さらに、開発者が作成したDockerイメージを他の開発者に渡すと。
- 各自の開発環境のVersion ずれ防ぐ
- 開発環境を構築する時間が短くなる
よくあるのは開発環境を構築するときドキュメントの不足や構築の順番間違えなどのミスだけで一日以上かかることもよくあります。
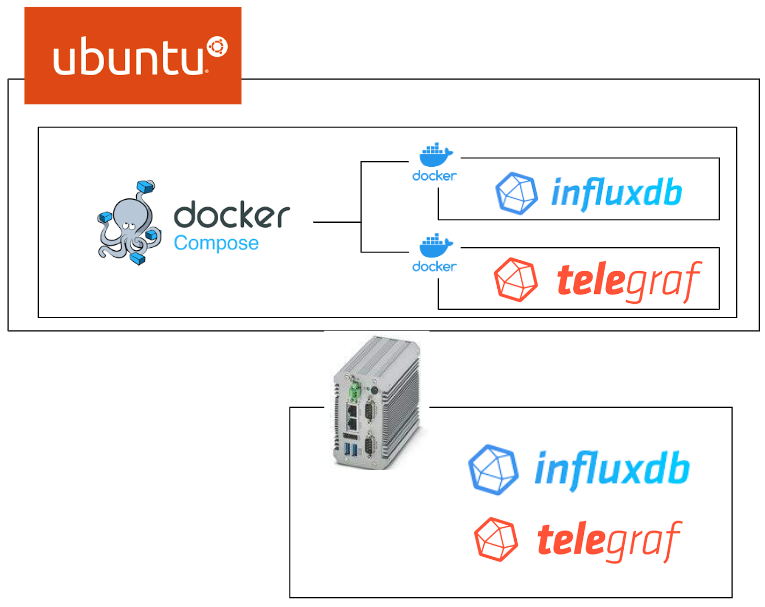
Docker でInfluxdbを動かしてみたいなら、前回の記事を参考にしてください。
Docker compose?
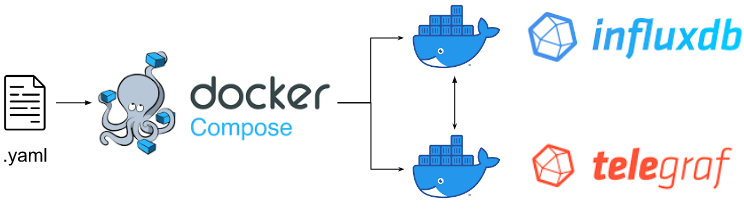
Docker Composeは複数のコンテナアプリケーションを定義や実行できるツールです。docker-composeというツールを使うことにより、構成記述File(.yaml)を使用し簡単に複数のコンテナを同時に立ち上げることができます。

Docker?Docker compose?
Dockerはコンテナを実行するEngineeで、操作するcommandはdocker command、一度一回だけのdockerの操作しかできません。
Docker composeはコンテナやアプリケーションを定義・実行するツールであり、操作するcommandはdocker compose、複数のコンテナを同時操作できます。さらに、docker composeはただ複数のコンテナを同時立ちあげ、操作できるだけではなく、コンテナ同士で内部通信に必要な”Network”と共有するデータ”Volume”も定義できます。そのために.yaml記述Fileが必要です。
例えば今回の記事ではinfluxdb とtelegrafを同時立ち上げ、telegrafはInfluxdbのPlug-inなのでinfluxdbとtelegraf 間は通信が必要になり、Docker composeツールを活用できます。
Installation
https://docs.docker.com/compose/install/linux/#install-using-the-repository
| sudo apt-get update sudo apt-get install docker-compose-plugin sudo docker compose version |
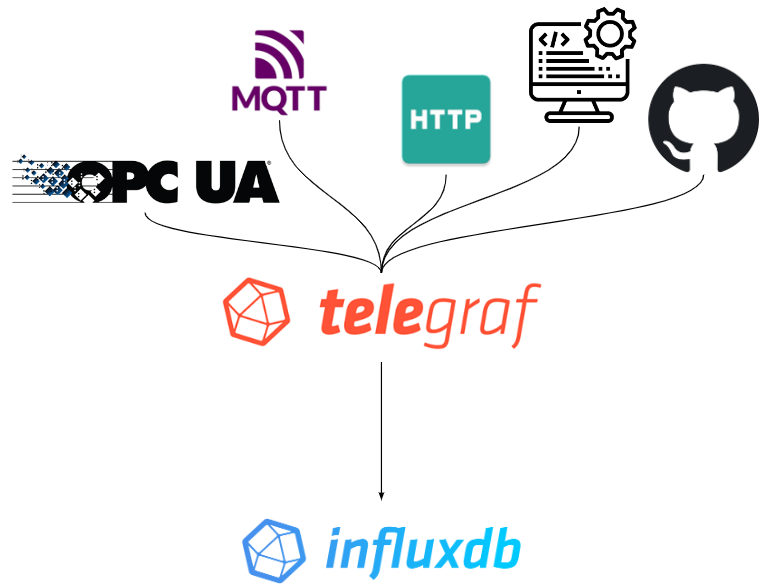
telegraf?
telegrafはOpen source server agentで他のシステム・センサー・Stacksからデータを簡単に収集することができます。telegrafはGO言語で実装され、データがSingle Binaryにコンパイルされ小さなデバイスにも使用できるようになります。
例えばOPCUA/MQTT/HTTP Listner/システムの状態/GITHUB、200種類以上のInput Pluginsがあります。TelegrafはNo Code/Low Codeで通信Driverなどを実装・Full stream Supoortもメリットあり。
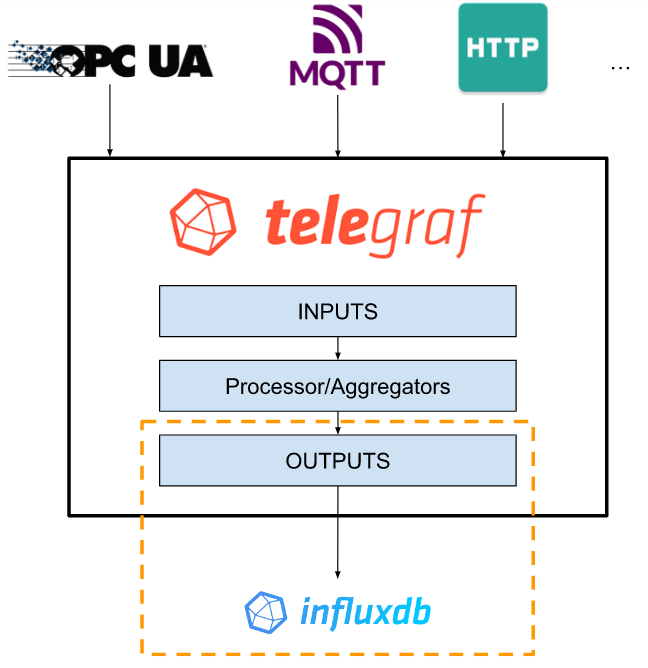
Structure
こちらはtelegrafの簡単な構造図になります。
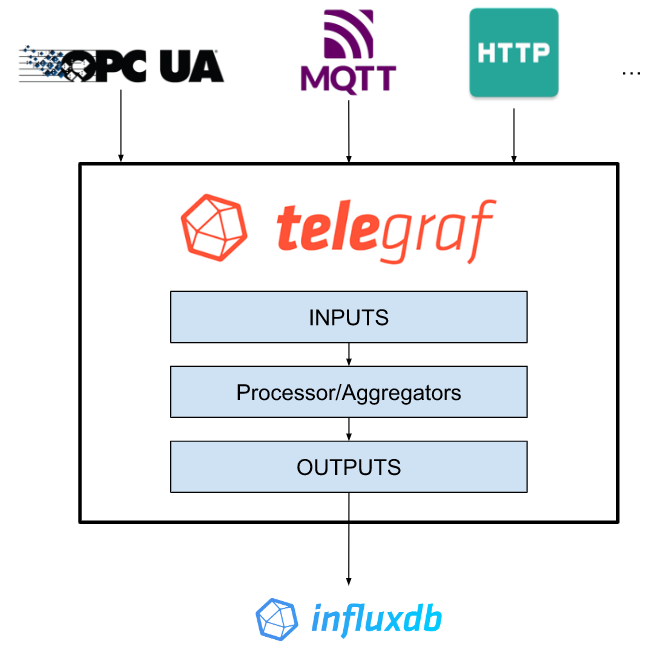
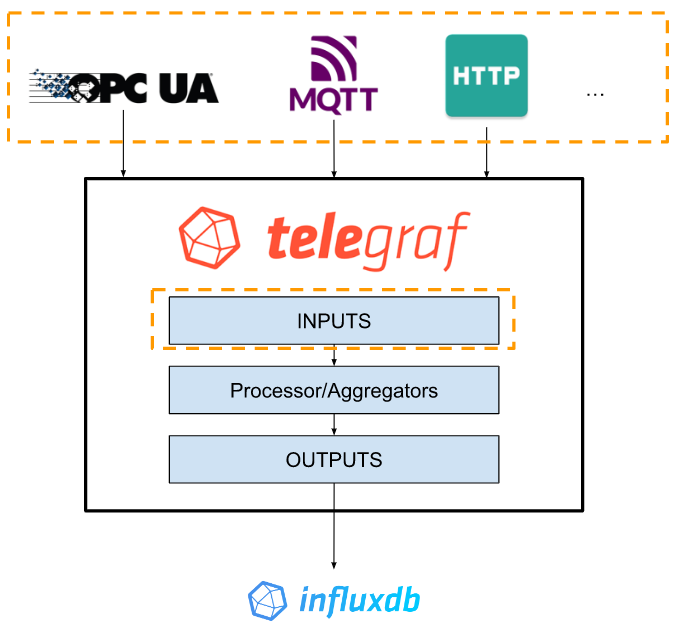
Data Resources
最初にどんなデータをInfluxdbに取り込みたいかを選択します。telegrafは200以上のPlug-inがあり、OPCUA、MQTTはもちろん、HTPPなど一般的なProtocolもSupportします。それでもなかった場合は、telegrafはOpen source なので自力でPluginを作ることも可能です。
Input Pliugsでは自分でTelegrafのConfiguration Fileを作成・構築する必要があります。
注意するのは各Plug-insにも自分だけのConfigurationがあります。
InputのFormatはJSON/CSV/XMLなどです。
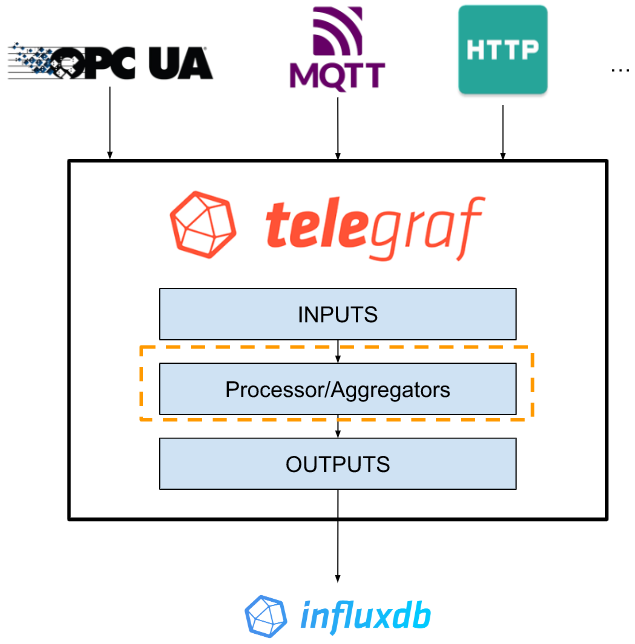
Processor/Aggregators
INPUTから取ったデータをなにかの処理する場合があるかもしれません。例えばMatrixの計算やFilterなど。そのとき使えるのはProcess/AggregatorsのPluginsです。
Processor Plug-insはInput plugs-insから受信した生データ(Raw data)を変換・Filterし、Output-plugs-inに出力します。
Aggregators Plug-insはInput plugs-insやProcessorから受信した生データ(Raw data)を新しい集計データに変換し(Matrix計算など)、Output-plugs-inに出力します。
Outputs
最後にOutput-plugs-inはデータをLine Protocolから各種類のデータに変換し、Influxdbに出力します。そのデータは可視化・Alert・Taskなどで使用することが可能です。もちろん特徴はInput plugsinと似て、複数の出力を構築や複数のデータFormatもSupportします。
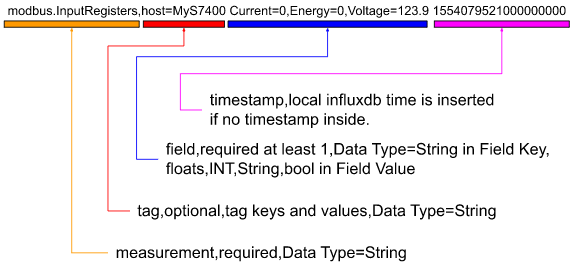
InfluxDB Line Protocol?
InfluxDB Line Protocol はテキストBaseで、InfluxDBデータベースにData Pointを書き込むためにあるProtocolです。そのInfluxDB Line Protocolにはいくつかの部品があります。
こちらはtelegraf Modubus PluginのInfluxDB Line Protocol Exampleです。
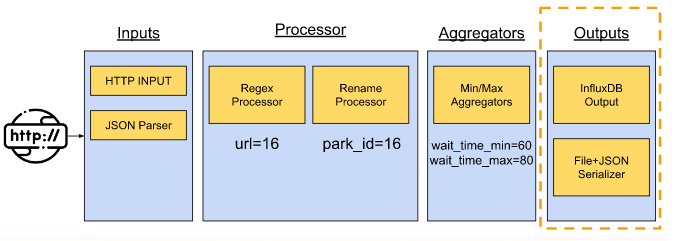
Work Flow Example
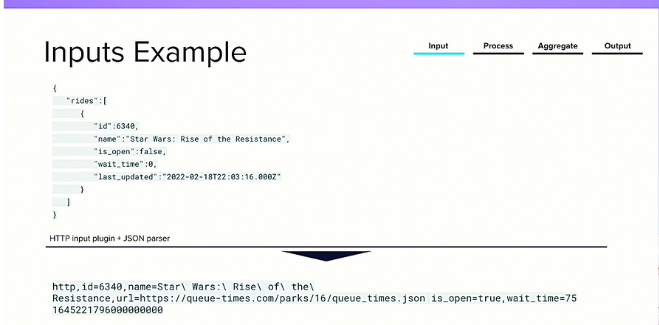
こちらはtelegrafの使用例になります。PublicのWeb SiteからJSONデータを取り、FileとInfluxDBに出力するまでのFlowです。
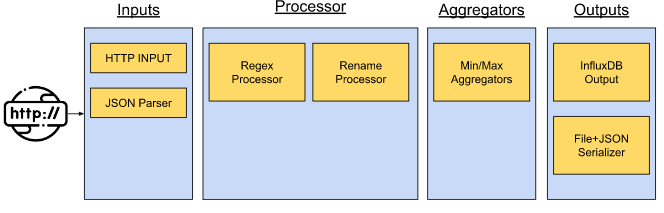
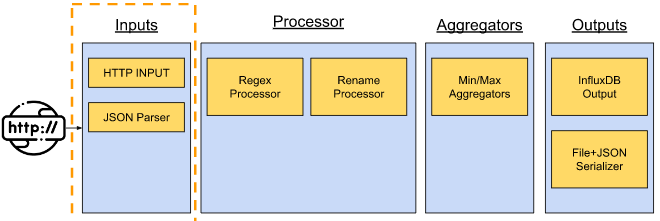
Inputs
Http Input plugsを使用し、Web SiteからJSON データを取得しJSON Parser Input Plug-insを使ってJSON データObjectをInfluxDB Line Protocolに変換します。
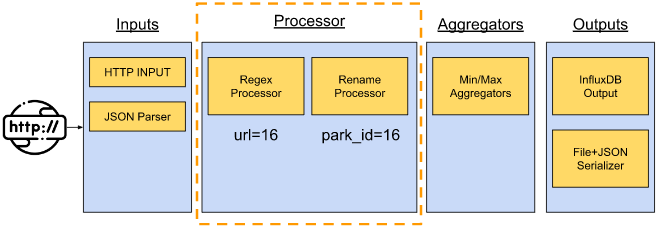
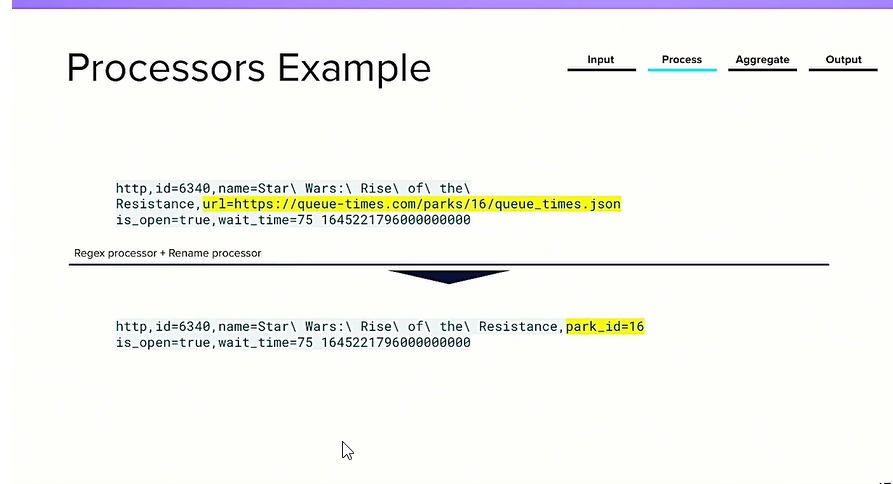
Processor
次はProcessor Plug-insを使用しUrl部分をpark_id=16に変換します。
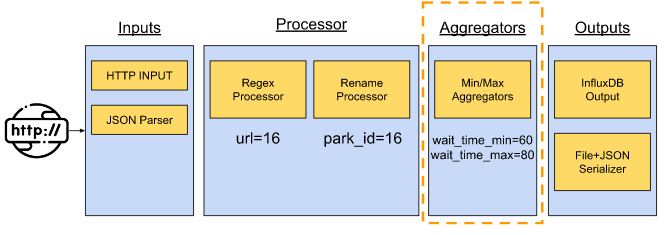
Aggregators
さらにデータを加工します。

Outputs
最後はOutputs データをInfluxDB Output PluginsをInfluxDBに出力し、それ以外のデータをJSON FormatのFileに保存します。

Play with Docker First!
まずDockerから始めたいと思います。docker compose ツールをインストールしてください。
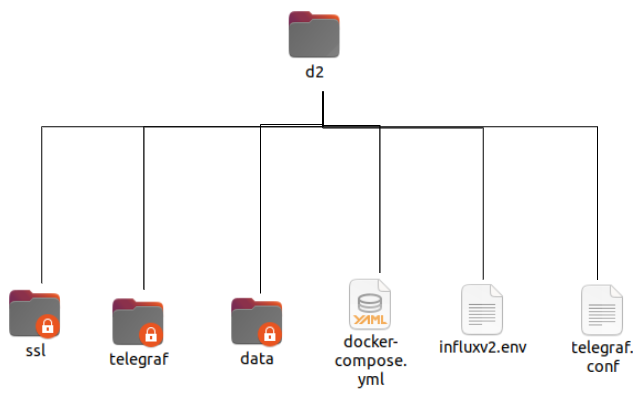
Directory Structure
こちらはDirectory の構成です。ssl/telegraf/dataはDocker composeするとき自動作成されるので気にしないでください。
Create the docker compose Directory
Folderを作ります。docker-compose.yml、influx2.env、telegraf.conf3日のテキストFileを作成します。
docker-compose.yml
このConfiguration を貼り付けます。
| version: ‘3’ services: influxdb: image: influxdb:latest volumes: # Mount for influxdb data directory and configuration – ./data/influxdb2:/var/lib/influxdb2 – ./data/influxdb2-config:/etc/influxdb2 ports: – “8086:8086” telegraf: image: telegraf links: – influxdb volumes: – ./telegraf.conf:/etc/telegraf/telegraf.conf:ro – /var/run/docker.sock:/var/run/docker.sock:ro – /sys:/rootfs/sys:ro – /proc:/rootfs/proc:ro – /etc:/rootfs/etc:ro env_file: – ./influxv2.env environment: – DOCKER_INFLUXDB_INIT_ORG=myorg – DOCKER_INFLUXDB_INIT_BUCKET=mybucket – DOCKER_INFLUXDB_INIT_ADMIN_TOKEN=mytoken depends_on: – influxdb volumes: influxdb2: |
telegraf.conf
このConfiguration を貼り付けます。
| [global_tags] [agent] interval = “60s” round_interval = true metric_batch_size = 1000 metric_buffer_limit = 10000 collection_jitter = “0s” flush_interval = “10s” flush_jitter = “0s” precision = “” hostname = “” omit_hostname = false [[outputs.influxdb_v2]] urls = [“http://influxdb:8086”] token = “my-super-secret-auth-token” organization = “my-org” bucket = “my-bucket” timeout = “5s” [[inputs.ping]] interval = “5s” urls = [“google.com”, “amazon.com”, “github.com”] count = 4 ping_interval = 1.0 timeout = 2.0 [[inputs.cpu]] percpu = true totalcpu = true collect_cpu_time = false report_active = false [[inputs.disk]] ignore_fs = [“tmpfs”, “devtmpfs”, “devfs”, “iso9660”, “overlay”, “aufs”, “squashfs”] [[inputs.diskio]] [[inputs.kernel]] [[inputs.mem]] [[inputs.processes]] [[inputs.swap]] [[inputs.system]] |
influx2.env
環境変数が格納されたFileなので、空きのままでよいです。
Run It
以下のコマンドでdocker compose を起動します。
| Sudo docker compose up |
Terminal が出力されていますね。もうDocker composeが稼働しています。

-d OptionsでBackgroud走るようになります。
| Sudo docker compose up -d |
Check the status
以下のコマンドでdockerの状態を確認します。
| sudo docker ps |
influxdb telegraf2つのDockerもう稼働していますね!

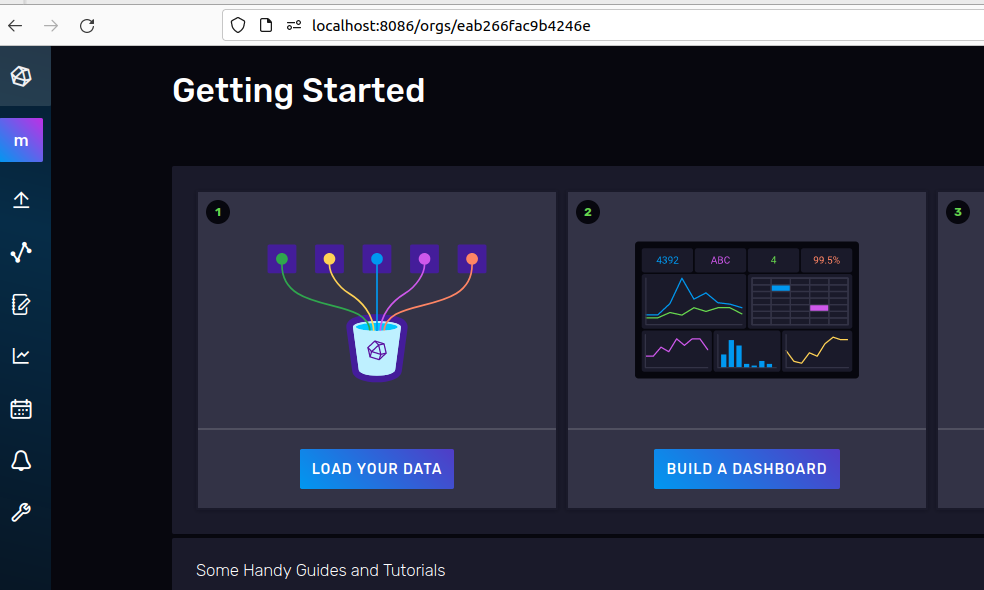
Access the Influxdb
localhost:8086からinfluxdbのSeverをアクセスします。
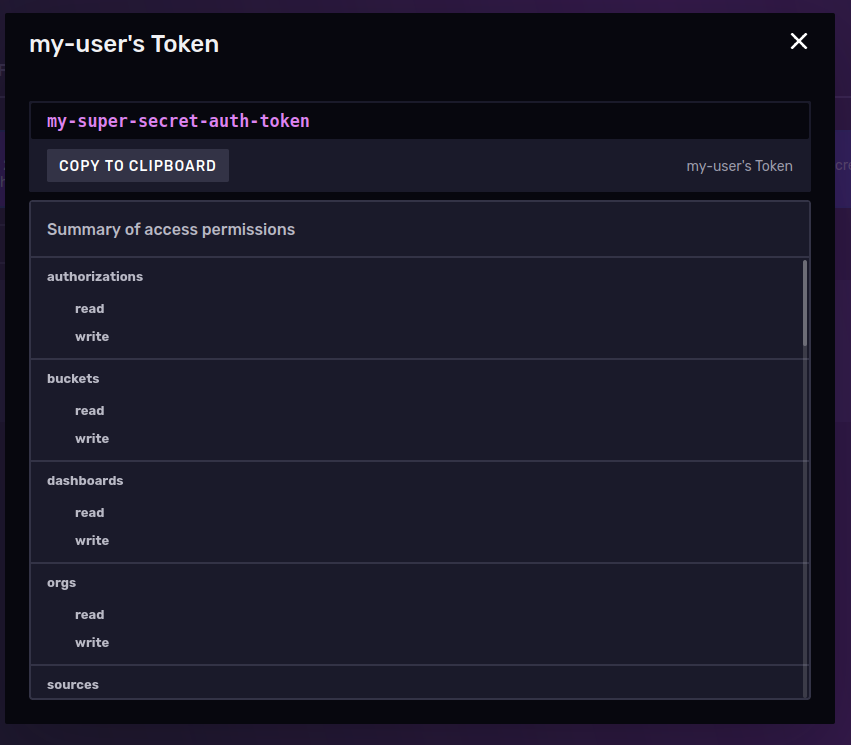
Check the token
まずAPI Tokensを確認します。
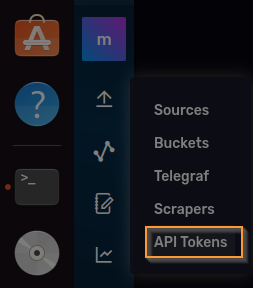
いま構築されているTokenをクリックします。
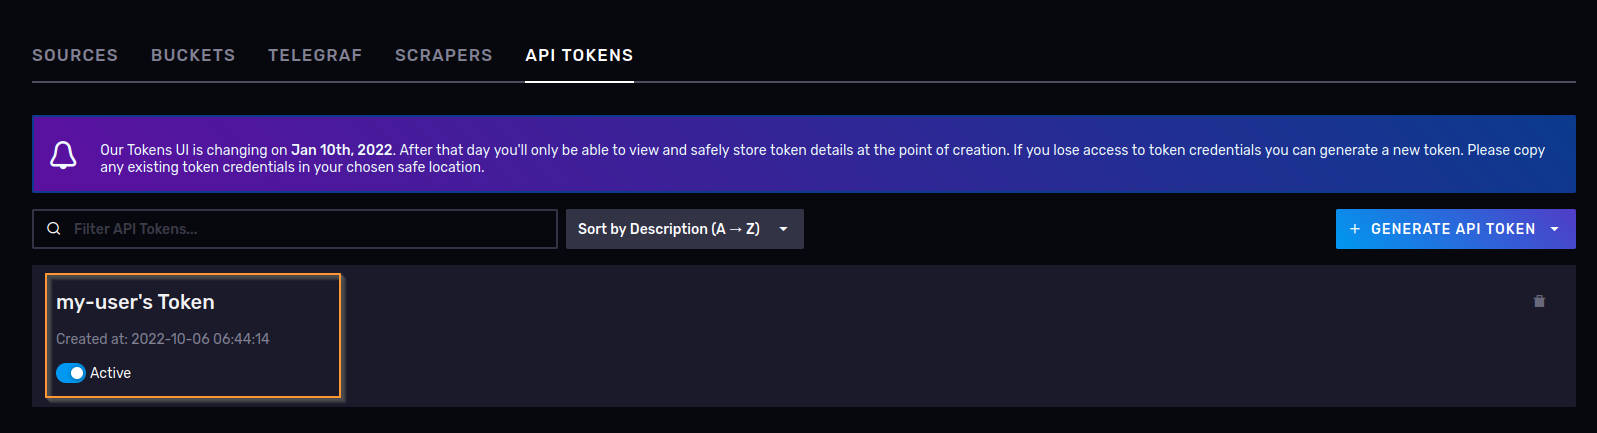
もしtelegraf認証に問題があればAPI KEYを再確認してください。
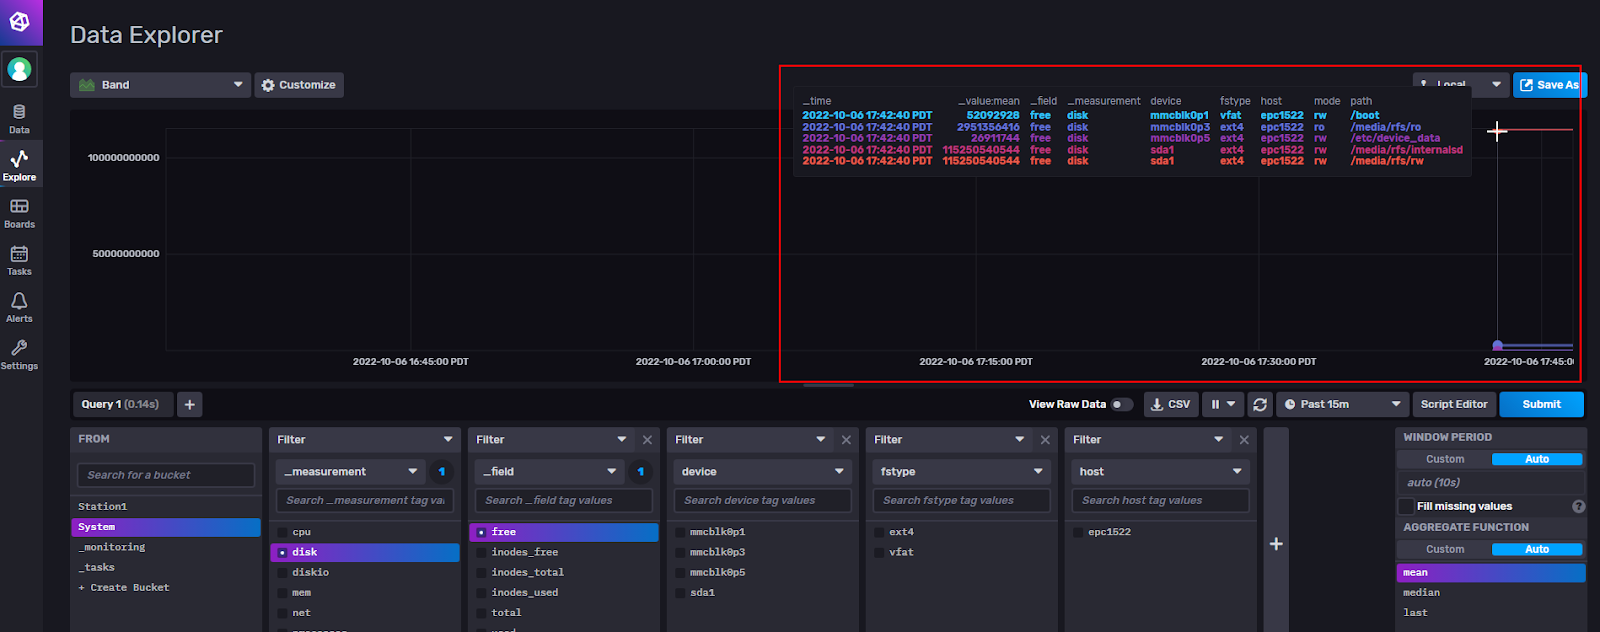
Check the Data
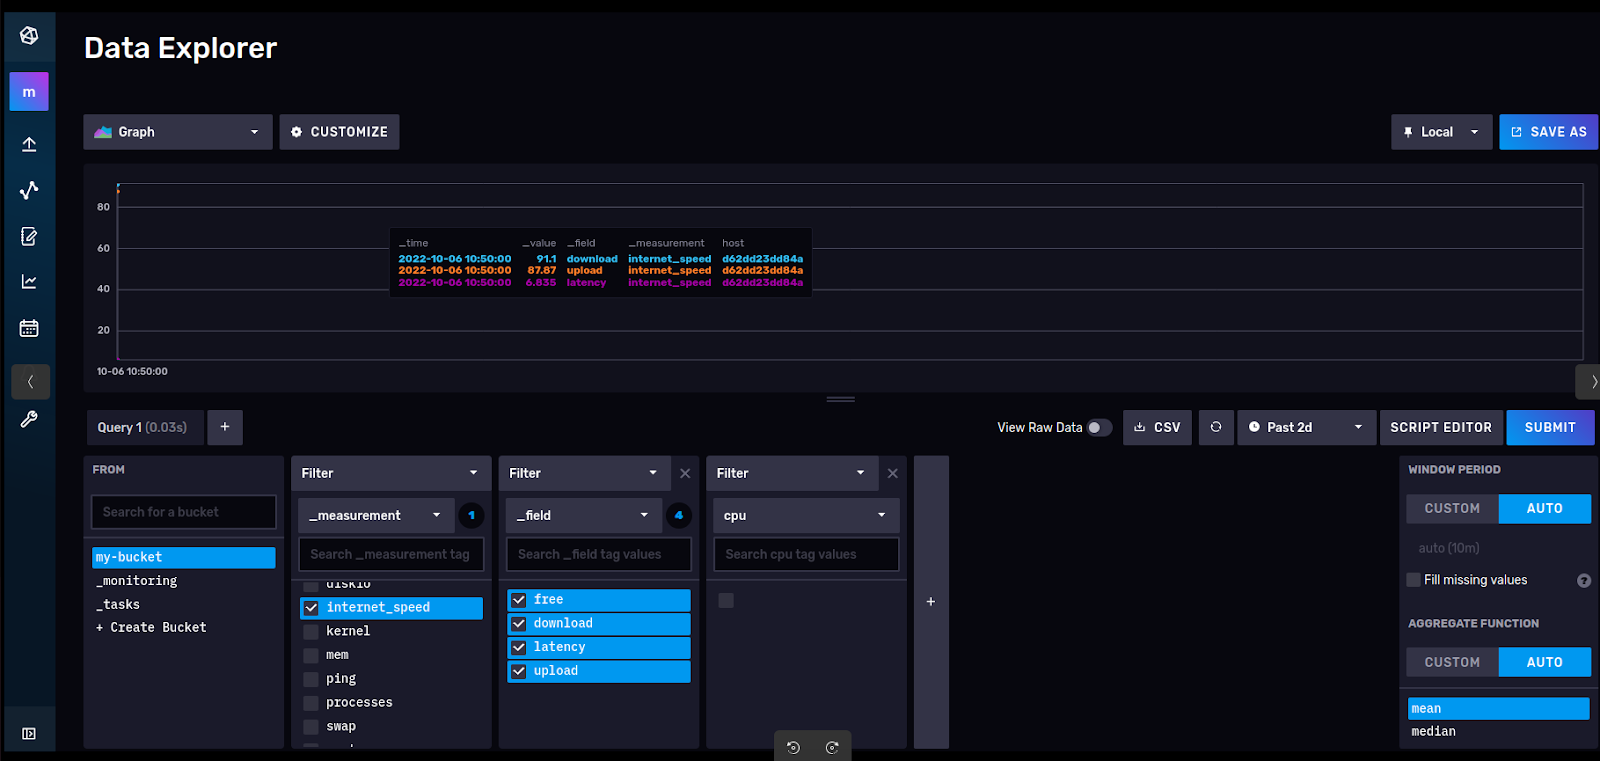
Data Exploerを開き、_measurementから_fieldを選び、SUBMITします。
データが表示されているのであればもう正常でtelegraf がデータを取れ、しかもinfluxdbに出力してます。

Add Telegraf Configuration
CPUがMonitorできましたが、もう1つのTelegraf Input plug-inを追加してみましょう。
Load YOUR DATAをクリックします。

Internetを検索し>Internet Speedをクリックします。
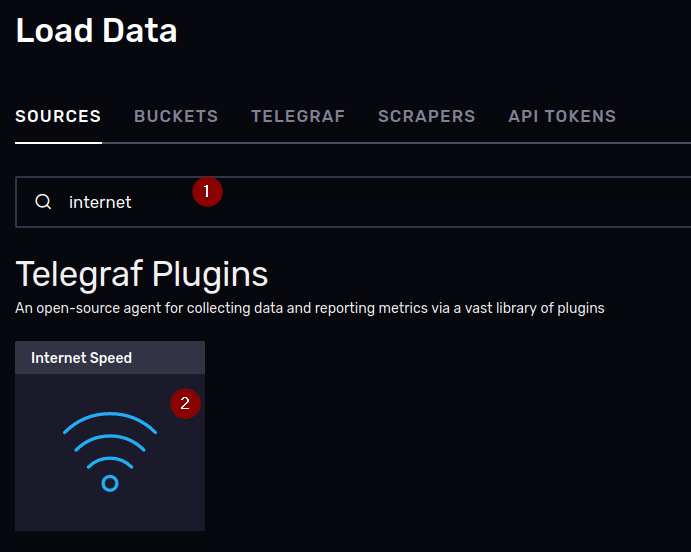
ConfigurationをそのままCOPYし、telegraf.confに貼り付ければ、
Example OutputのようなInfluxDB Line ProtocolがInfluxDBに出力されるようになります。

Edit the telegraf.conf
先のtelegraf.confの最後にInternet speed input plug-inのConfigurationをCopyし、貼り付けましょう。
| [global_tags] [agent] interval = “60s” round_interval = true metric_batch_size = 1000 metric_buffer_limit = 10000 collection_jitter = “0s” flush_interval = “10s” flush_jitter = “0s” precision = “” hostname = “” omit_hostname = false [[outputs.influxdb_v2]] urls = [“http://influxdb:8086”] token = “my-super-secret-auth-token” organization = “my-org” bucket = “my-bucket” timeout = “5s” [[inputs.ping]] interval = “5s” urls = [“google.com”, “amazon.com”, “github.com”] count = 4 ping_interval = 1.0 timeout = 2.0 [[inputs.cpu]] percpu = true totalcpu = true collect_cpu_time = false report_active = false [[inputs.disk]] ignore_fs = [“tmpfs”, “devtmpfs”, “devfs”, “iso9660”, “overlay”, “aufs”, “squashfs”] [[inputs.diskio]] [[inputs.kernel]] [[inputs.mem]] [[inputs.processes]] [[inputs.swap]] [[inputs.system]] [[inputs.internet_speed]] ## This plugin downloads many MB of data each time it is run. As such ## consider setting a higher interval for this plugin to reduce the ## demand on your internet connection. interval = “60m” ## Sets if runs file download test enable_file_download = false ## Caches the closest server location # cache = false |
Stop it and Run again!
以下のコマンドdocker composeを一回停止し再起動しましょう。
| sudo docker compose down |
Internet_speedのデータもみえるようになりましたね!
Play with EPC1522!
次はPhoenix Contactに内蔵してるInfluxDBとTelegrafからも試してみましょう。
Access the InfluxDB dashboard
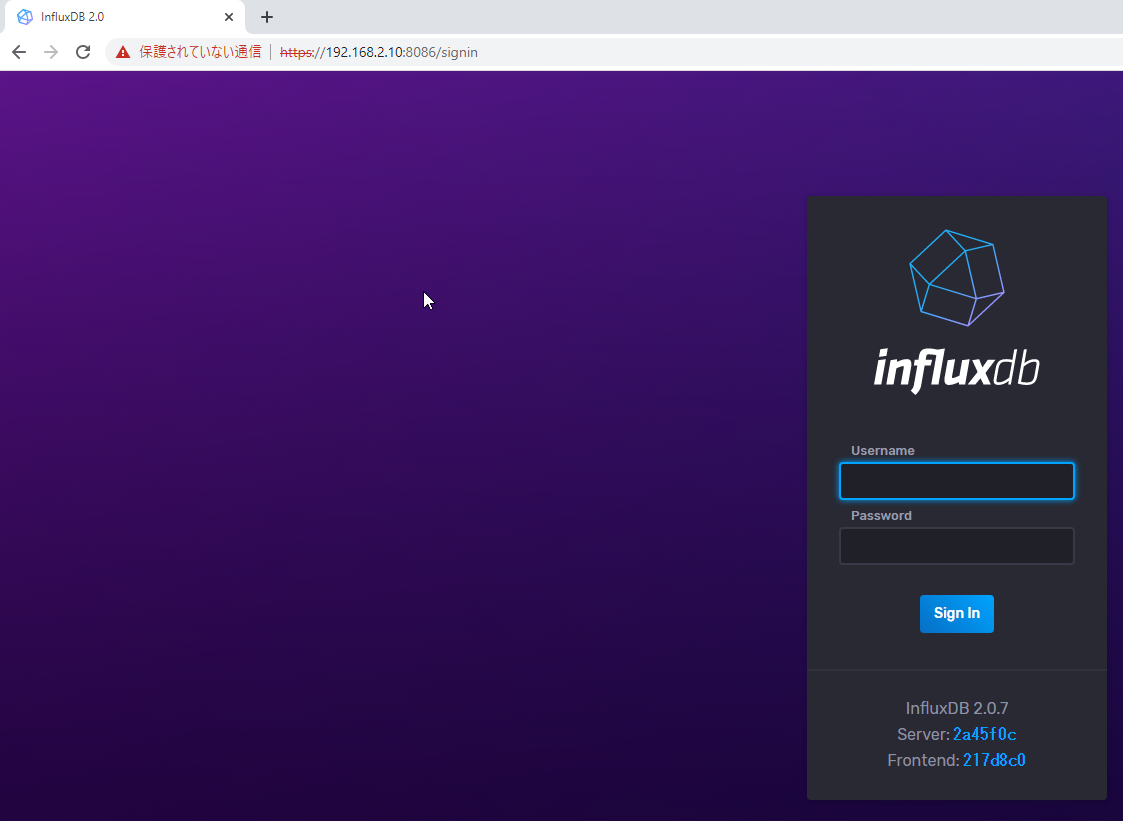
Web browserからhttps://yourIP:8086をアクセスします。

UsernameとPasswordを入力します。
Try to Load the data
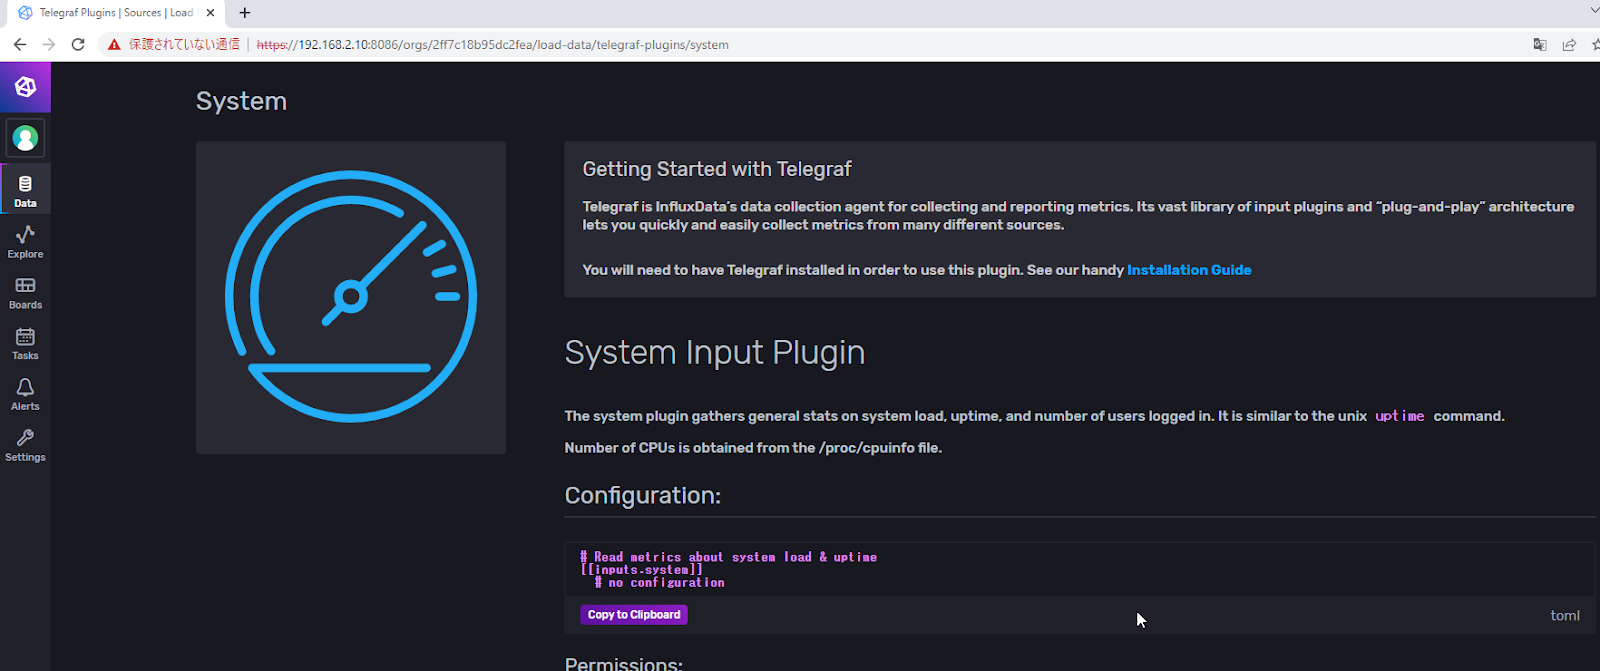
まずDataを読み込んでみましょう。Load your data ボタンをクリックします。
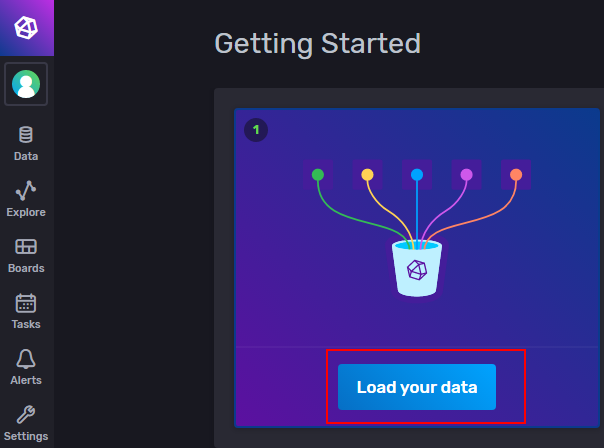
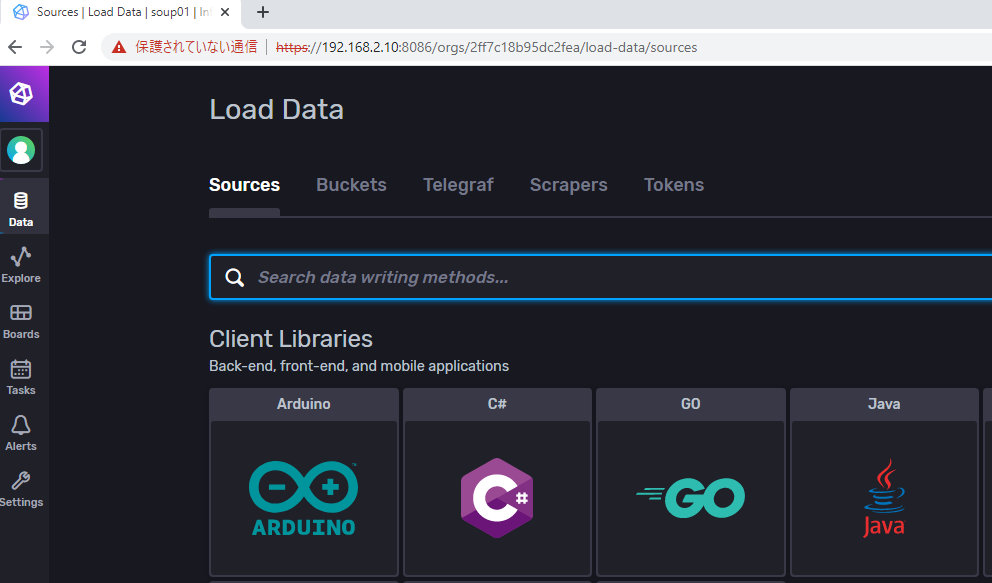
Load Dataの画面に切り替えました。
Systemを検索し>Systemをクリックします。
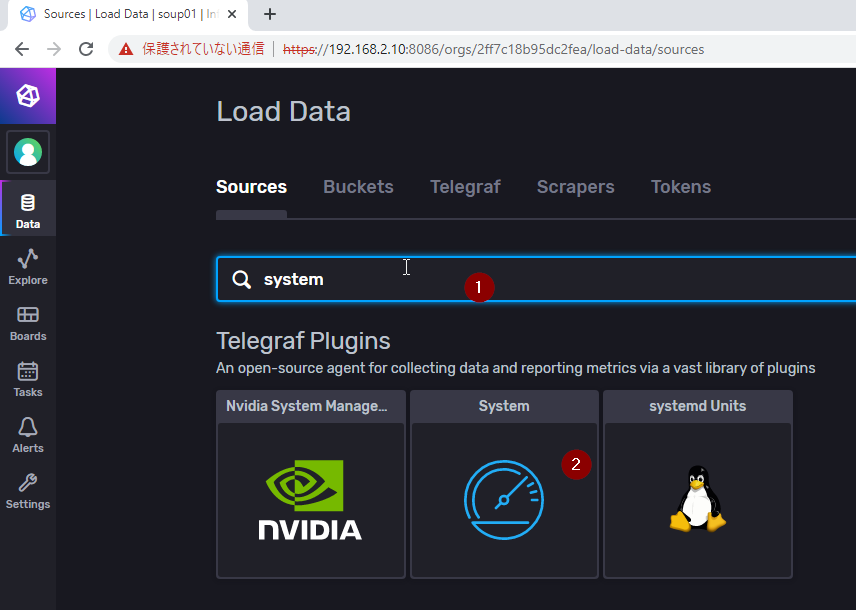
System input plugin画面が表示しました。
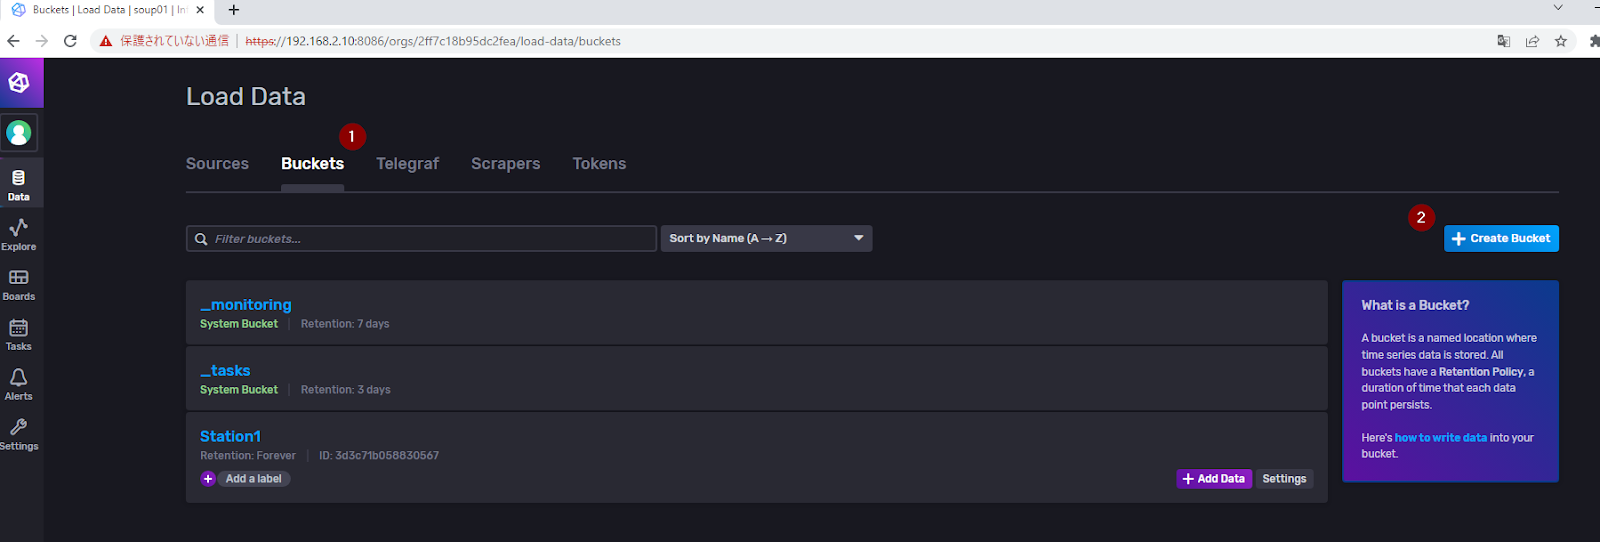
Create Buckets
Bucketsを作成します。Buckets Tabを開き>Create Bucketsします。
Bucketsの名前入れ、Createします。
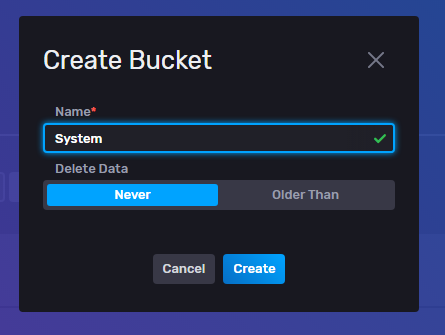
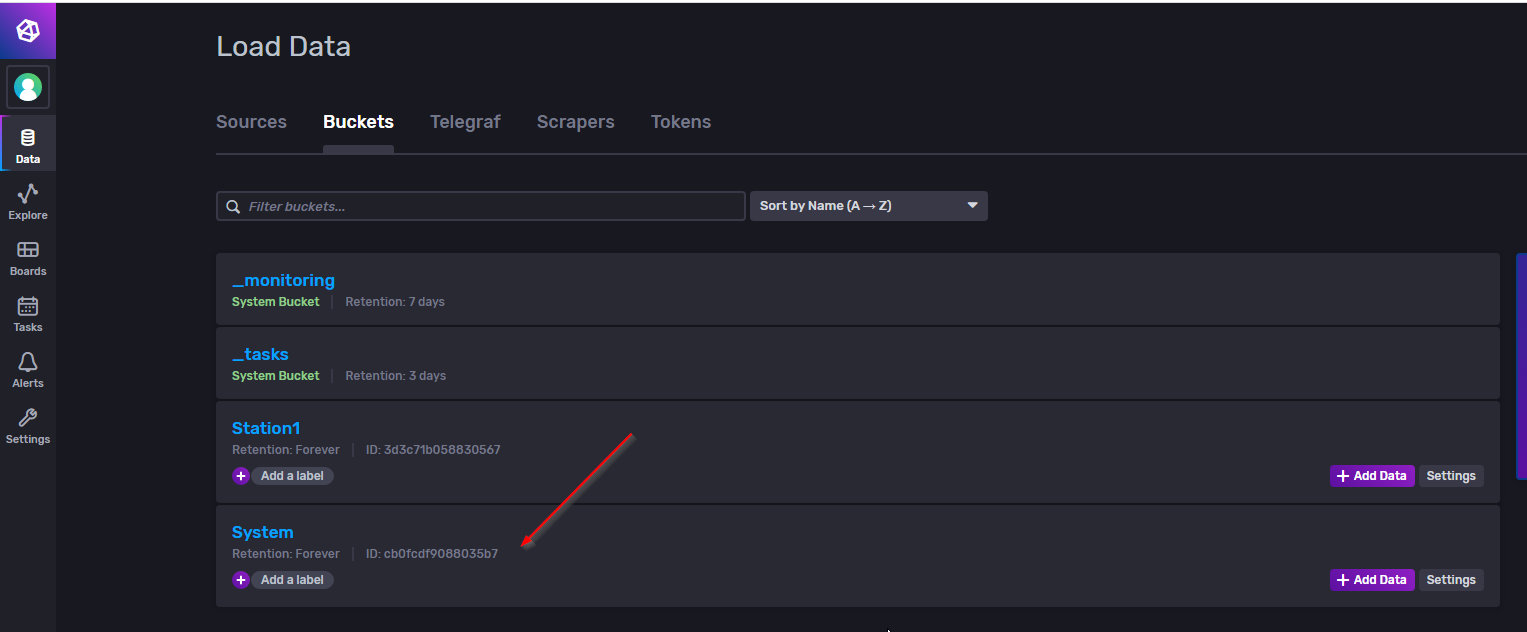
SystemというBucketsが作成されました。
Create Telegraf Configuration
次はTelegrafのConfigurationを作成します。TelegrafのTab開き>Create Configurationします。

Telegraf Configuration画面が表示されました。
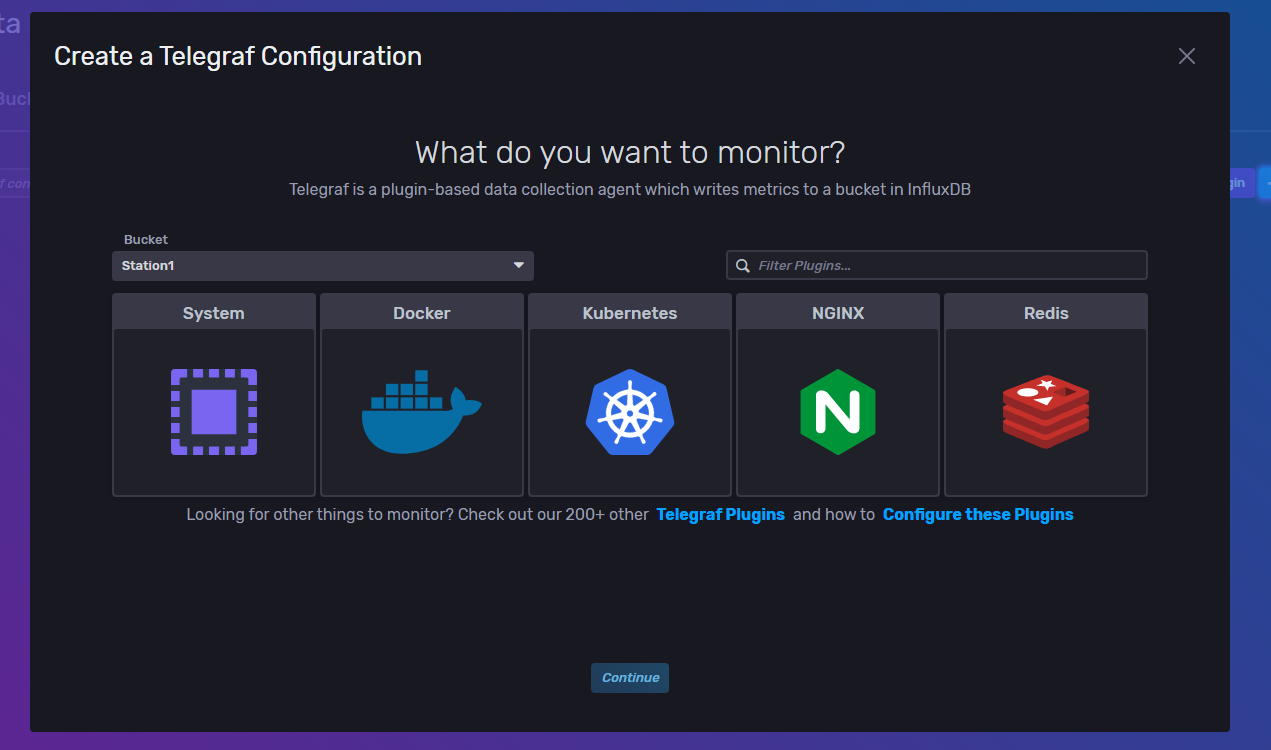
BucketsではSystemを選びます。
次はSystemをクリックします。
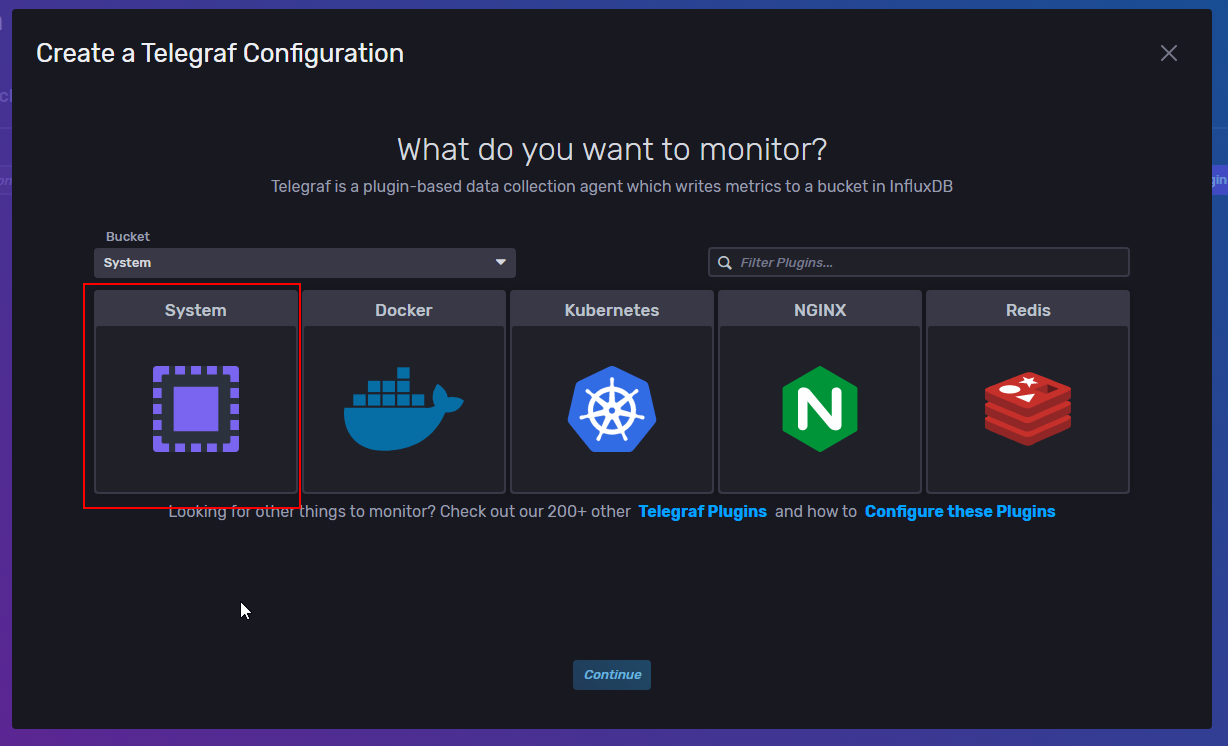
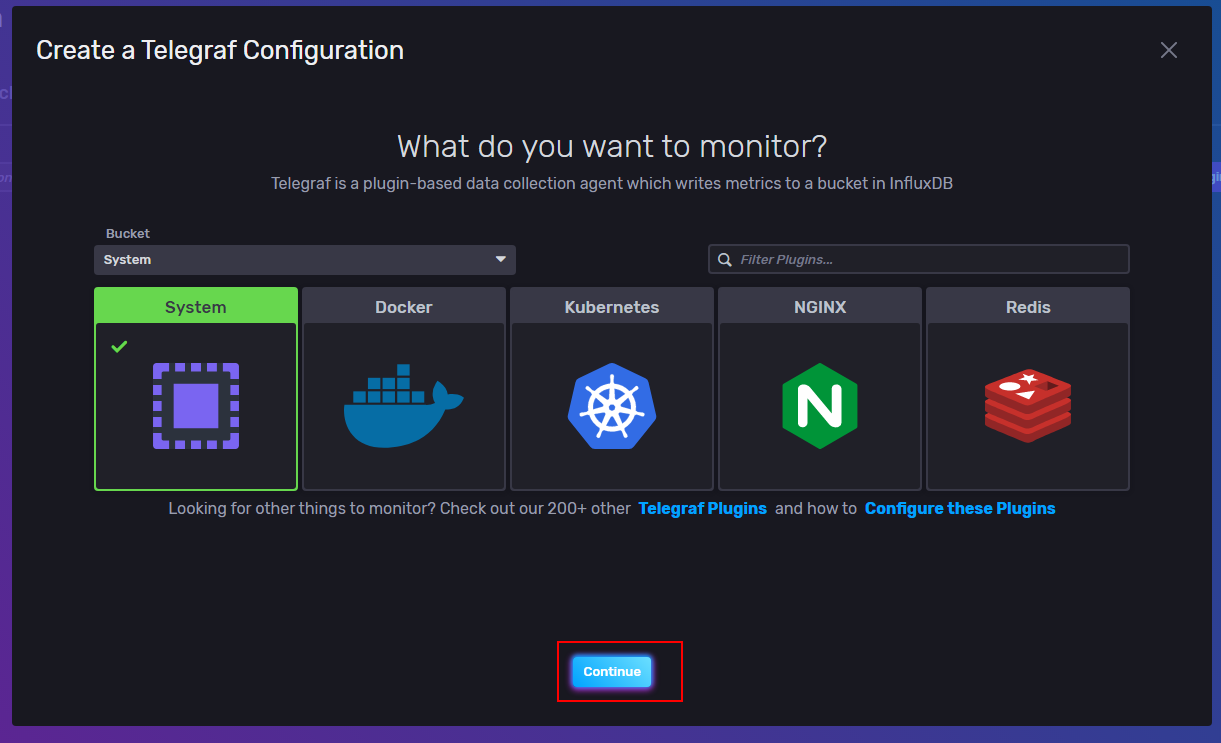
緑がなればもう選ばれた状態で、Contiueで進みます。
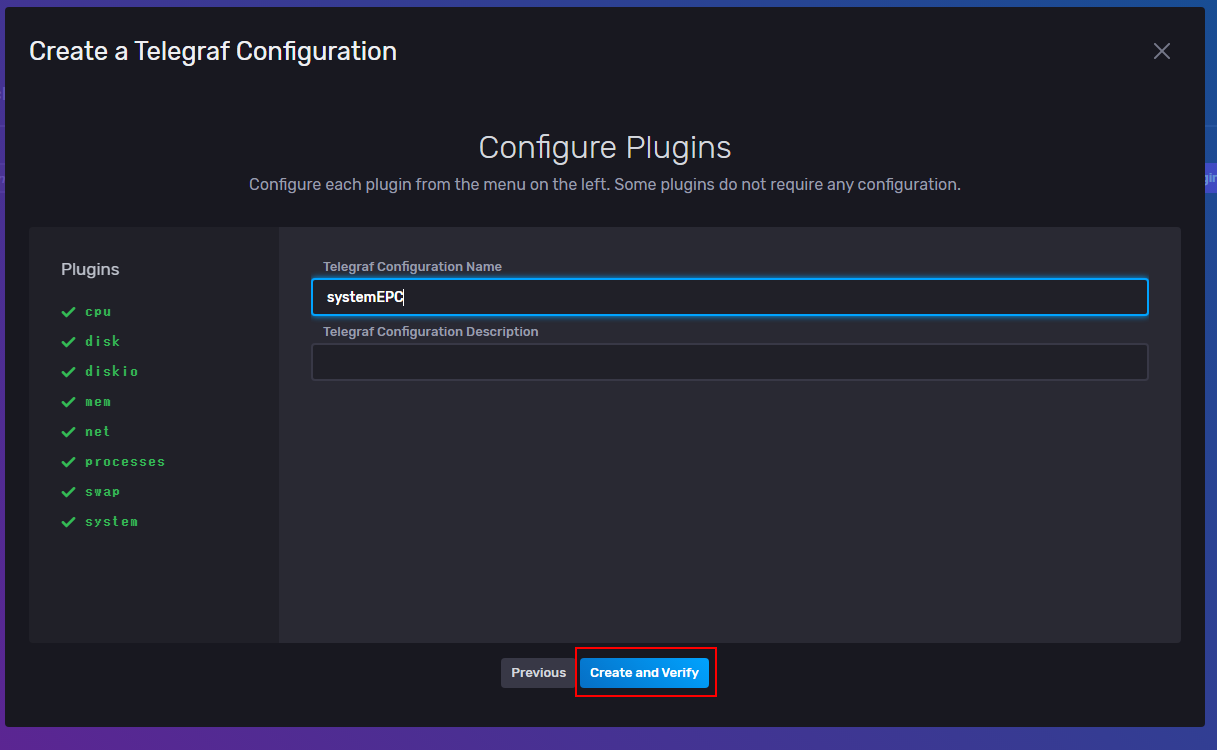
このConfigurationでOKでしたら、Configuration名を入れてください。
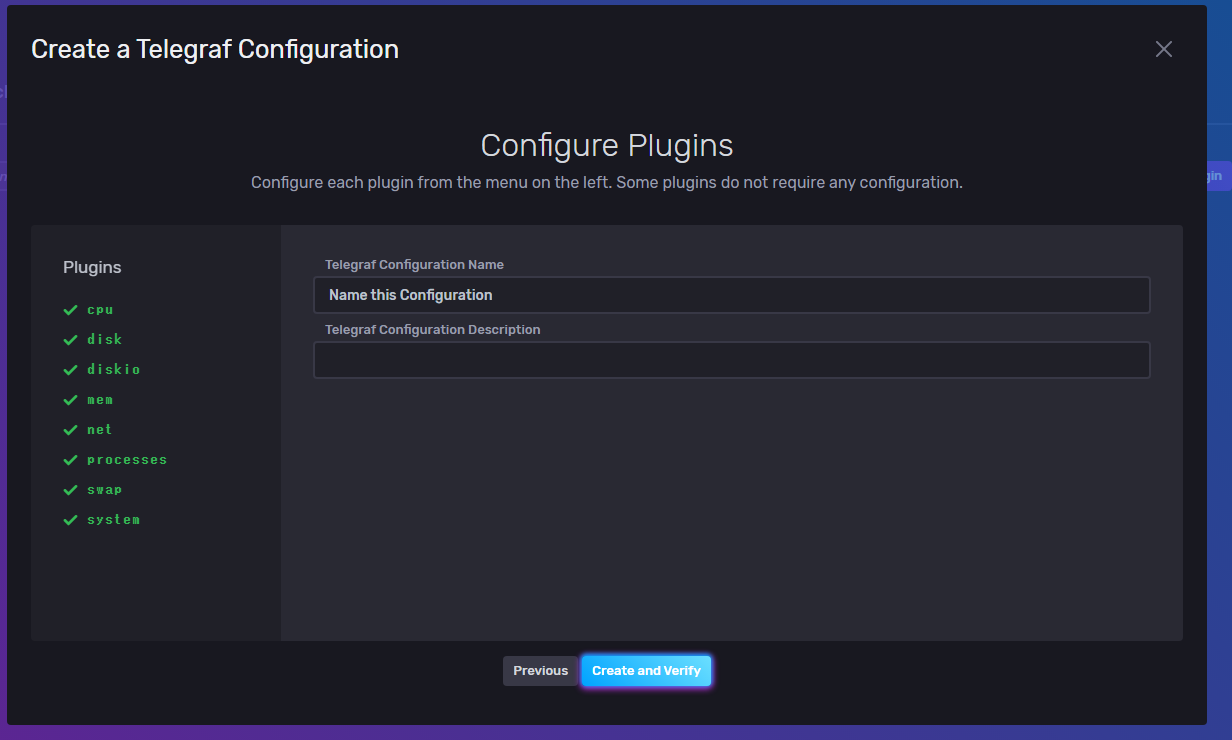
Create and Verifyで進みます。
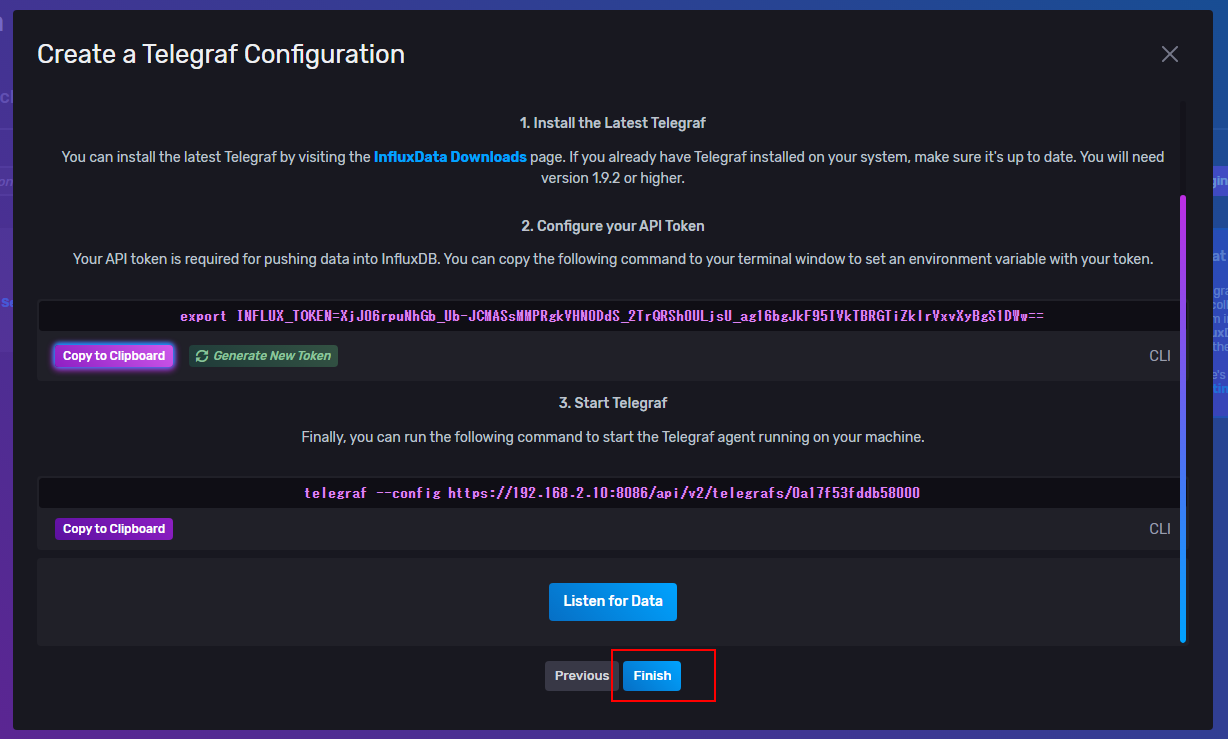
Test your Configurationの画面が出てきます。ここでまだFinishを押さないでください!
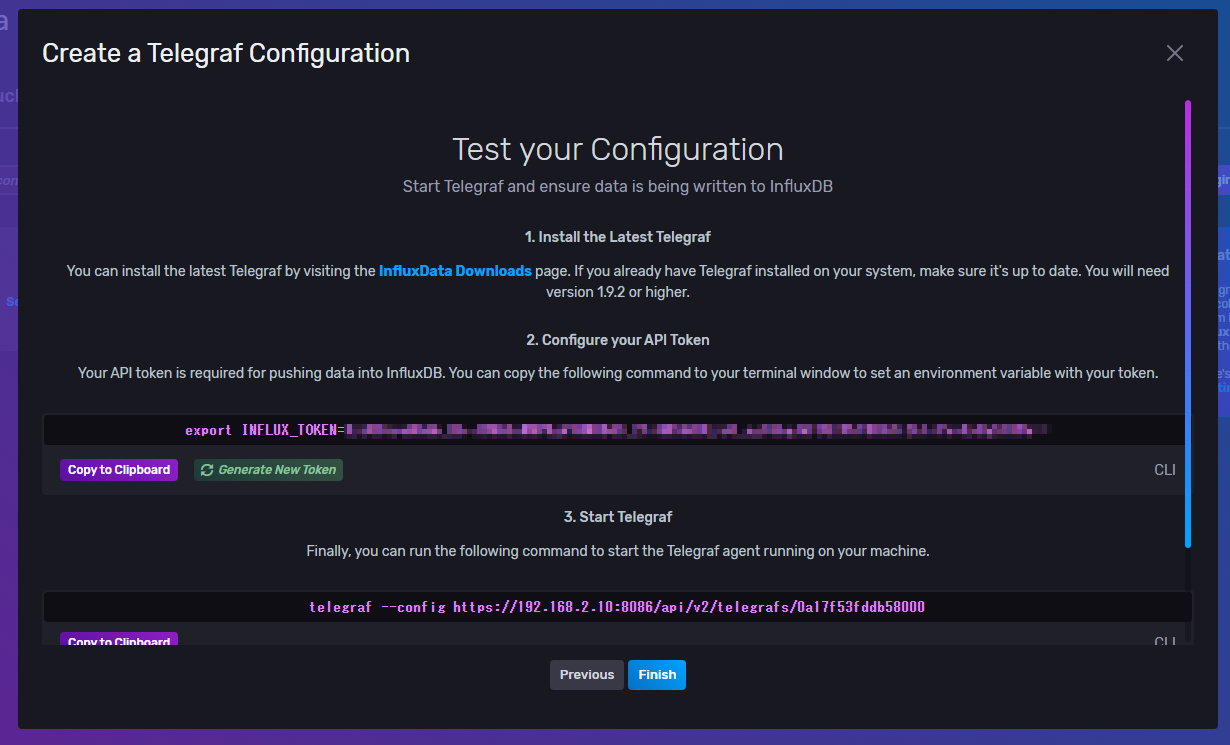
Copy the Telegraf Token
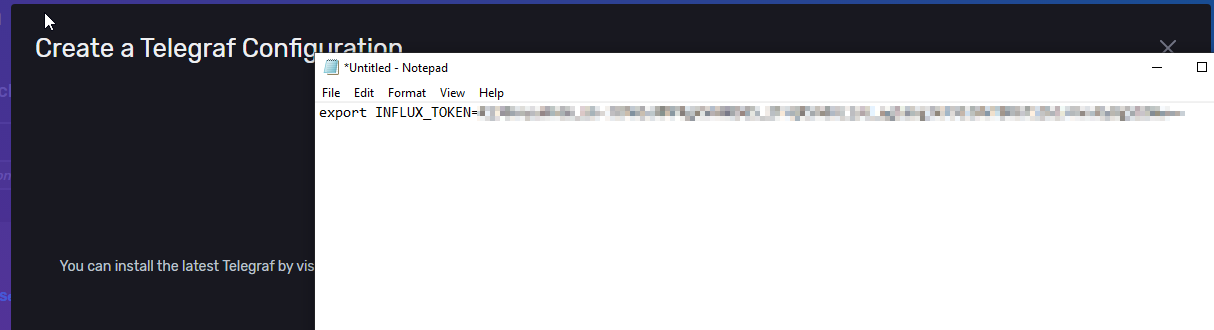
2. Configure API tokenのところで”Copy to Clipboard”をクリックします。
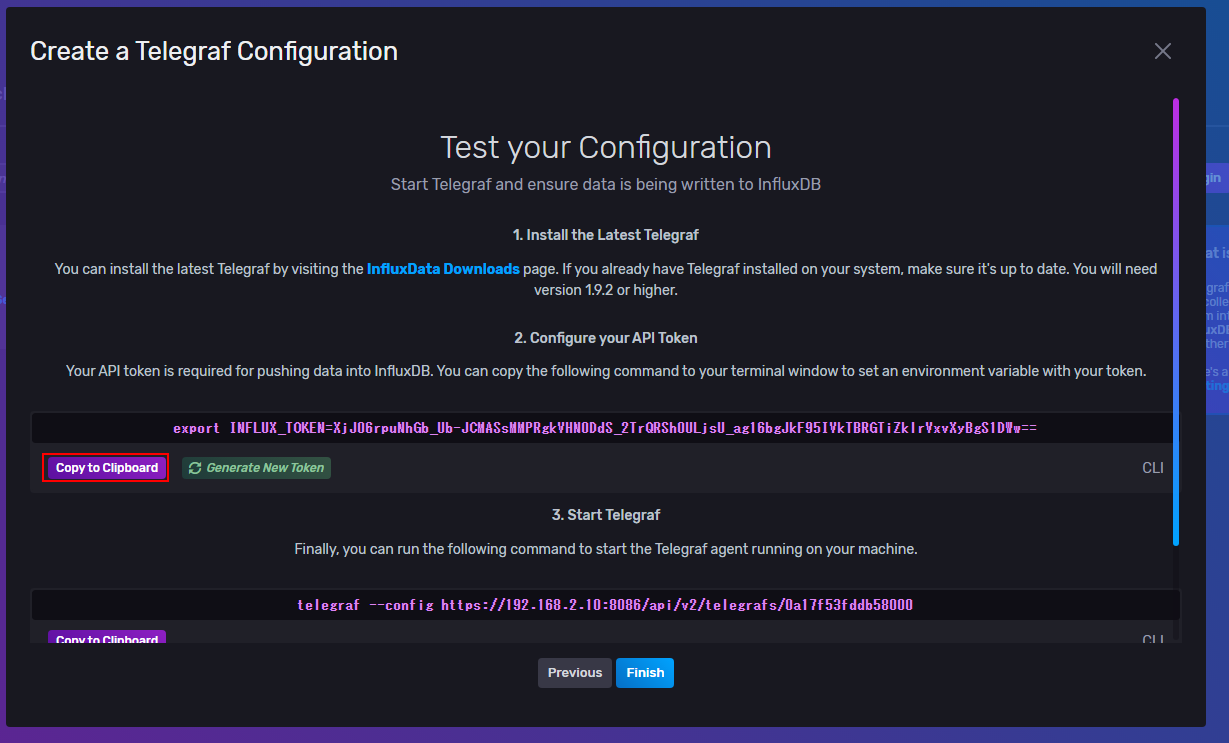
CopyされたTokenをNodepadなどで貼り付けて大事に保存してください。
Save the Telegraf Configuration
最後はFinishボタンでTelegraf Configurationを保存し、完成です。
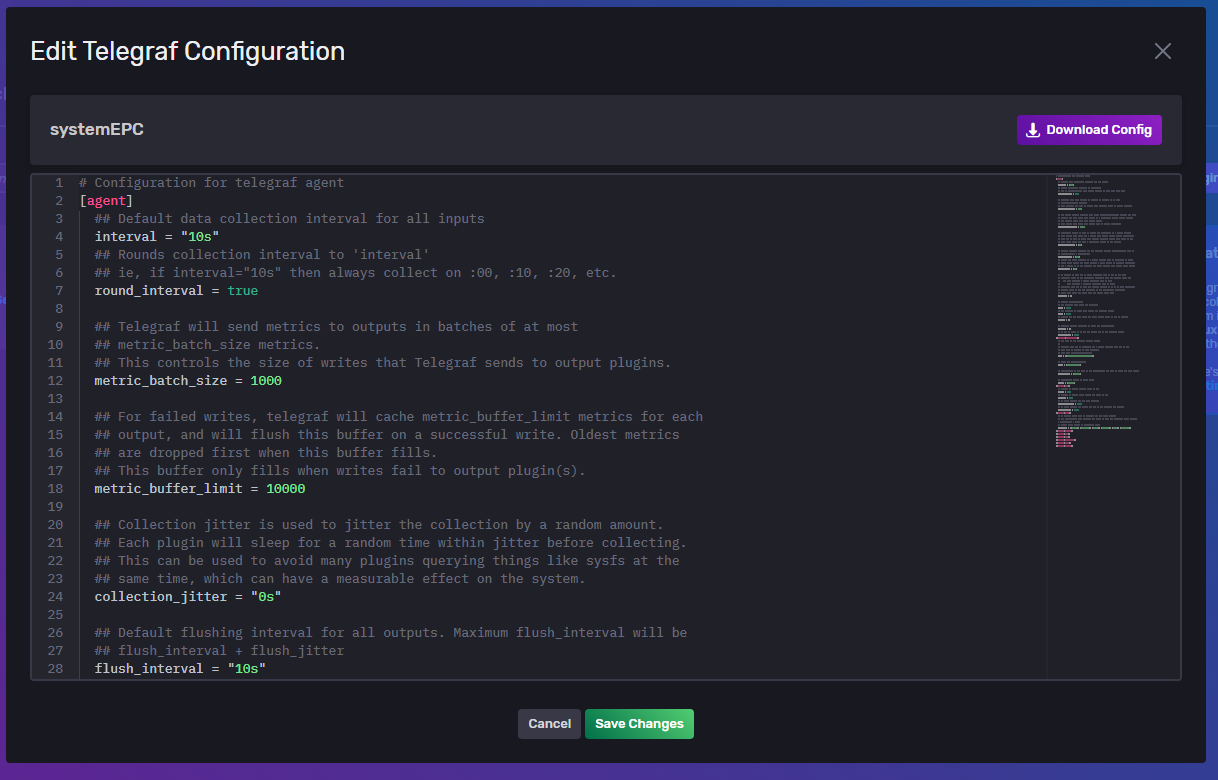
Download the Telegraf Configuration
TelegrafのTabに先に先ほど追加した”systemEPC”のTelegraf Connection がありましたね。

systemEPCをクリックします。

Telegraf ConfigurationのFileが表示されます。
Edit – insecure skip verify
まずurlsの下に “insecure_skip_verify=true”を追加します。
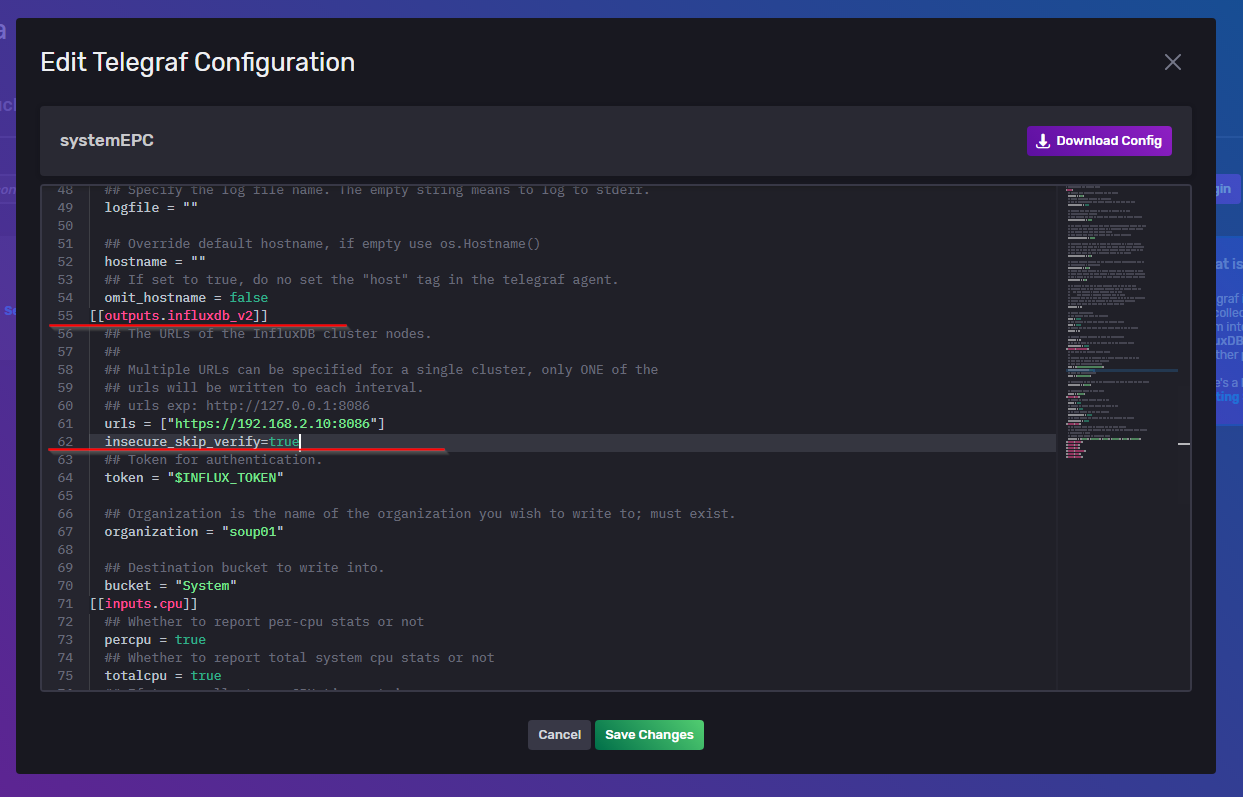
Edit – API User Token
次は先程Copyした”token=xxxxxxxxxxxxxxxxxx”も貼り付けてください。

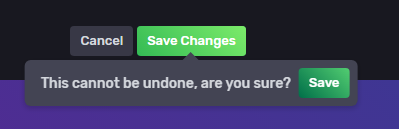
Save Changes
Save Changes でConfigurationを保存します。
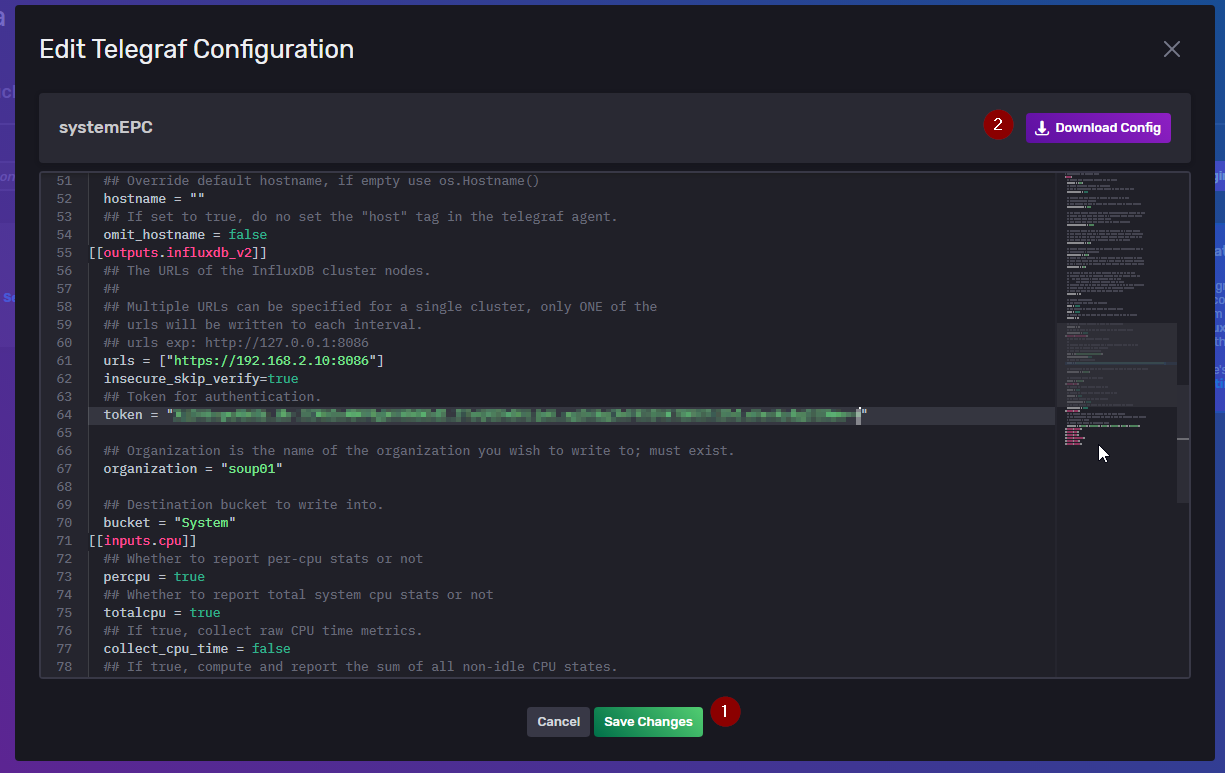
Save!
次はConfigurationをDownloadします。
My Telegraf.config
それは実際私のConfiguration Fileです。
| # Configuration for telegraf agent [agent] ## Default data collection interval for all inputs interval = “10s” ## Rounds collection interval to ‘interval’ ## ie, if interval=”10s” then always collect on :00, :10, :20, etc. round_interval = true ## Telegraf will send metrics to outputs in batches of at most ## metric_batch_size metrics. ## This controls the size of writes that Telegraf sends to output plugins. metric_batch_size = 1000 ## For failed writes, telegraf will cache metric_buffer_limit metrics for each ## output, and will flush this buffer on a successful write. Oldest metrics ## are dropped first when this buffer fills. ## This buffer only fills when writes fail to output plugin(s). metric_buffer_limit = 10000 ## Collection jitter is used to jitter the collection by a random amount. ## Each plugin will sleep for a random time within jitter before collecting. ## This can be used to avoid many plugins querying things like sysfs at the ## same time, which can have a measurable effect on the system. collection_jitter = “0s” ## Default flushing interval for all outputs. Maximum flush_interval will be ## flush_interval + flush_jitter flush_interval = “10s” ## Jitter the flush interval by a random amount. This is primarily to avoid ## large write spikes for users running a large number of telegraf instances. ## ie, a jitter of 5s and interval 10s means flushes will happen every 10-15s flush_jitter = “0s” ## By default or when set to “0s”, precision will be set to the same ## timestamp order as the collection interval, with the maximum being 1s. ## ie, when interval = “10s”, precision will be “1s” ## when interval = “250ms”, precision will be “1ms” ## Precision will NOT be used for service inputs. It is up to each individual ## service input to set the timestamp at the appropriate precision. ## Valid time units are “ns”, “us” (or “µs”), “ms”, “s”. precision = “” ## Logging configuration: ## Run telegraf with debug log messages. debug = false ## Run telegraf in quiet mode (error log messages only). quiet = false ## Specify the log file name. The empty string means to log to stderr. logfile = “” ## Override default hostname, if empty use os.Hostname() hostname = “” ## If set to true, do no set the “host” tag in the telegraf agent. omit_hostname = false [[outputs.influxdb_v2]] ## The URLs of the InfluxDB cluster nodes. ## ## Multiple URLs can be specified for a single cluster, only ONE of the ## urls will be written to each interval. ## urls exp: http://127.0.0.1:8086 urls = [“https://192.168.2.10:8086”] insecure_skip_verify=true ## Token for authentication. token = “xxxxxxxxxxxxxxxxxxxxxxxxxxxxxxxxxxxxxxxxxxxxxxxxxxxxxxxxxxxxxxxxxxxxxxx” ## Organization is the name of the organization you wish to write to; must exist. organization = “soup01” ## Destination bucket to write into. bucket = “System” [[inputs.cpu]] ## Whether to report per-cpu stats or not percpu = true ## Whether to report total system cpu stats or not totalcpu = true ## If true, collect raw CPU time metrics. collect_cpu_time = false ## If true, compute and report the sum of all non-idle CPU states. report_active = false [[inputs.disk]] ## By default stats will be gathered for all mount points. ## Set mount_points will restrict the stats to only the specified mount points. # mount_points = [“/”] ## Ignore mount points by filesystem type. ignore_fs = [“tmpfs”, “devtmpfs”, “devfs”, “overlay”, “aufs”, “squashfs”] [[inputs.diskio]] [[inputs.mem]] [[inputs.net]] [[inputs.processes]] [[inputs.swap]] [[inputs.system]] |
Transfer the Configuration file to EPC1522
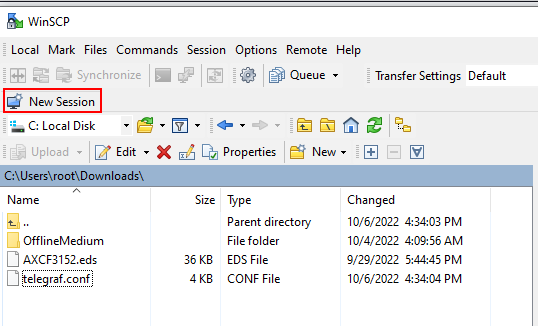
Telegraf Configuration FileをEPC1522に転送します。WinSCPを立ち上げます。
もしやり方がわからない方では下記のTutorialを参考にしてください。

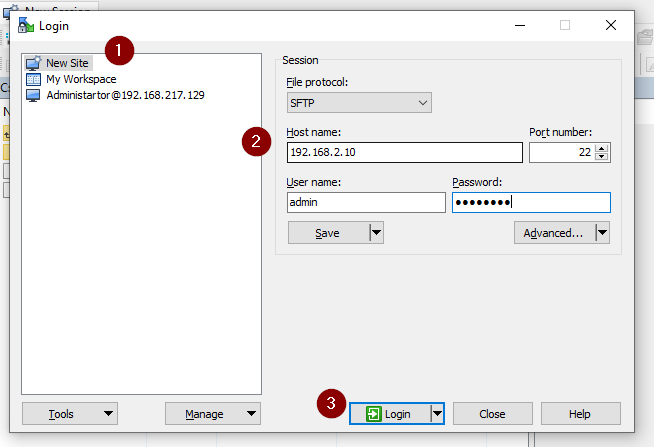
Login
New SessionでLoginします。
New Site>Host NameはEPC1522のIP、UesrnameとPasswordを入れ>Loginします。
Yesします。

Continueします。
Login成功しました。

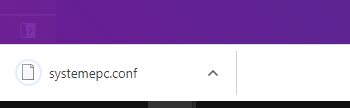
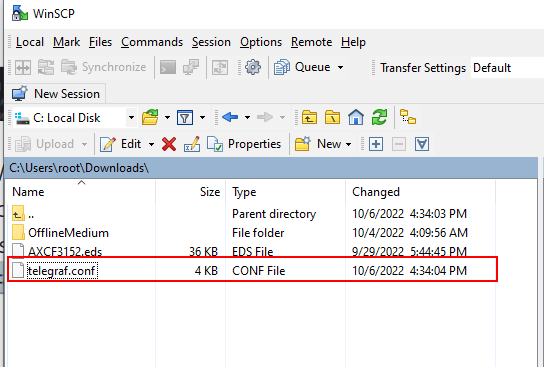
Rename
先程Downloadしたsystemepc.confをRenameします。

telegraf.confに変更すればOKです。
Backup the Telegraf.config
/opt/plcnext/edge/telegraf/etc/telegraf/に移動し、
転送する前にもちろんEPC1522のConfigurationをBackupしてきます。
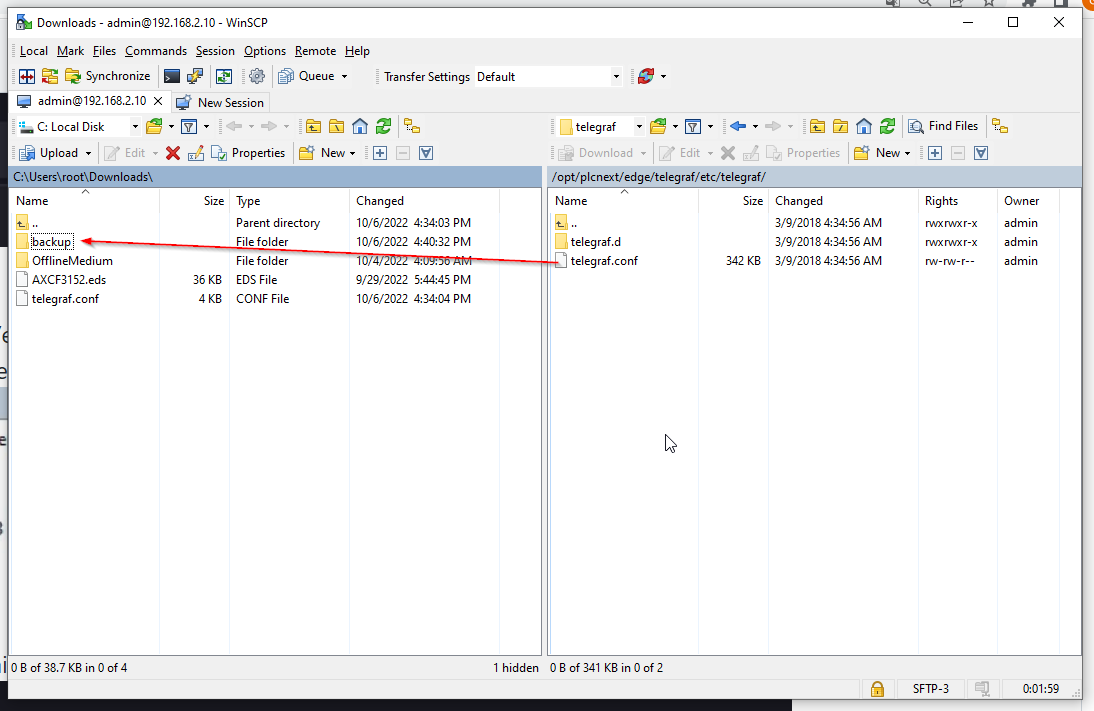
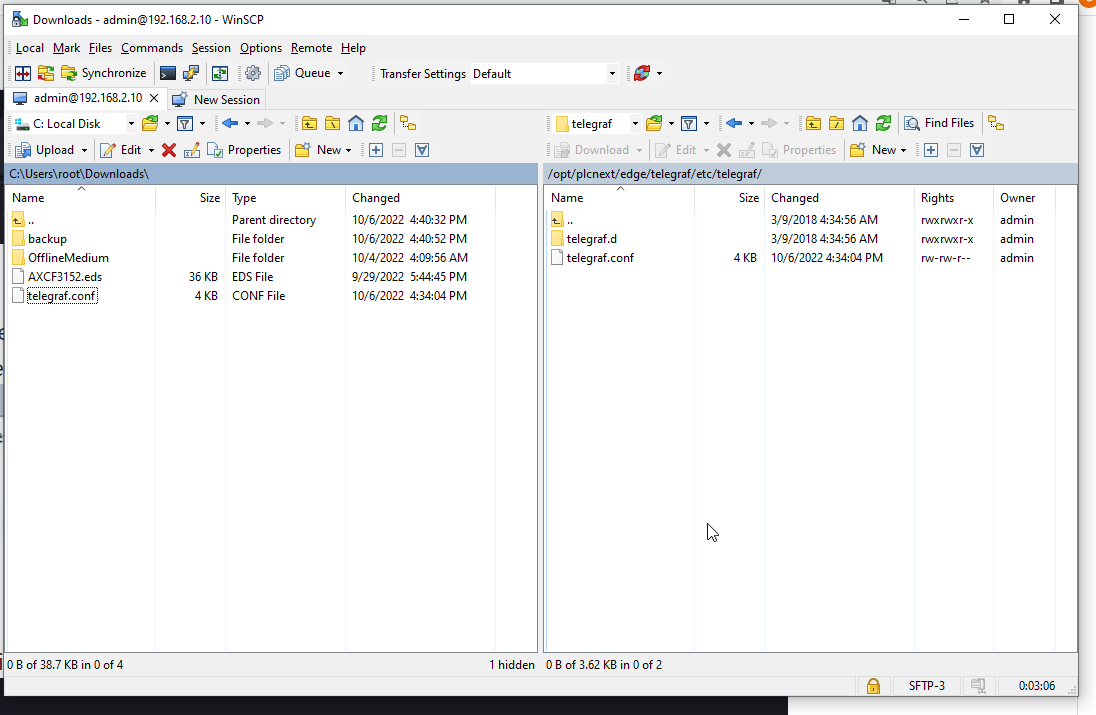
Transfer the file
telegraf.confをEPC1522の/opt/plcnext/edge/telegraf/etc/telegraf/に転送します。

完成です。
Check the Result
Restart the EPC1522
まずEPC1522の電源を入れ直してください。
Explore
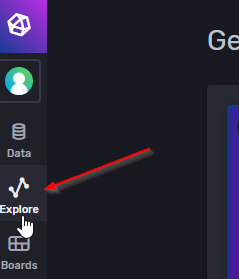
SystemのBucketsを選びます。

いまDisckの空き容量を取得します。

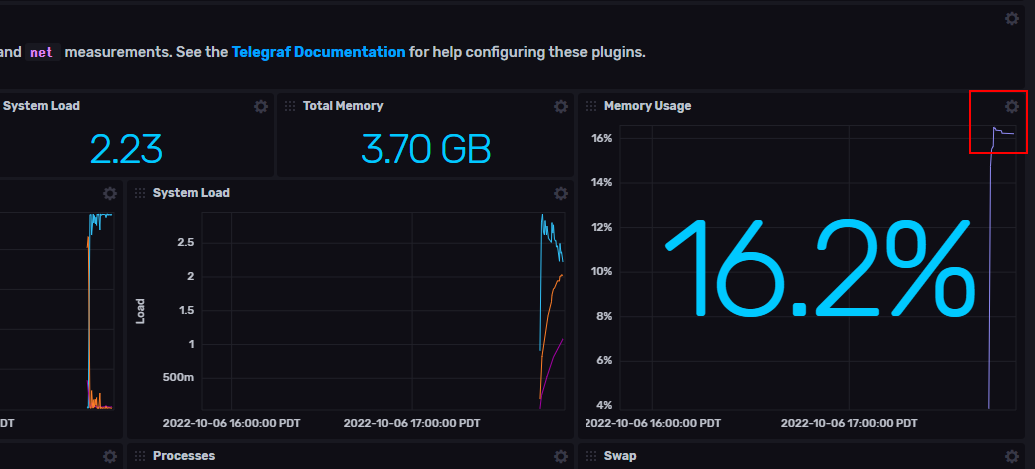
お!データ見えましたね。
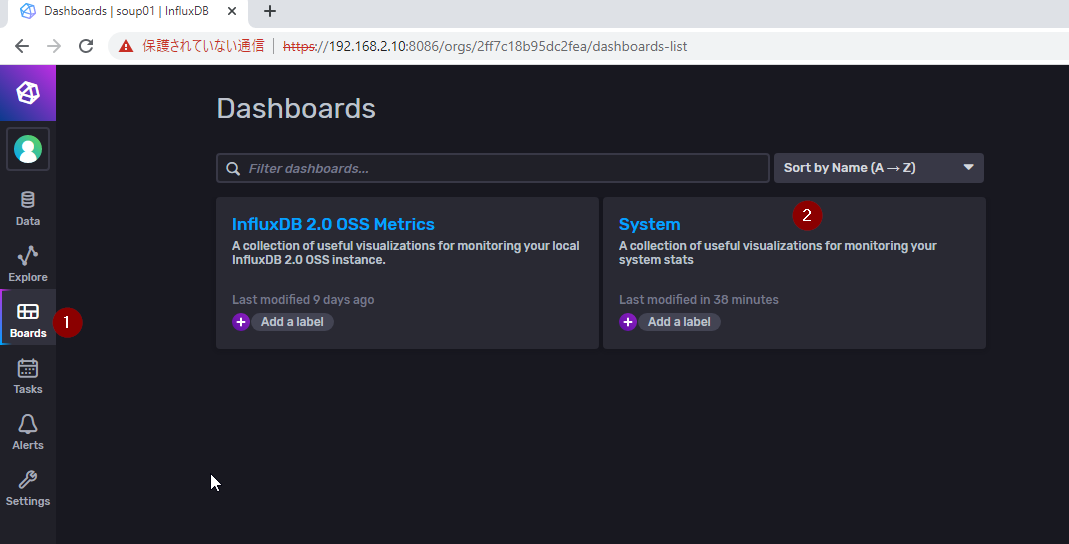
Configure your dashboard
最後はボーナスです。Boardsを開き>Systemをクリックします。
そこにSystemのBucketsにあるデータを一覧できます。
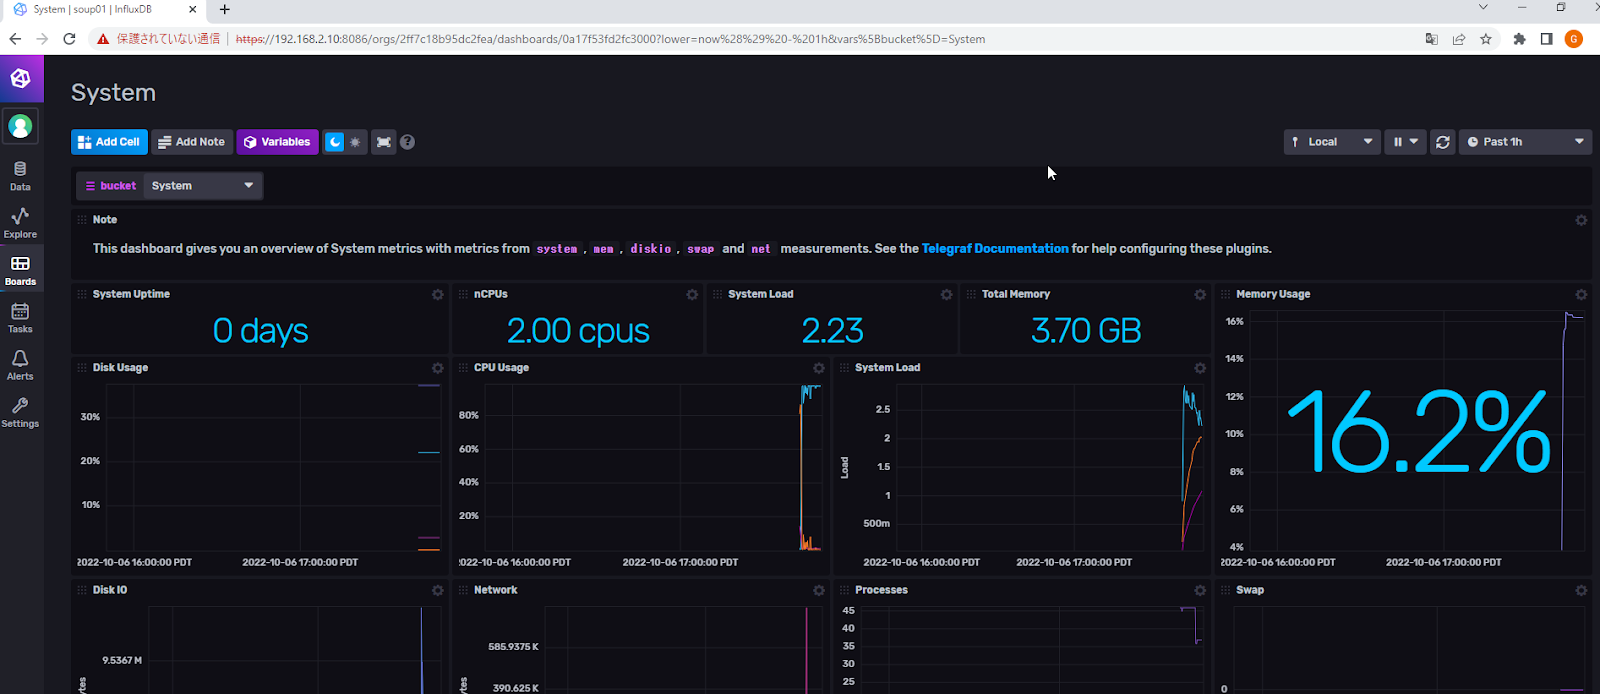
各Fieldにも小さなな歯車ついています。クリックしてみてください。
Configure をクリックします。

そこにFlux Scriptを変更すれば、自分だけの表示・Dashboardになります。
