This is the second episode of InfluxDB. In the previous episode, I explained the basic concept of InfluxDB, including building Docker and Influxdb, and actually checking the operation of Influx and Node-Red built into Phoenix Contact’s Edge PC EPC1522. This time I will introduce a Plug In called telegraf.
Let’ started!
Thanks!
The EPC1522 Edge PC used in this article was loaned to us by Phoenix Contact Japan. Thank you very much.
Founded in Germany in 1923, Phoenix Contact is a global company with 20,300 employees at 55 locations worldwide.
With the concept “All Electric Society”, the company is committed to providing comprehensive electrification, networking and automation solutions in all industrial sectors. Phoenix Contact products are used in a variety of applications in industrial production facilities, infrastructure, energy and electronics connectivity.
Phoenix Contact Japan was established in Yokohama in December 1987 as the first local subsidiary in Asia, and currently operates from 10 sales offices in Japan.
HP.
https://www.phoenixcontact.com/ja-jp/

Reference Link
Previous Link is here↓.
Docker?
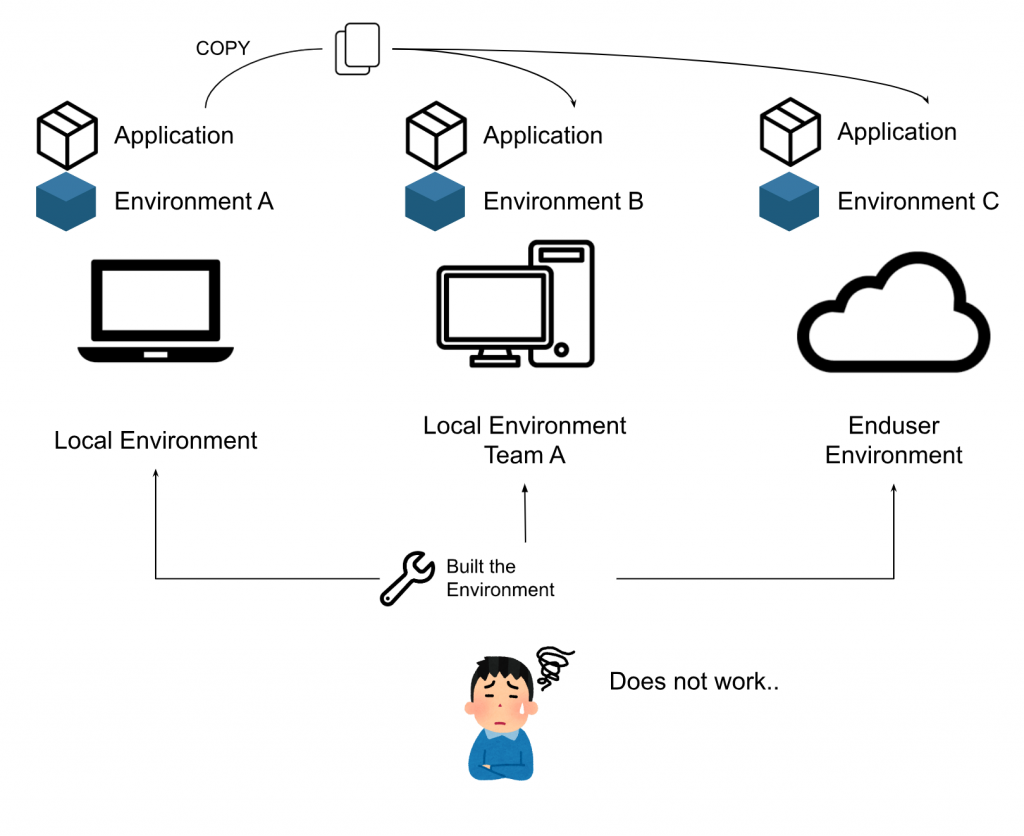
Before introducing Docker, we first discuss the reasons for using it. The application that developers have created in their local development environment so far might not work in the Cloud or in the customer’s environment.
I need to rebuild that environment. We want to be able to get the application up and running quickly and with less variability for customers everywhere.
But as a developer, you have to rebuild the environment > and the application often doesn’t work as it should due to various differences in OS, language environment and version.
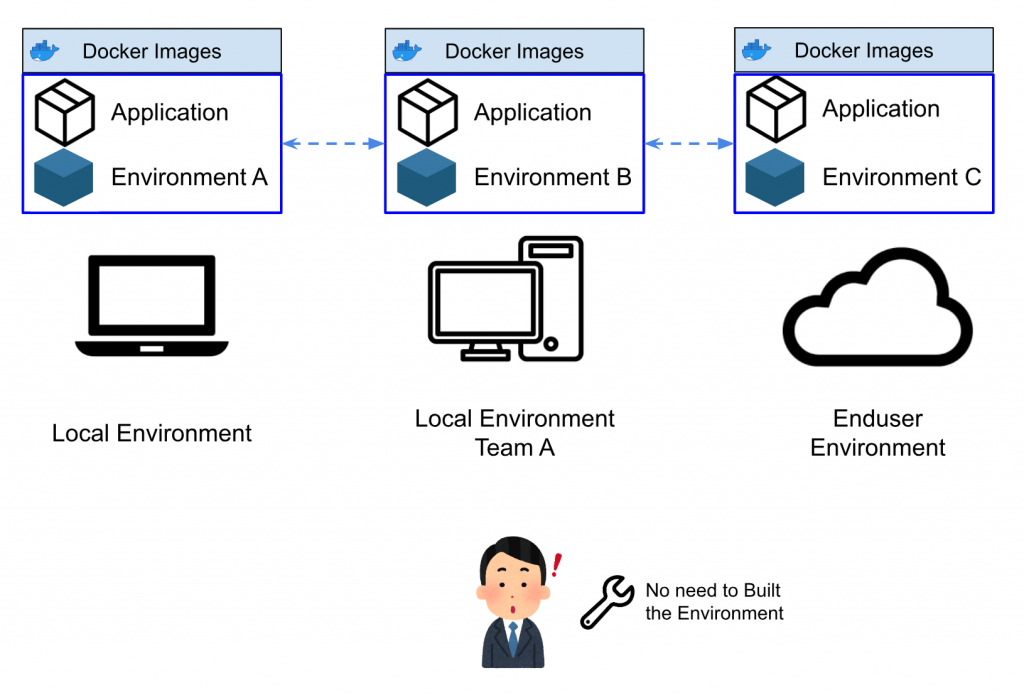
What we have here is Docker, which uses Linux container technology, where the container uses the Host kernel and isolates processes, users, etc., so that they can run as if they were running on a separate machine. It is lightweight and fast to start, stop, etc.
Furthermore, if a developer creates a Docker image and passes it on to another developer,
- Preventing the Version shift of the development environment for each individual
- Shorten the time required to set up the development environment
Often, when building a development environment, it can take more than a day just for mistakes such as lack of documentation or building in the wrong order.
If you want to run Influxdb with Docker, refer to the previous article.
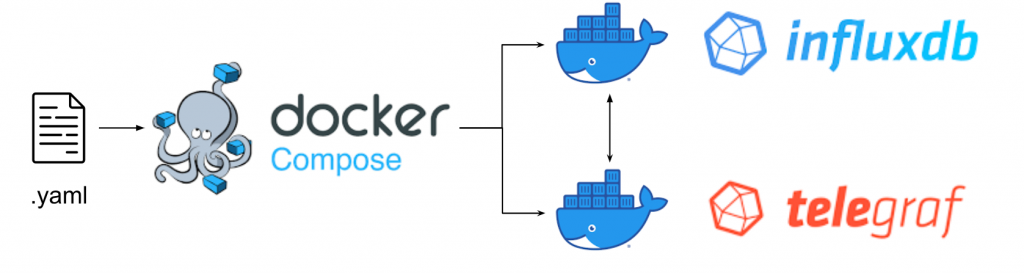
Docker compose?
Docker Compose is a tool that allows you to define and run multiple container applications. docker-compose allows you to easily launch multiple containers simultaneously using a configuration description file (.yaml).

Docker?Docker compose?
Docker is an Engine that runs containers, the command to operate it is docker command and you can only operate docker once and only once.
Docker compose is a tool for defining and running containers and applications, and the command to operate is docker compose, which can operate multiple containers simultaneously. Furthermore, docker compose can not only launch and operate multiple containers at the same time, but also define a “Network” for internal communication between containers and a “Volume” for shared data. For this, a .yaml description File is required.
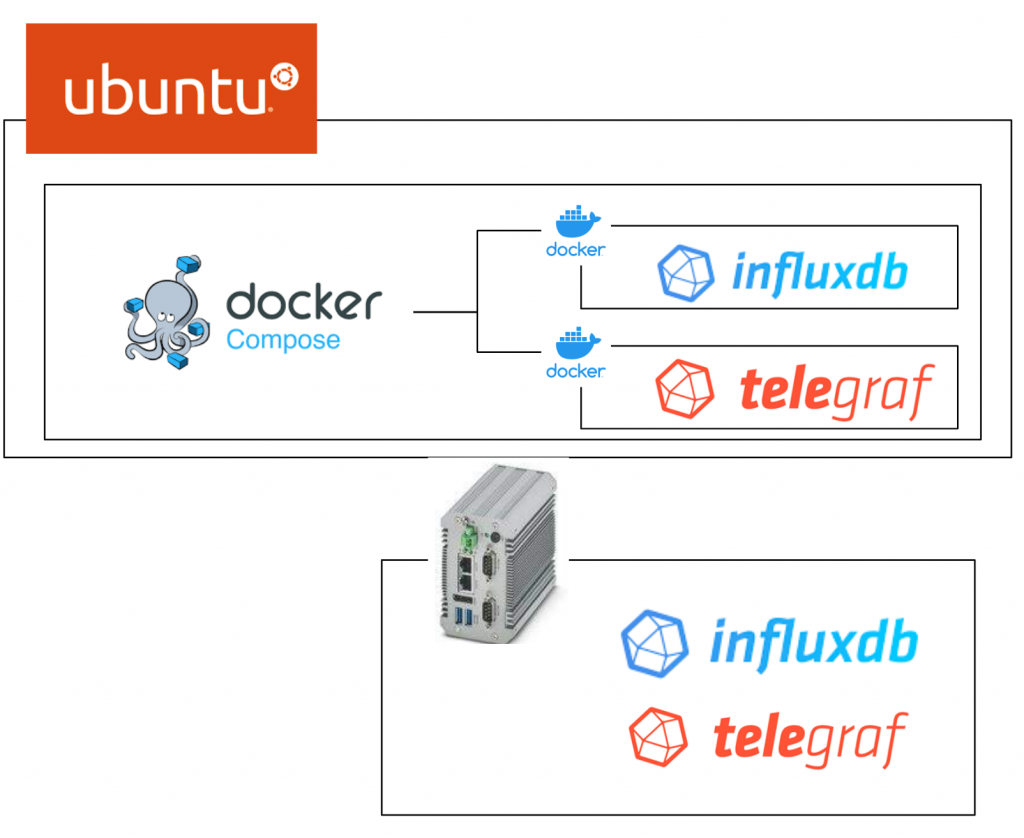
For example, in this article, influxdb and telegraf are launched simultaneously, and since telegraf is a Plug-in for Influxdb, communication is required between influxdb and telegraf, and the Docker compose tool can be used.
Installation
https://docs.docker.com/compose/install/linux/#install-using-the-repository
| sudo apt-get update sudo apt-get install docker-compose-plugin sudo docker compose version |
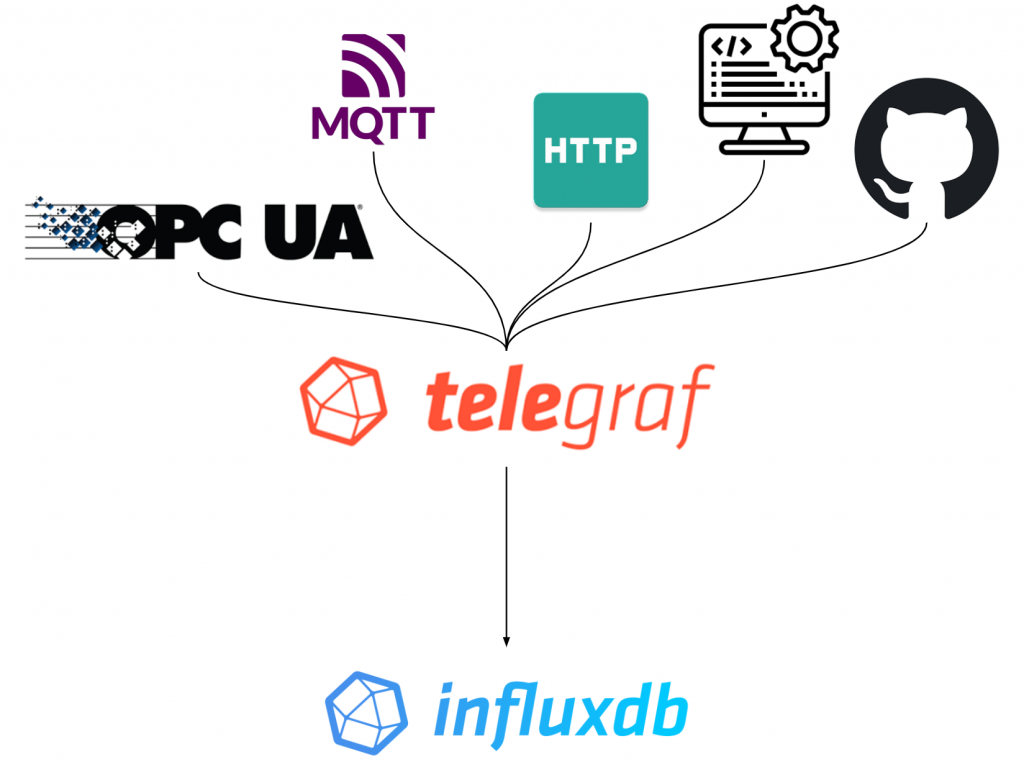
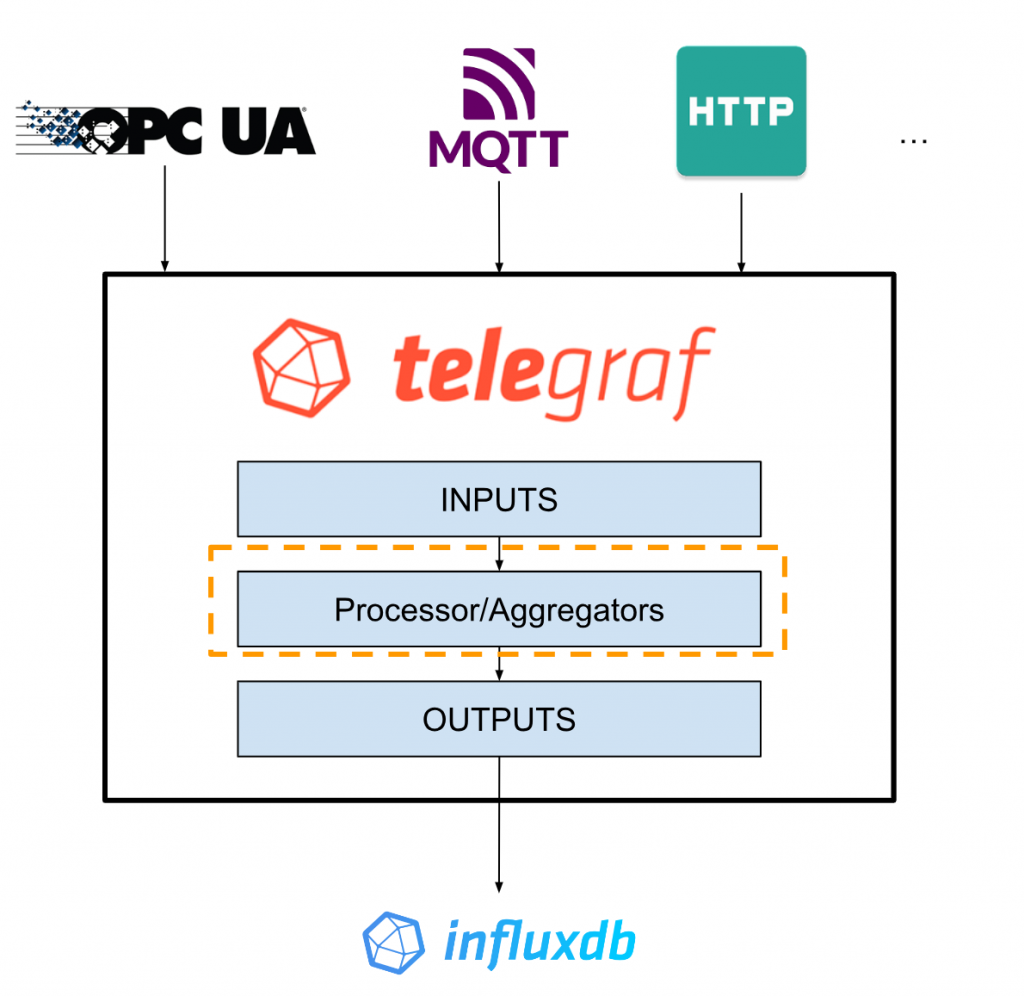
telegraf?
telegraf is an Open source server agent that makes it easy to collect data from other systems, sensors and Stacks. telegraf is implemented in the GO language, allowing data to be compiled into Single Binary and used for small devices. The data is compiled into Single Binary and can be used for small devices.
There are more than 200 Input Plugins, e.g. OPCUA/MQTT/HTTP Listener/System State/GITHUB, Telegraf implements communication drivers etc. with No Code/Low Code, Full stream Support also has advantages.
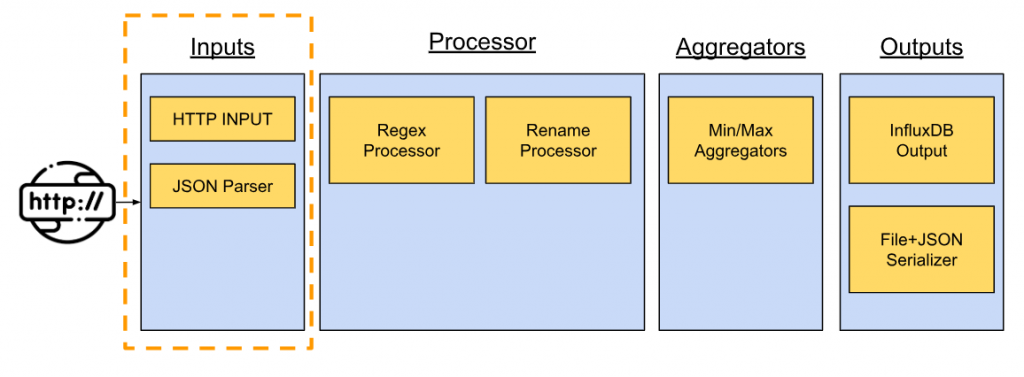
Structure
This is a simple structural diagram of telegraf.
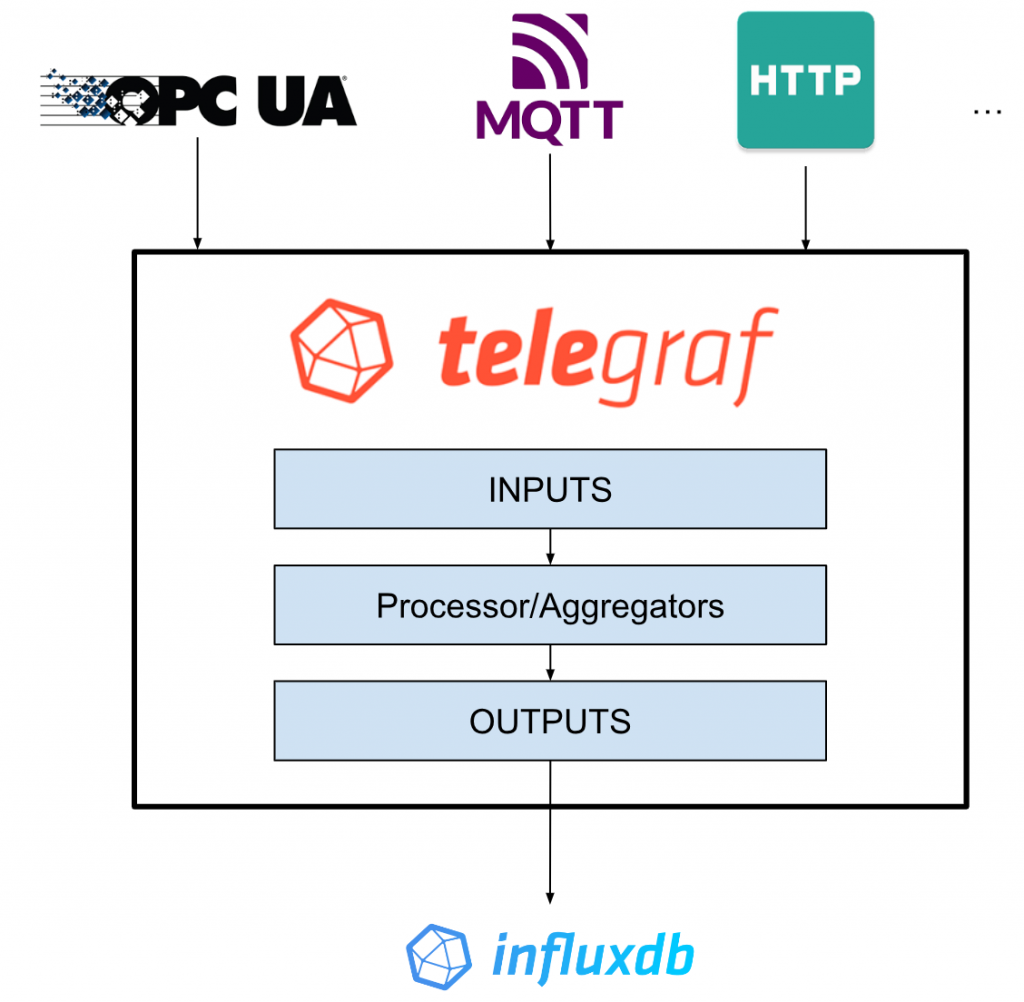
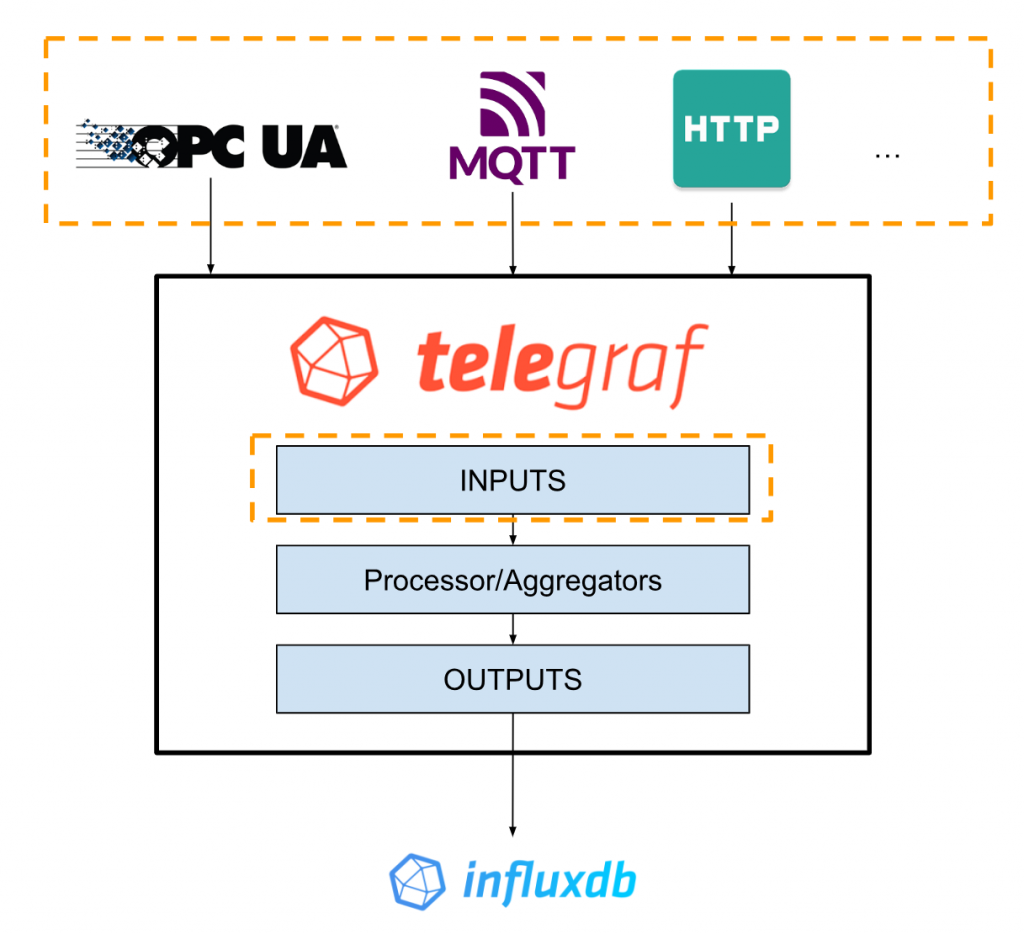
Data Resources
First you choose what kind of data you want to import into Influxdb. telegraf has more than 200 Plug-ins and supports OPCUA, MQTT as well as common protocols such as HTTP. If you still don’t find it, you can also create your own Plug-ins as telegraf is Open source.
For Input Plugs, you need to create and build your own Telegraf Configuration File.
Note that each Plug-ins also has its own Configuration.
The Format of the Input can be JSON/CSV/XML etc.
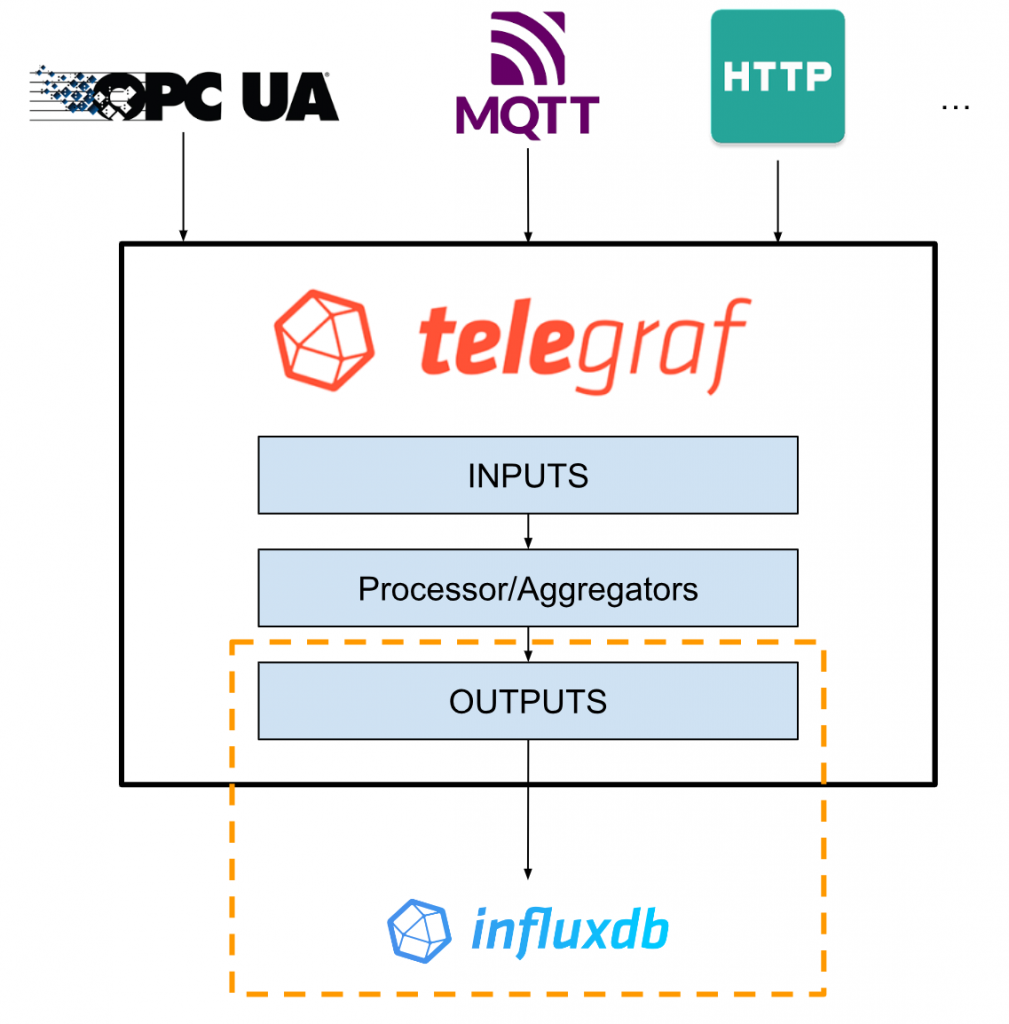
Processor/Aggregators
There may be cases where the data taken from the INPUT is to be processed in some way. For example, Matrix calculation or filtering. In such cases, you can use the Processor Plug-ins.
Processor Plug-ins convert and filter the raw data (raw data) received from Input plugs-ins and output it to Output-plugs-in.
Aggregators Plug-ins convert the raw data (raw data) received from Input plugs-ins and Processors into new aggregate data (e.g. Matrix calculation) and output it to Output-plugs-in.
Outputs
Finally, Output-plugs-in converts the data from Line Protocol to each type of data and outputs it to Influxdb. The data can then be used in Visualisation, Alert, Task, etc. Of course, similar to Input plugsin, it also supports building multiple outputs and multiple data formats.
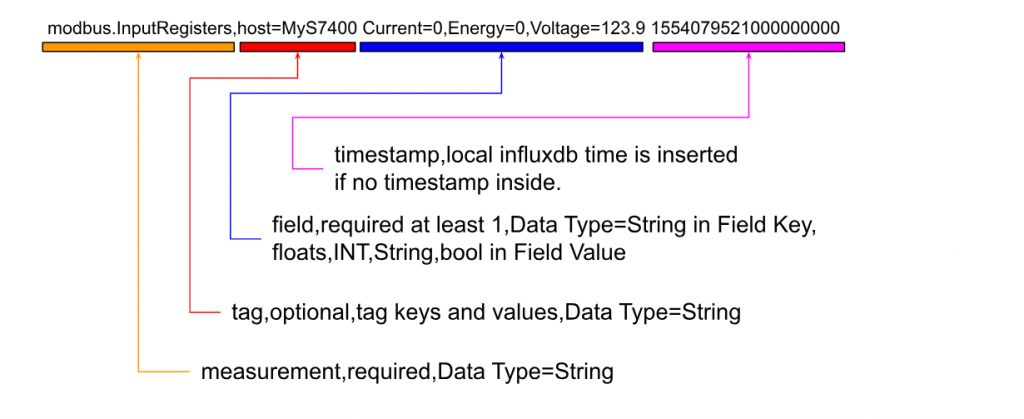
InfluxDB Line Protocol?
The InfluxDB Line Protocol is a Protocol in TextBase that is for writing Data Points to the InfluxDB database. There are several components to its InfluxDB Line Protocol.
Here is the InfluxDB Line Protocol Example from the telegraf Modubus Plugin.
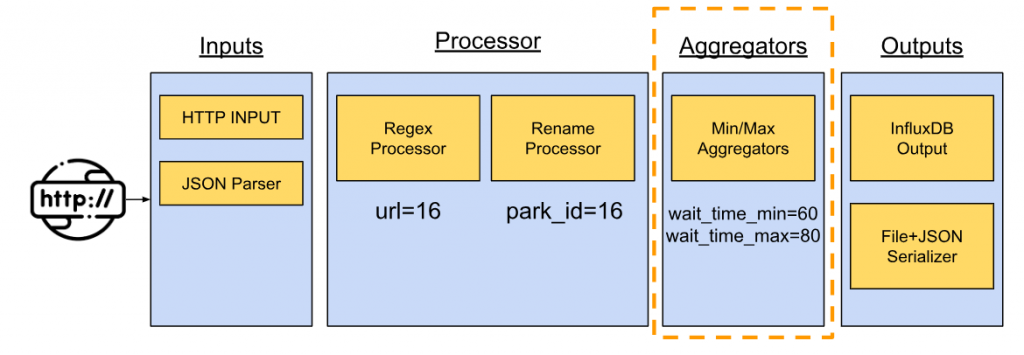
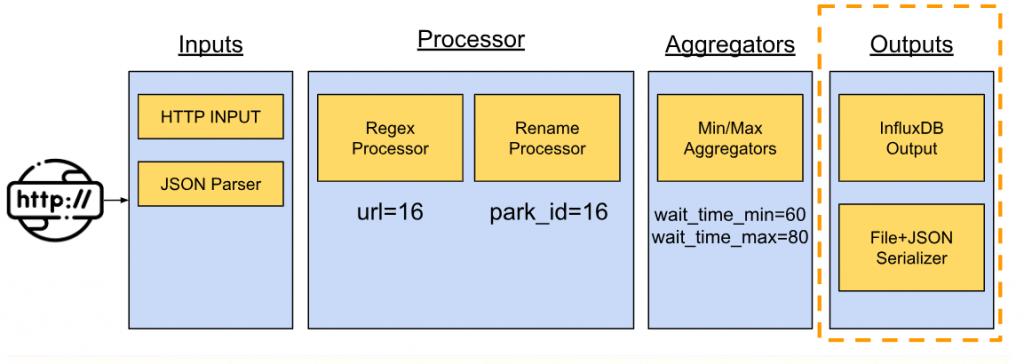
Work Flow Example
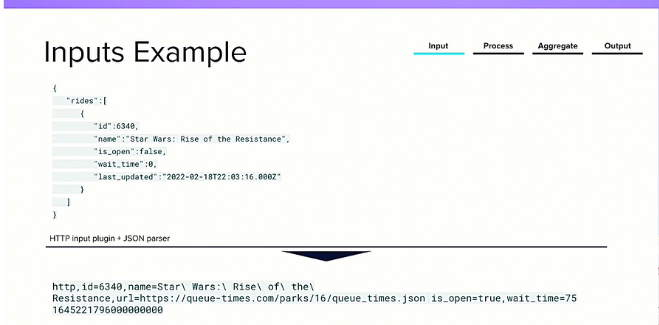
This is an example of how telegraf can be used: a Flow that takes JSON data from a Public Web Site and outputs it to File and InfluxDB.
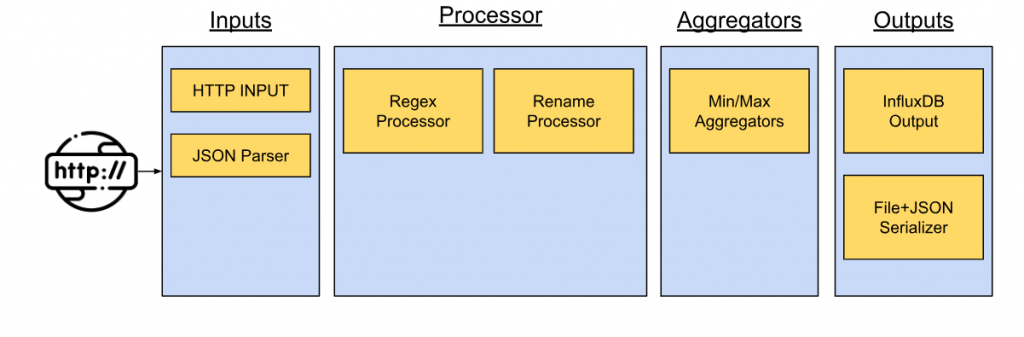
Inputs
Use Http Input plugs to retrieve JSON data from the Web Site and use JSON Parser Input Plug-ins to convert JSON data objects to the InfluxDB Line Protocol.
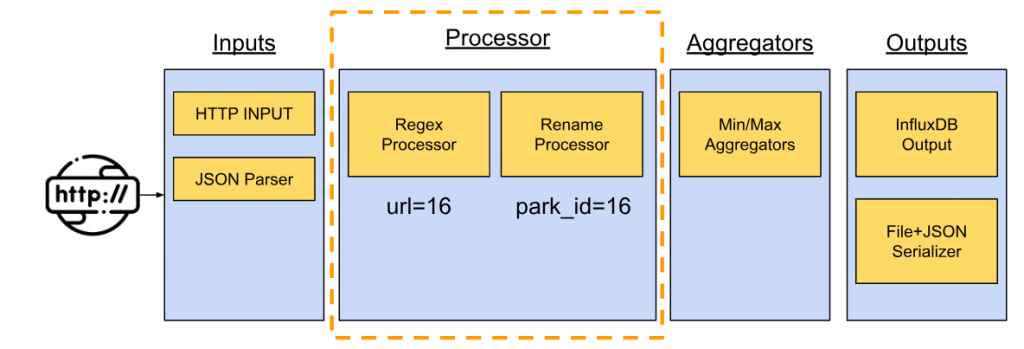
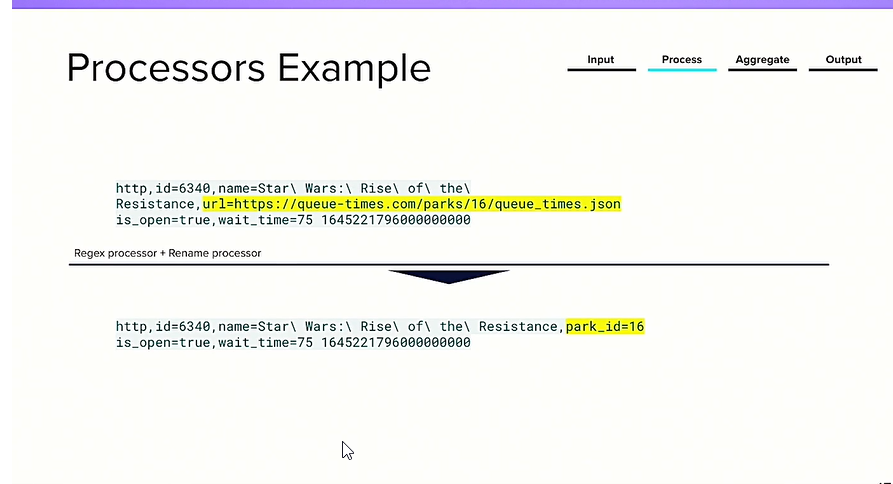
Processor
The next step is to convert the Url part to park_id=16 using the Processor Plug-ins.
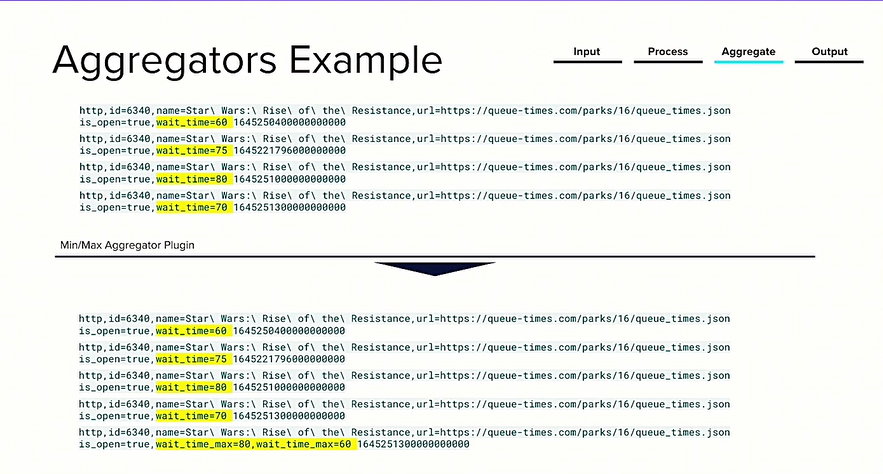
Aggregators
Further data processing.
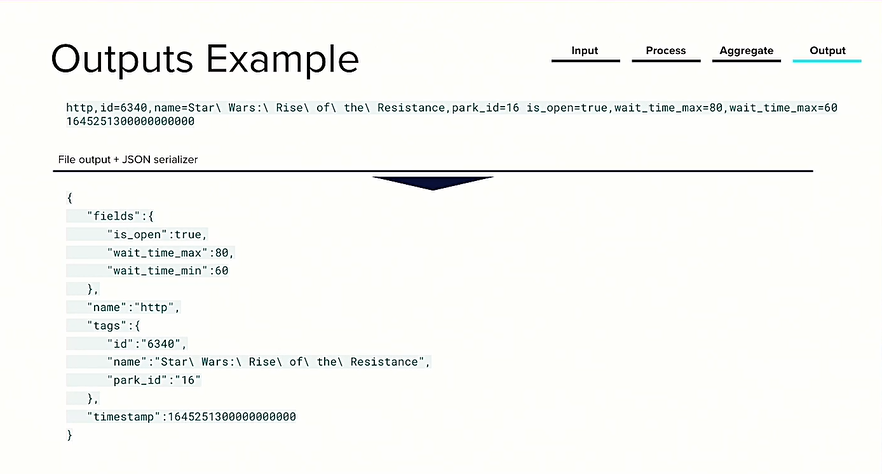
Outputs
The last step is to outputs the Outputs data to InfluxDB Output Plugins to InfluxDB and save the rest of the data to a File in JSON Format.
Play with Docker First!
We want to start with Docker; Let’s install the docker compose tool.
Directory Structure
Here is the Directory configuration. ssl/telegraf/data is automatically created when Docker compose, so don’t worry about it.
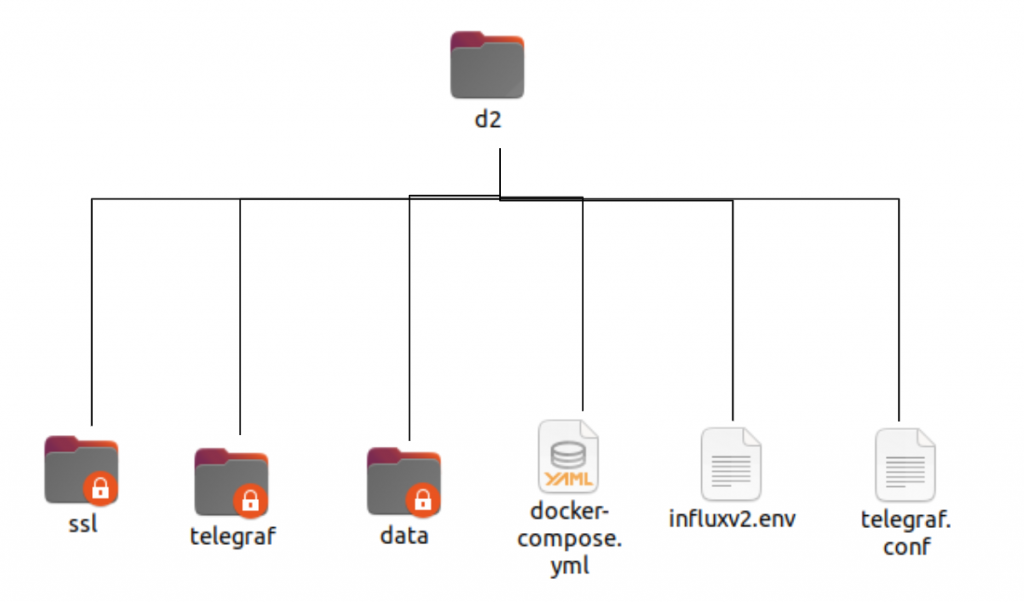
Create the docker compose Directory
Create Folder: docker-compose.yml, influx2.env, telegraf.conf textFile.
docker-compose.yml
Paste this Configuration.
| version: ‘3’ services: influxdb: image: influxdb:latest volumes: # Mount for influxdb data directory and configuration – ./data/influxdb2:/var/lib/influxdb2 – ./data/influxdb2-config:/etc/influxdb2 ports: – “8086:8086” telegraf: image: telegraf links: – influxdb volumes: – ./telegraf.conf:/etc/telegraf/telegraf.conf:ro – /var/run/docker.sock:/var/run/docker.sock:ro – /sys:/rootfs/sys:ro – /proc:/rootfs/proc:ro – /etc:/rootfs/etc:ro env_file: – ./influxv2.env environment: – DOCKER_INFLUXDB_INIT_ORG=myorg – DOCKER_INFLUXDB_INIT_BUCKET=mybucket – DOCKER_INFLUXDB_INIT_ADMIN_TOKEN=mytoken depends_on: – influxdb volumes: influxdb2: |
telegraf.conf
Paste this Configuration.
| [global_tags] [agent] interval = “60s” round_interval = true metric_batch_size = 1000 metric_buffer_limit = 10000 collection_jitter = “0s” flush_interval = “10s” flush_jitter = “0s” precision = “” hostname = “” omit_hostname = false [[outputs.influxdb_v2]] urls = [“http://influxdb:8086”] token = “my-super-secret-auth-token” organization = “my-org” bucket = “my-bucket” timeout = “5s” [[inputs.ping]] interval = “5s” urls = [“google.com”, “amazon.com”, “github.com”] count = 4 ping_interval = 1.0 timeout = 2.0 [[inputs.cpu]] percpu = true totalcpu = true collect_cpu_time = false report_active = false [[inputs.disk]] ignore_fs = [“tmpfs”, “devtmpfs”, “devfs”, “iso9660”, “overlay”, “aufs”, “squashfs”] [[inputs.diskio]] [[inputs.kernel]] [[inputs.mem]] [[inputs.processes]] [[inputs.swap]] [[inputs.system]] |
influx2.env
File where the environment variable is stored, so it can be left empty.
Run It
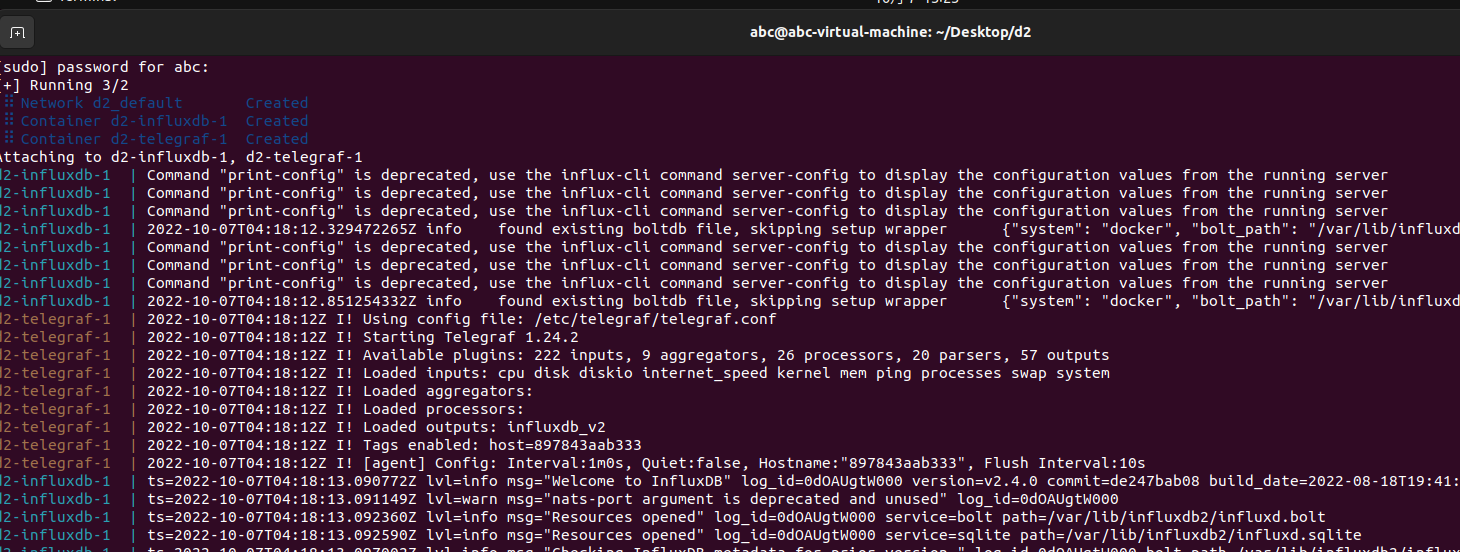
Start docker compose with the following command.
| Sudo docker compose up |
You see the Terminal output. Docker compose is already running.
-d Options to run Background.
| Sudo docker compose up -d |
Check the status
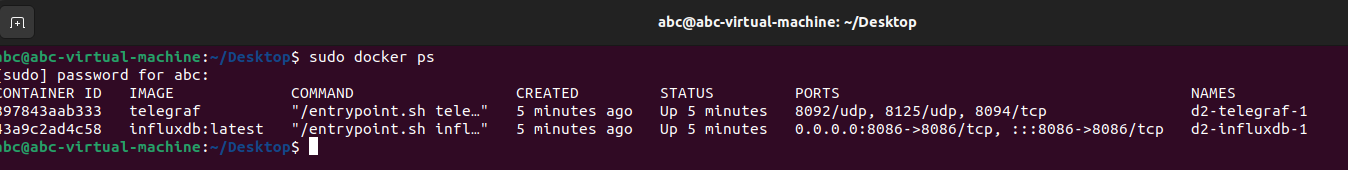
Check the docker status with the following command.
| sudo docker ps |
I see that the two influxdb telegraf Dockers are already up and running!
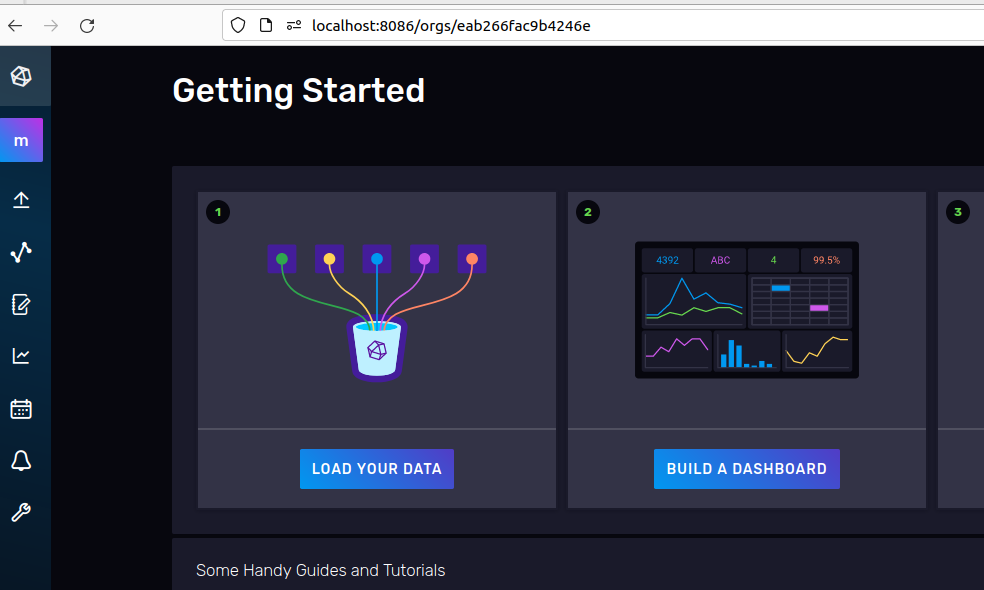
Access the Influxdb
Access influxdb’s Server from localhost:8086.
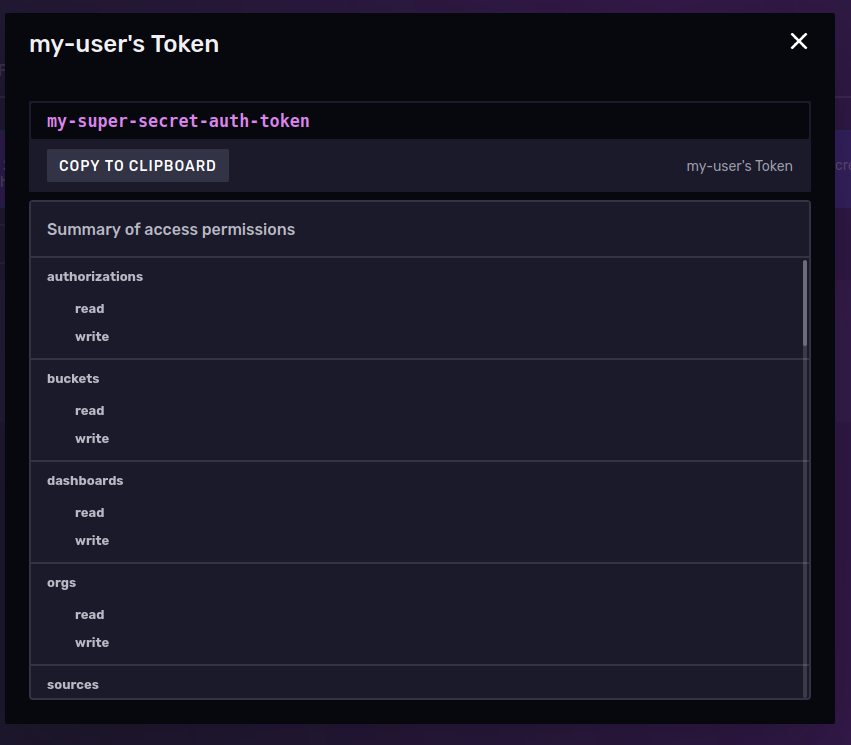
Check the token
First check the API Tokens.
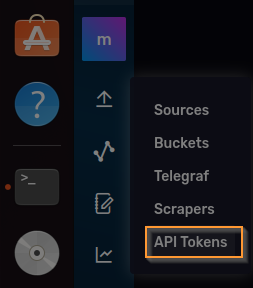
Click on the Token that is now being built.
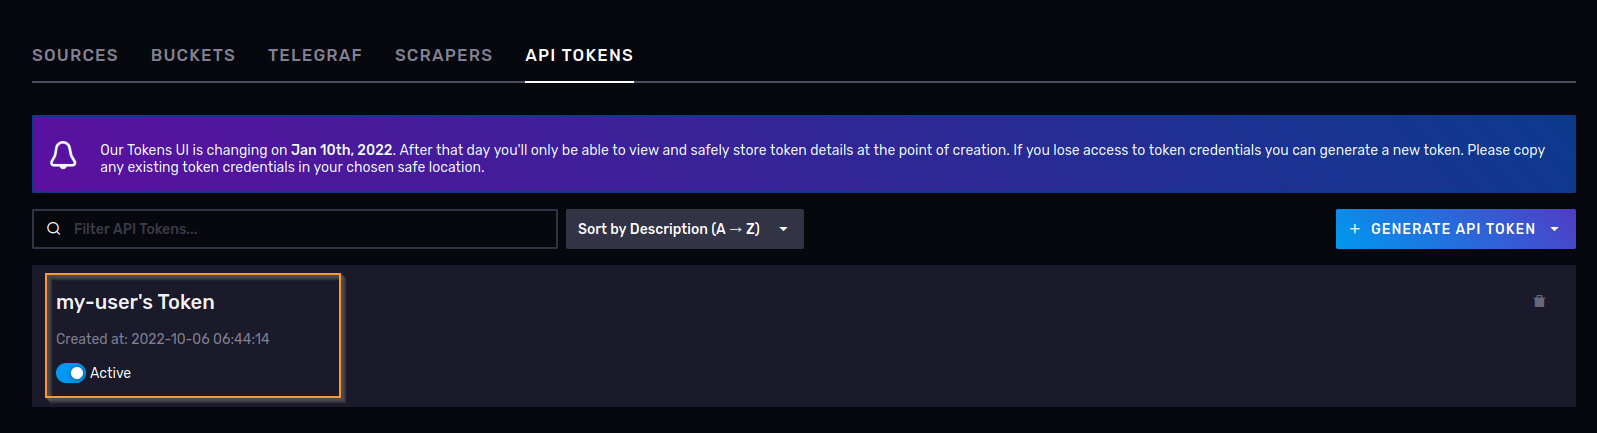
If there are problems with telegraf authentication, recheck the API KEY.
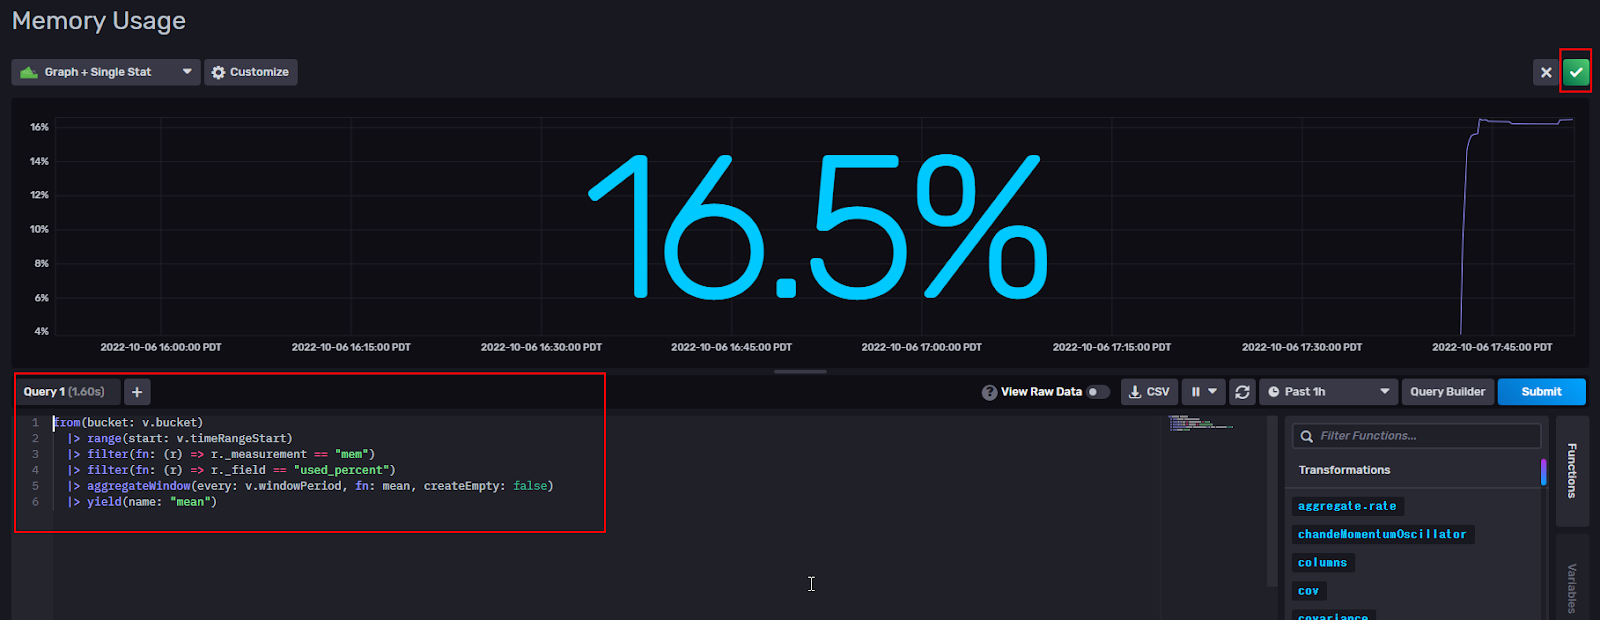
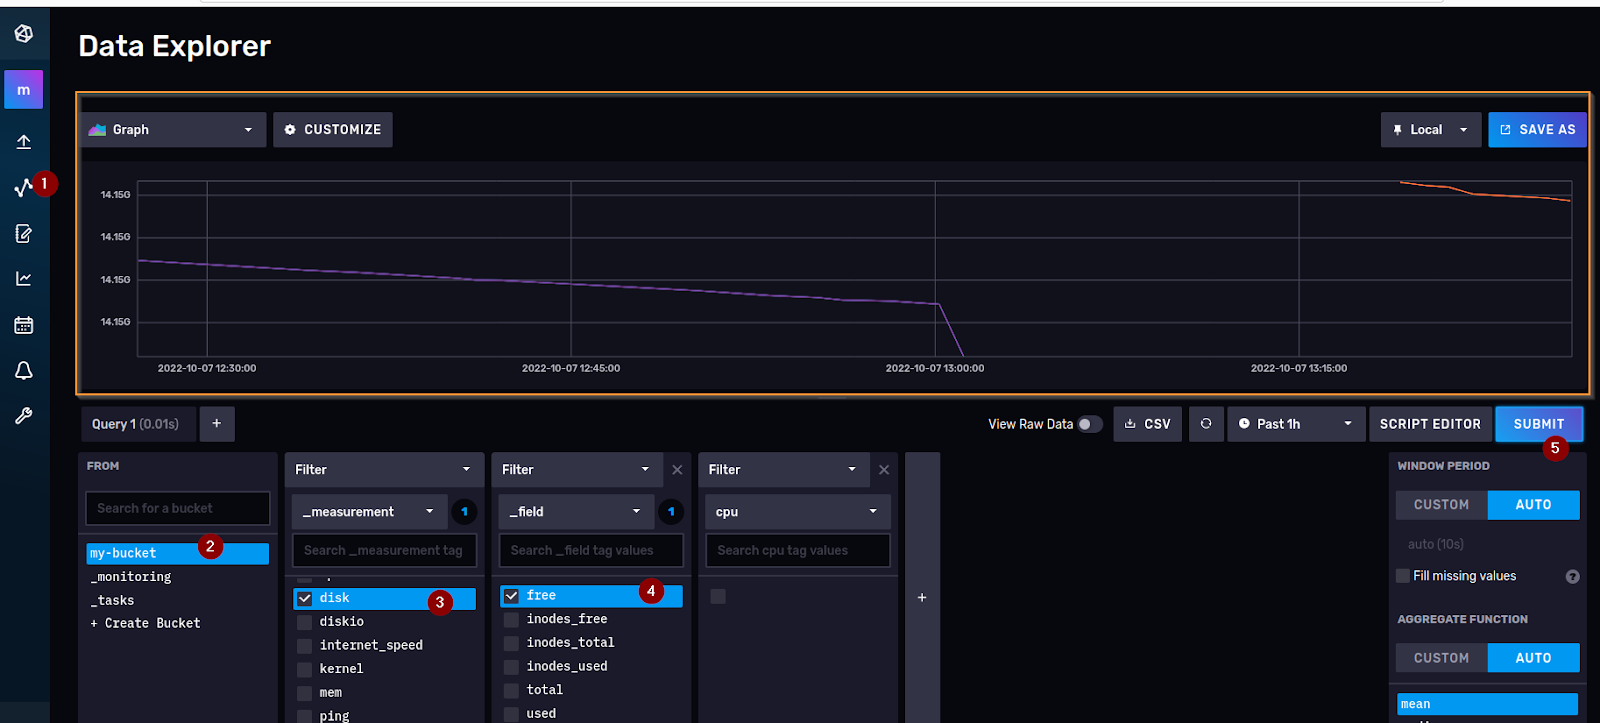
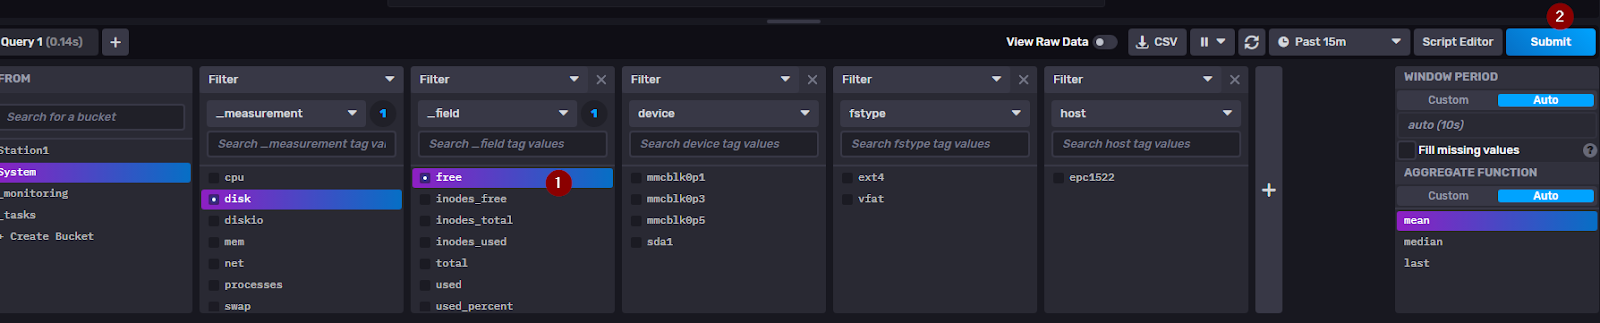
Check the Data
Open Data Explorer, select _field from _measurement and SUBMIT.
If the data are displayed, you are already in the right place and telegraf is getting the data and outputting them to influxdb.
Add Telegraf Configuration
Now that the CPU has been monitored, let’s add another Telegraf Input plug-in.
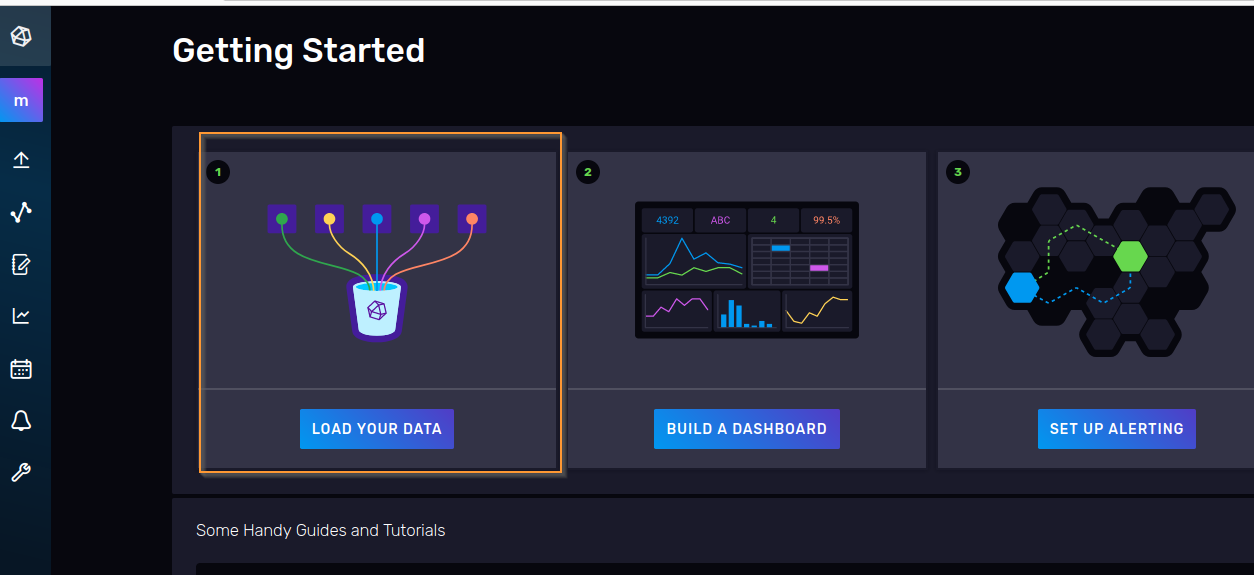
Click on Load YOUR DATA.
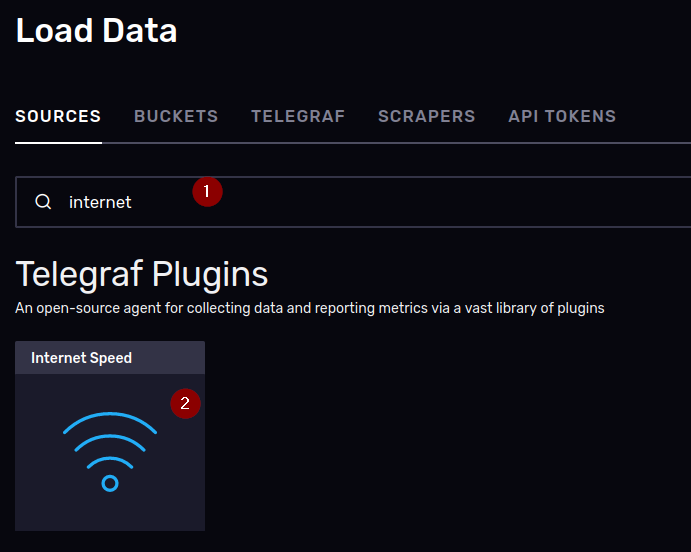
Search for Internet and click > Internet Speed.
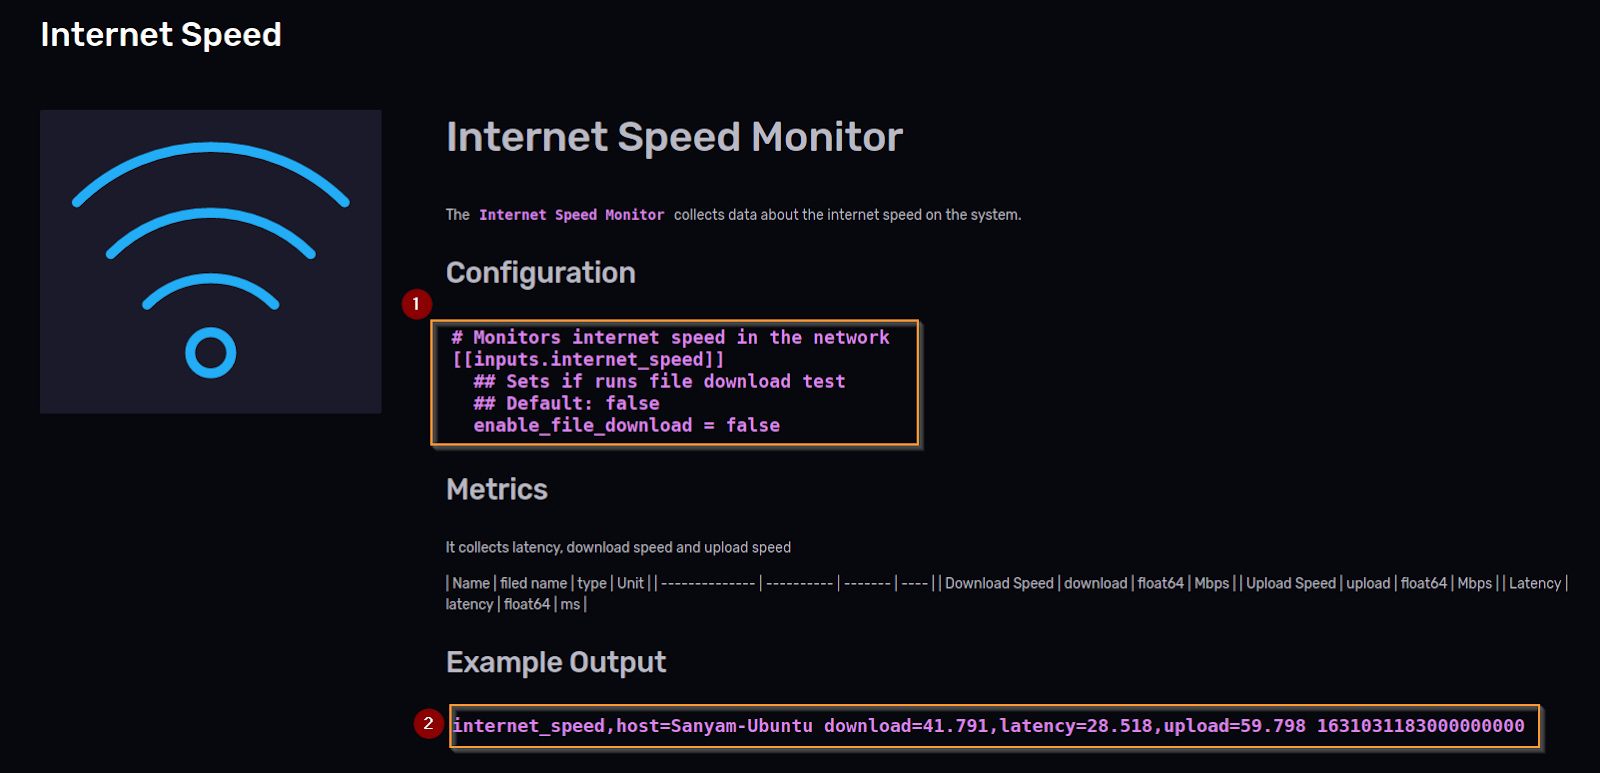
COPY the Configuration as is and paste it into telegraf.conf,
InfluxDB Line Protocol as shown in Example Output will be output to InfluxDB.
Edit the telegraf.conf
Copy and paste the Configuration of the Internet speed input plug-in at the end of the previous telegraf.conf.
| [global_tags] [agent] interval = “60s” round_interval = true metric_batch_size = 1000 metric_buffer_limit = 10000 collection_jitter = “0s” flush_interval = “10s” flush_jitter = “0s” precision = “” hostname = “” omit_hostname = false [[outputs.influxdb_v2]] urls = [“http://influxdb:8086”] token = “my-super-secret-auth-token” organization = “my-org” bucket = “my-bucket” timeout = “5s” [[inputs.ping]] interval = “5s” urls = [“google.com”, “amazon.com”, “github.com”] count = 4 ping_interval = 1.0 timeout = 2.0 [[inputs.cpu]] percpu = true totalcpu = true collect_cpu_time = false report_active = false [[inputs.disk]] ignore_fs = [“tmpfs”, “devtmpfs”, “devfs”, “iso9660”, “overlay”, “aufs”, “squashfs”] [[inputs.diskio]] [[inputs.kernel]] [[inputs.mem]] [[inputs.processes]] [[inputs.swap]] [[inputs.system]] [[inputs.internet_speed]] ## This plugin downloads many MB of data each time it is run. As such ## consider setting a higher interval for this plugin to reduce the ## demand on your internet connection. interval = “60m” ## Sets if runs file download test enable_file_download = false ## Caches the closest server location # cache = false |
Stop it and Run again!
Stop and restart the following command docker compose once.
| sudo docker compose down |
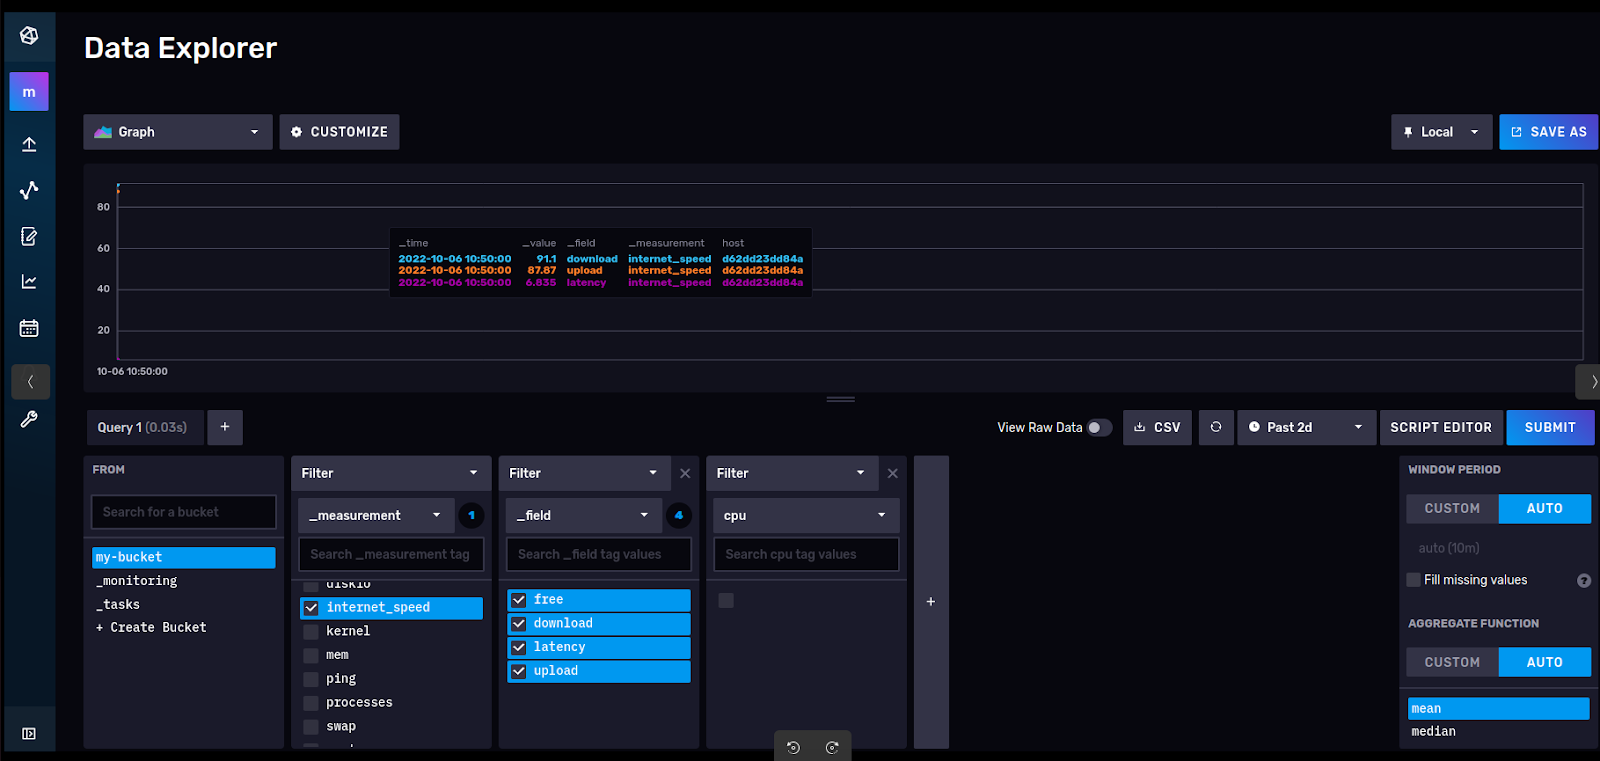
Internet_speed data is now also visible!
Play with EPC1522!
Next, try it from InfluxDB and Telegraf, which are built into Phoenix Contact.
Access the InfluxDB dashboard
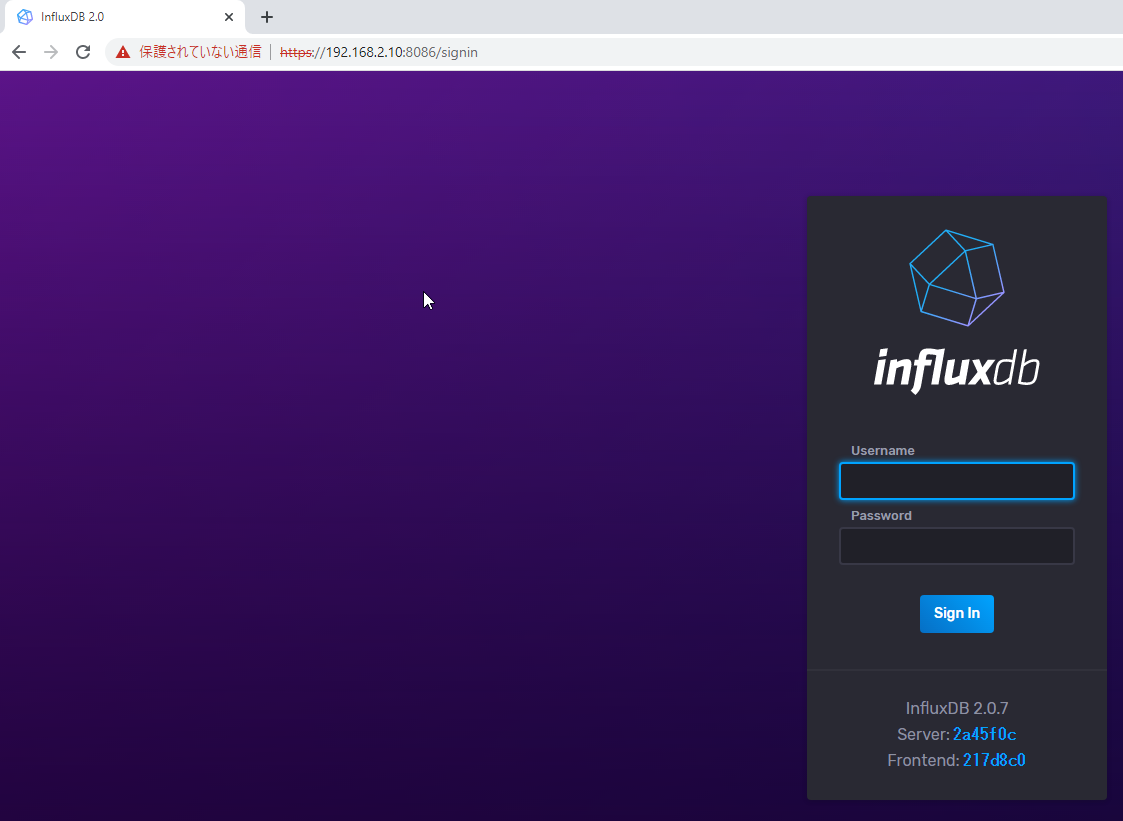
Access https://yourIP:8086 from your web browser.
Enter the Username and Password.
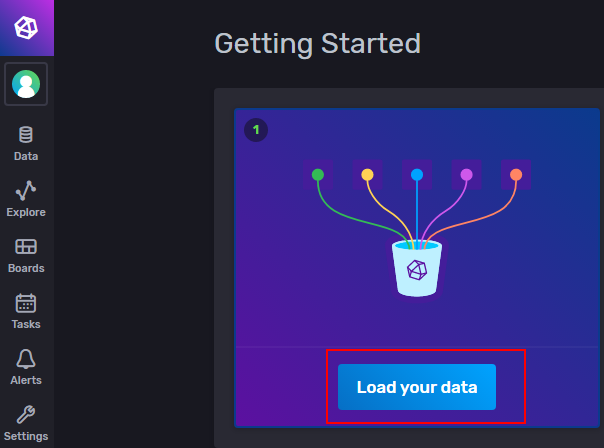
Try to Load the data
First load the Data – click on the Load your data button.
Switched to the Load Data screen.
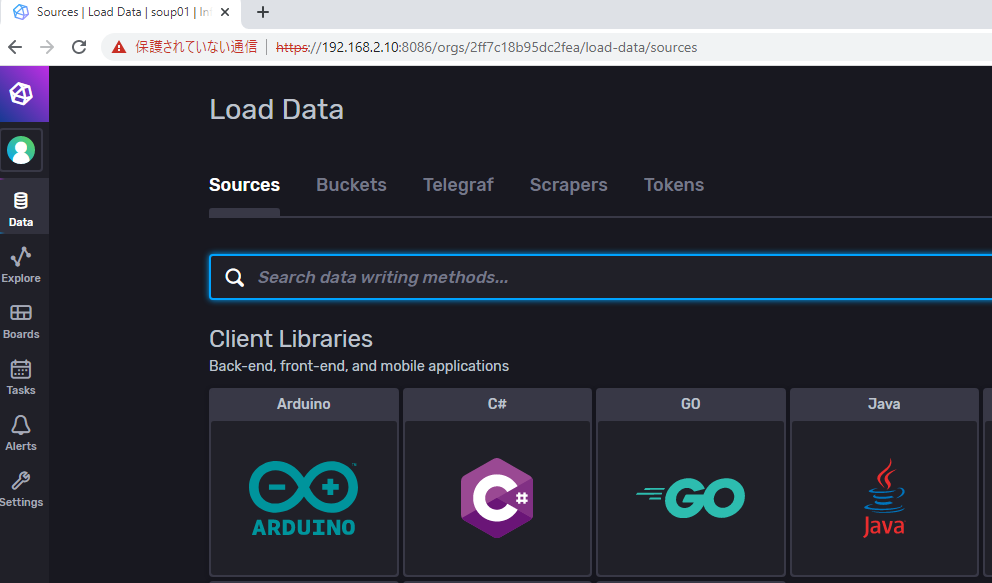
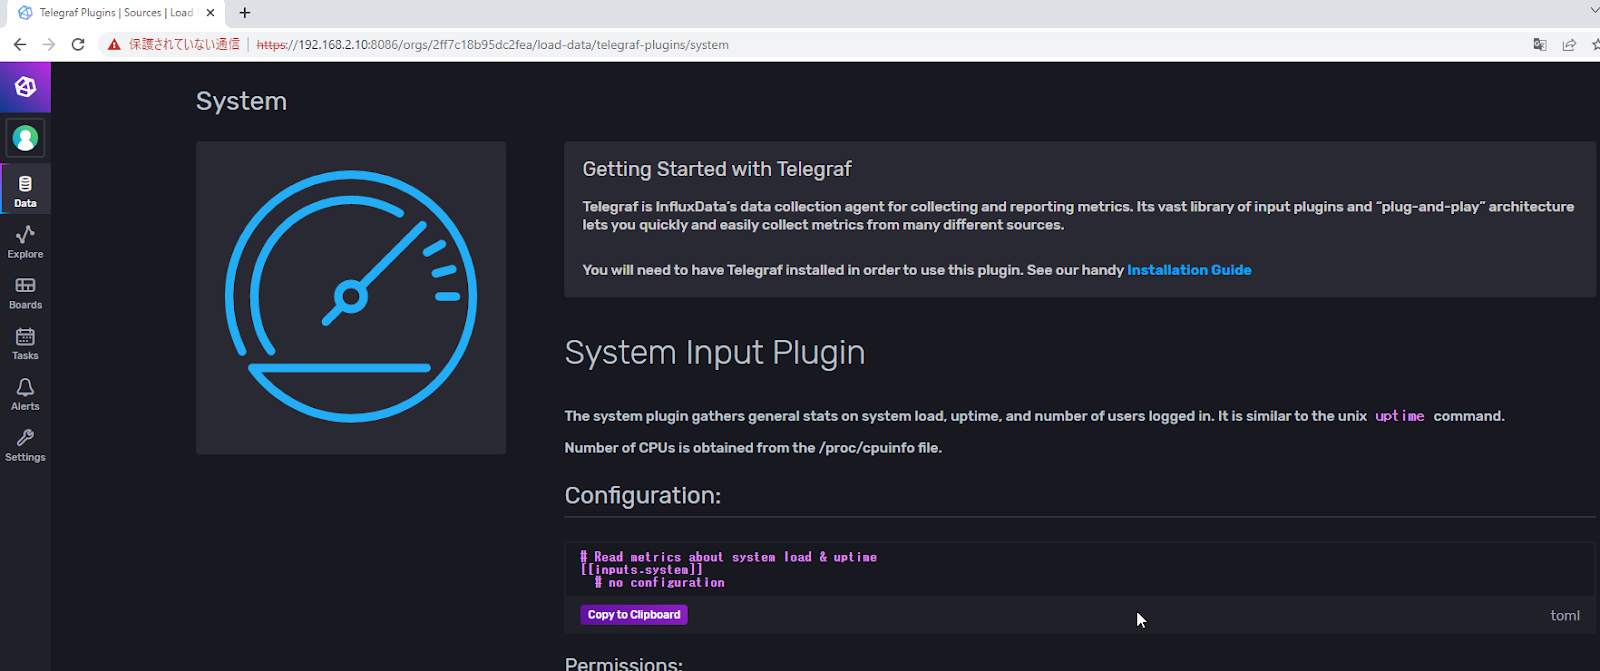
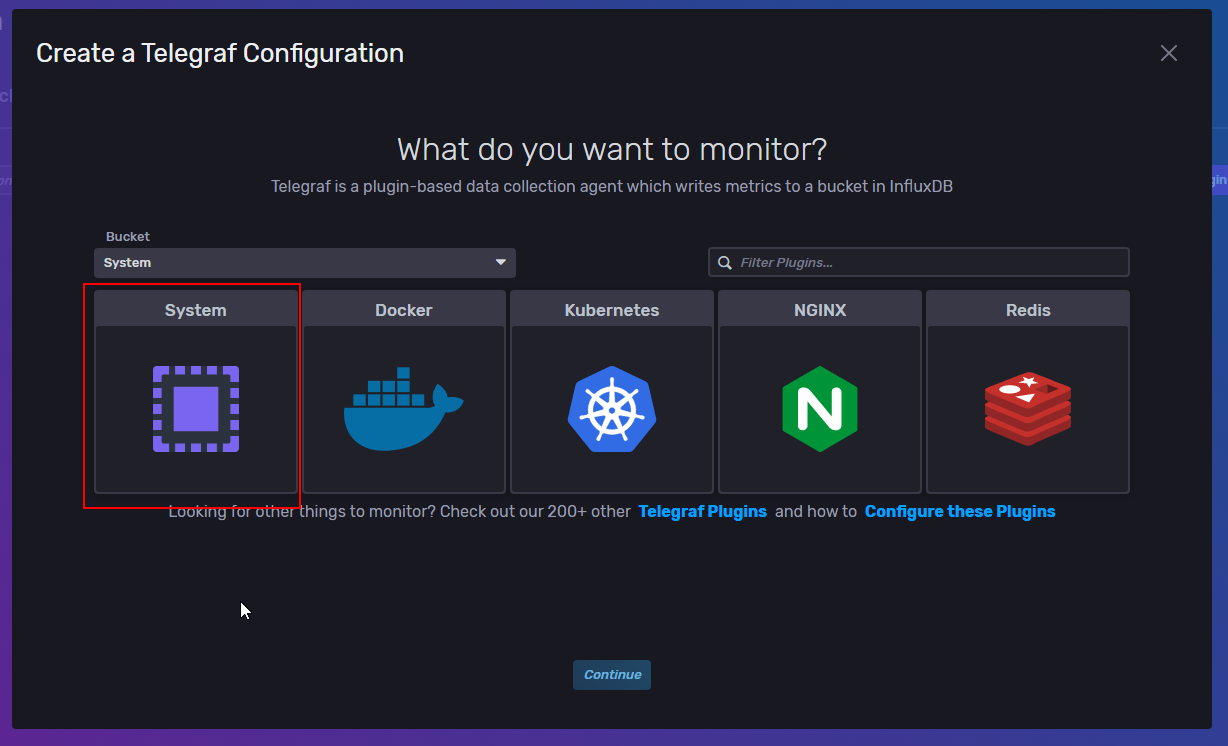
Search for System and click >System.
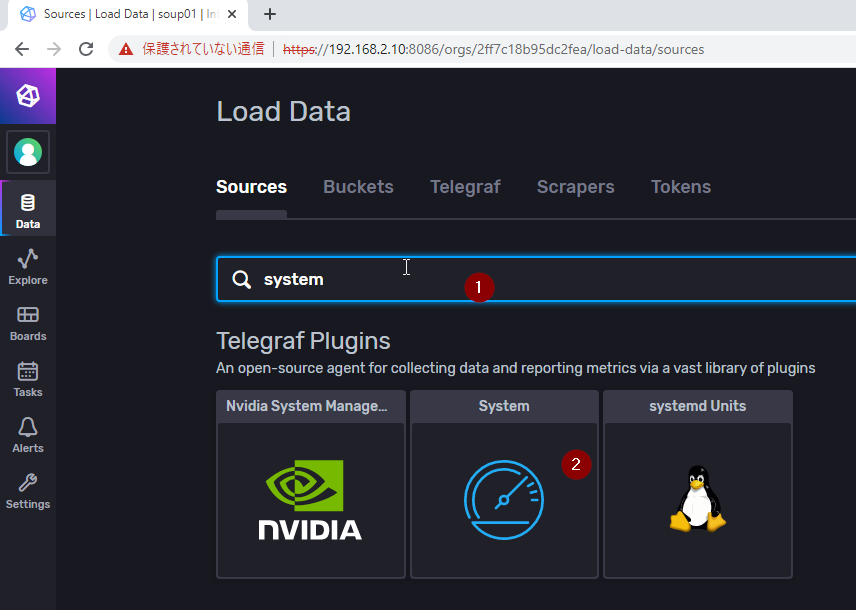
The System input plugin screen is now displayed.
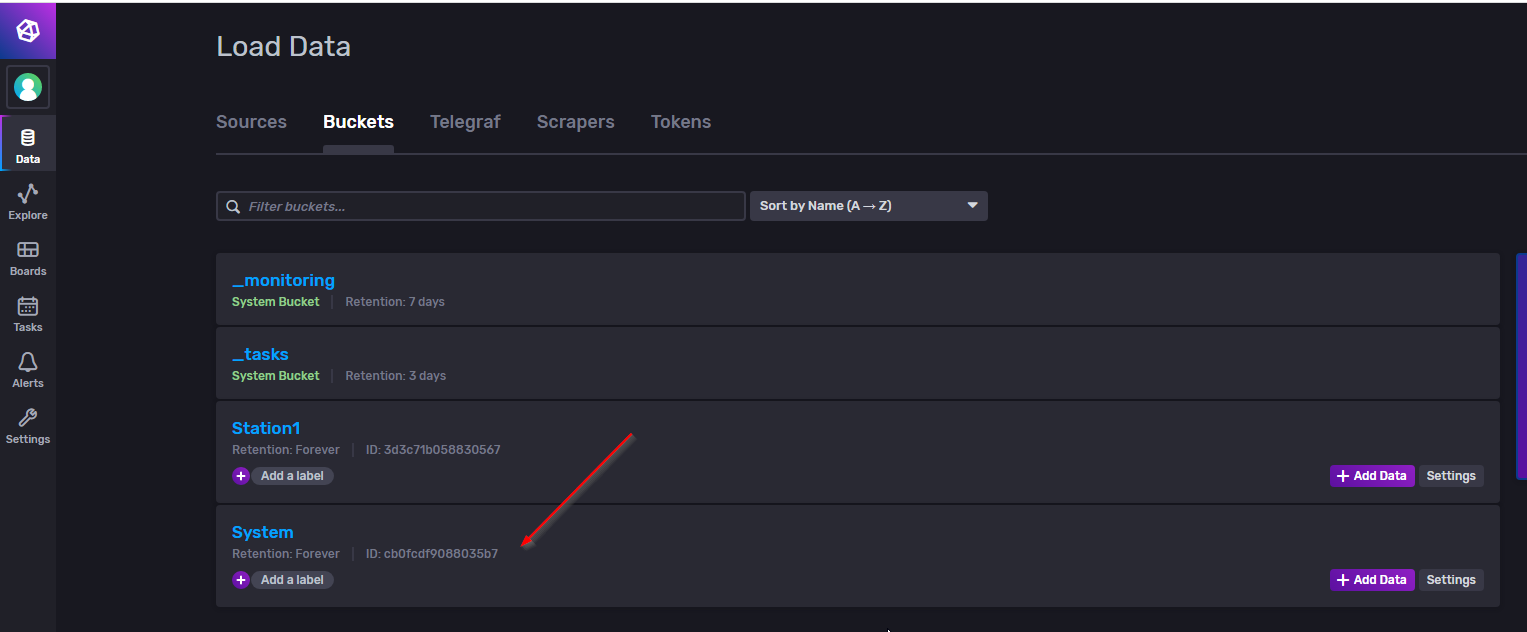
Create Buckets
Create Buckets: open the Buckets Tab > Create Buckets.
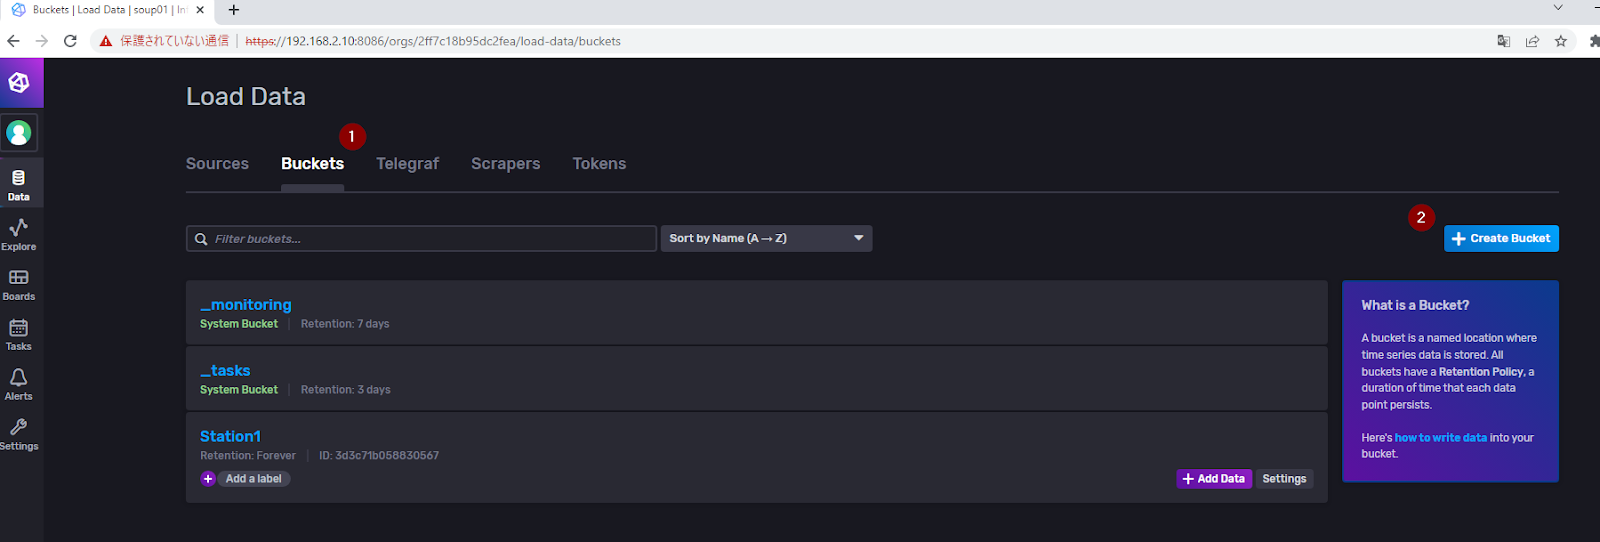
Name the Buckets, Create.
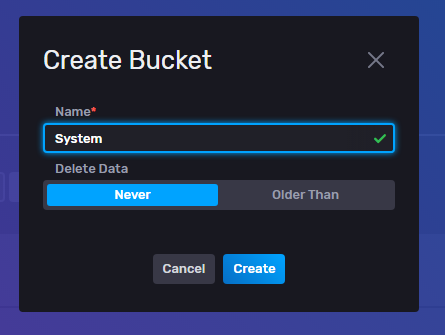
Buckets called System were created.
Create Telegraf Configuration
The next step is to create a Configuration for Telegraf: open the Telegraf tab>Create Configuration.
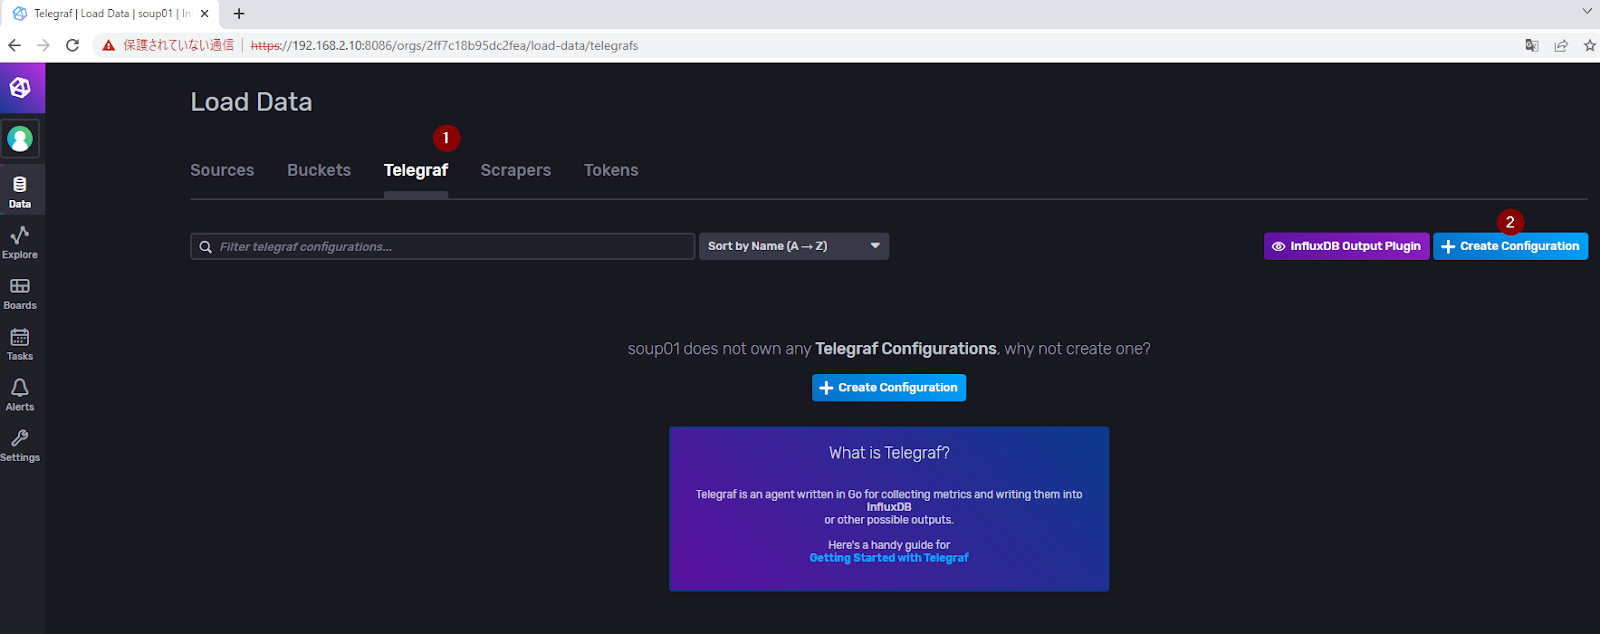
The Telegraf Configuration screen is now displayed.
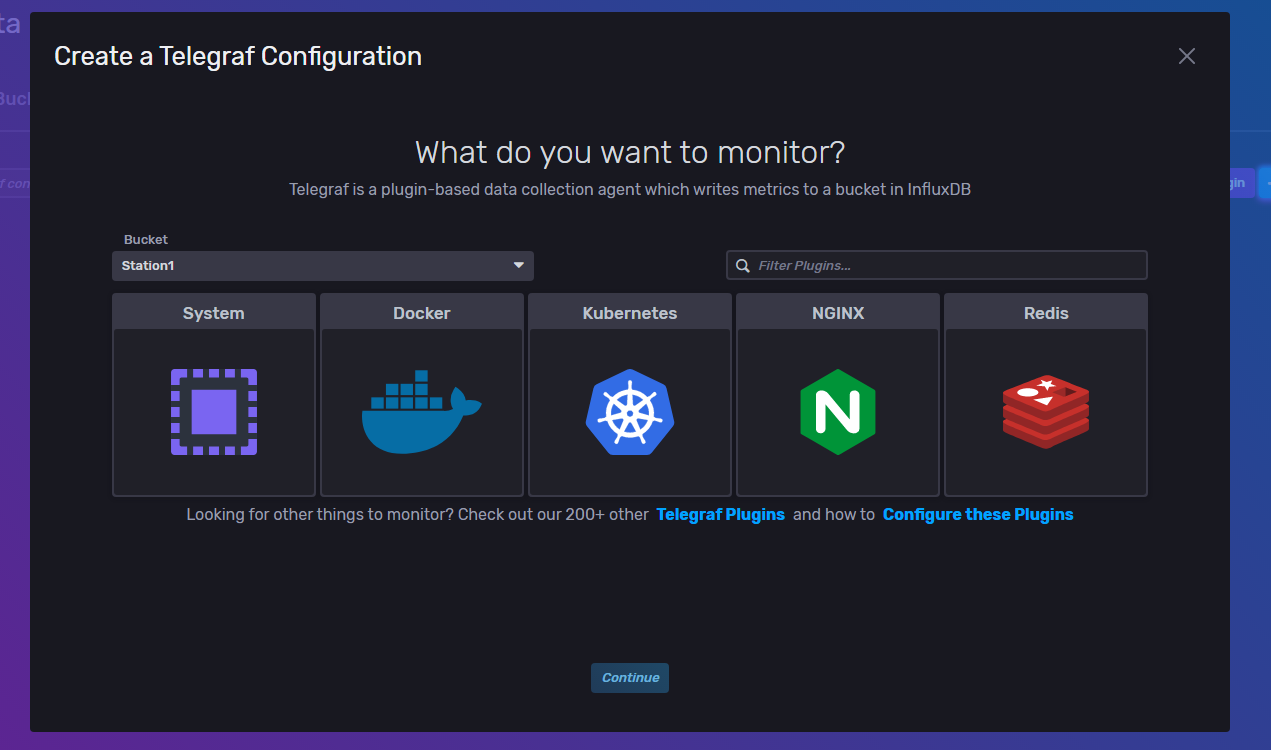
In Buckets, select System.
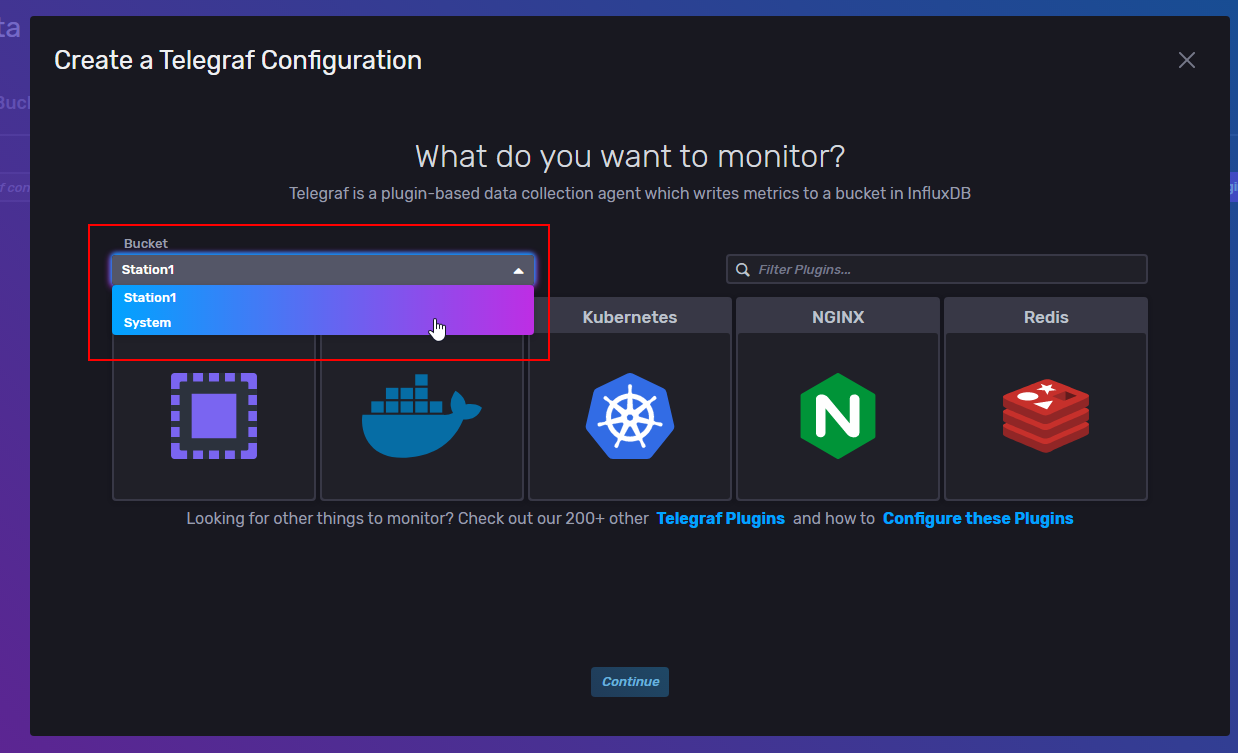
Next, click on System.
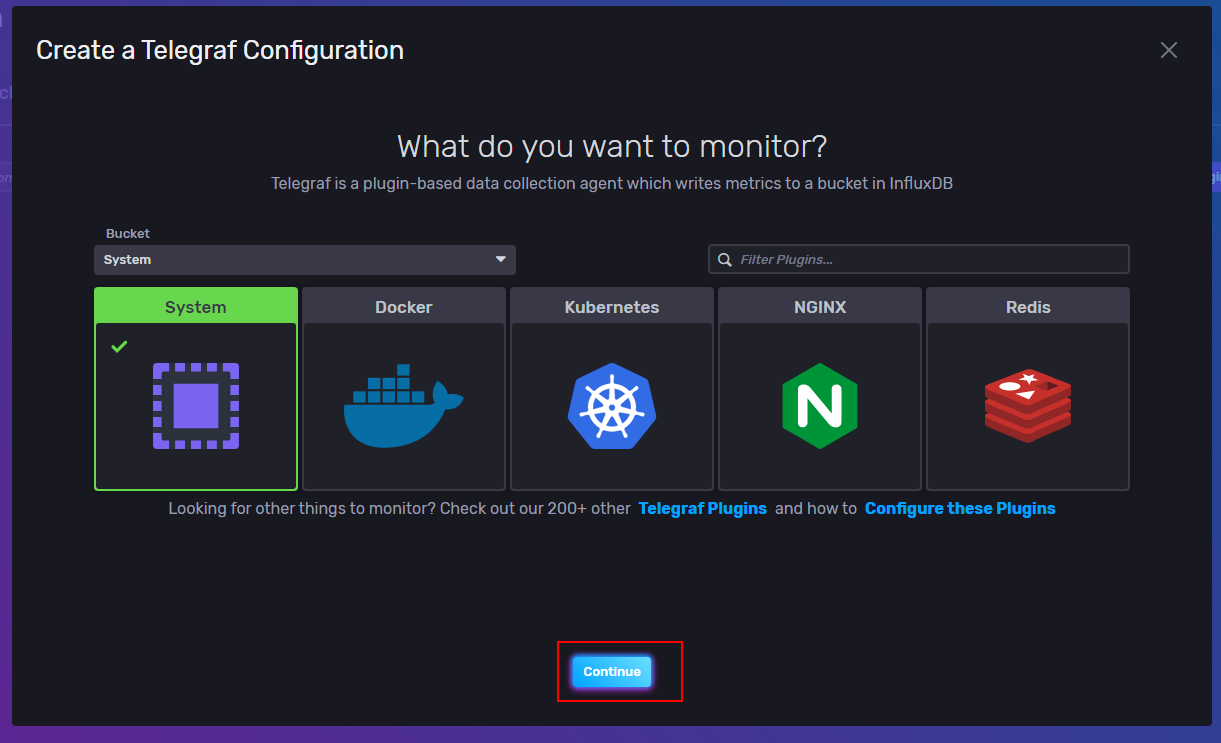
If it turns green, you are already selected and can proceed with Contiue.
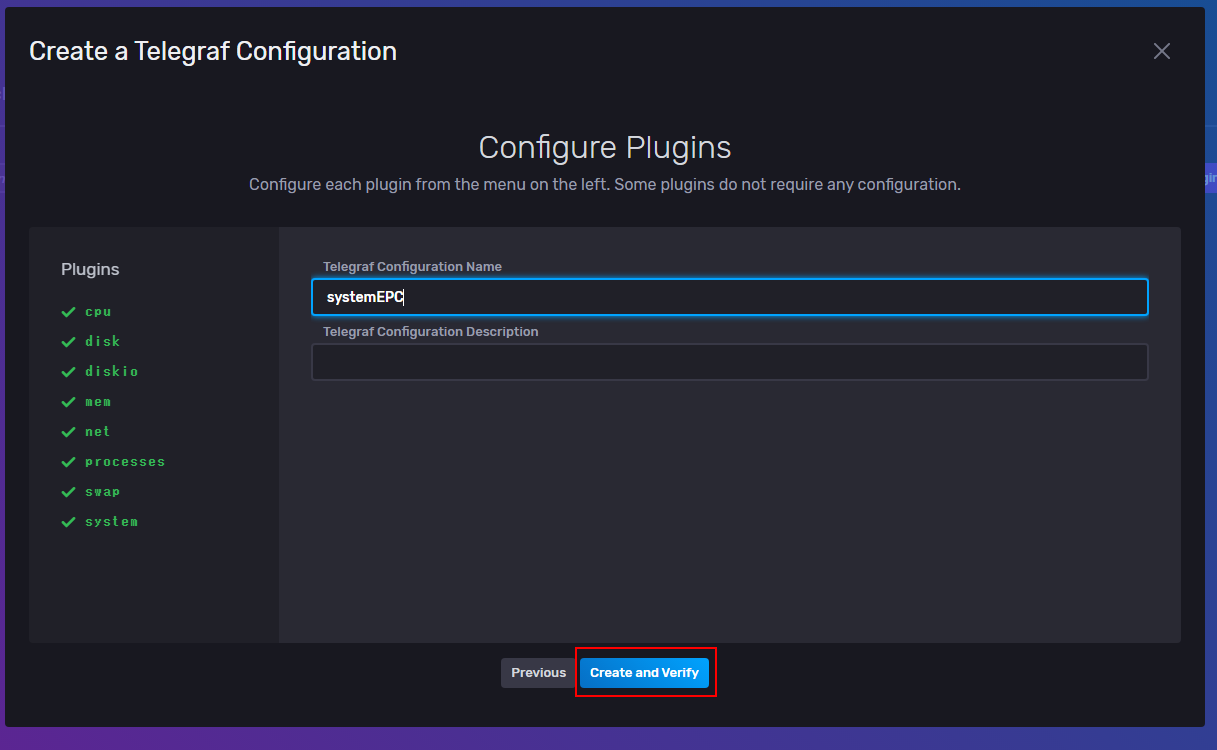
If you are OK with this Configuration, please enter the Configuration name.
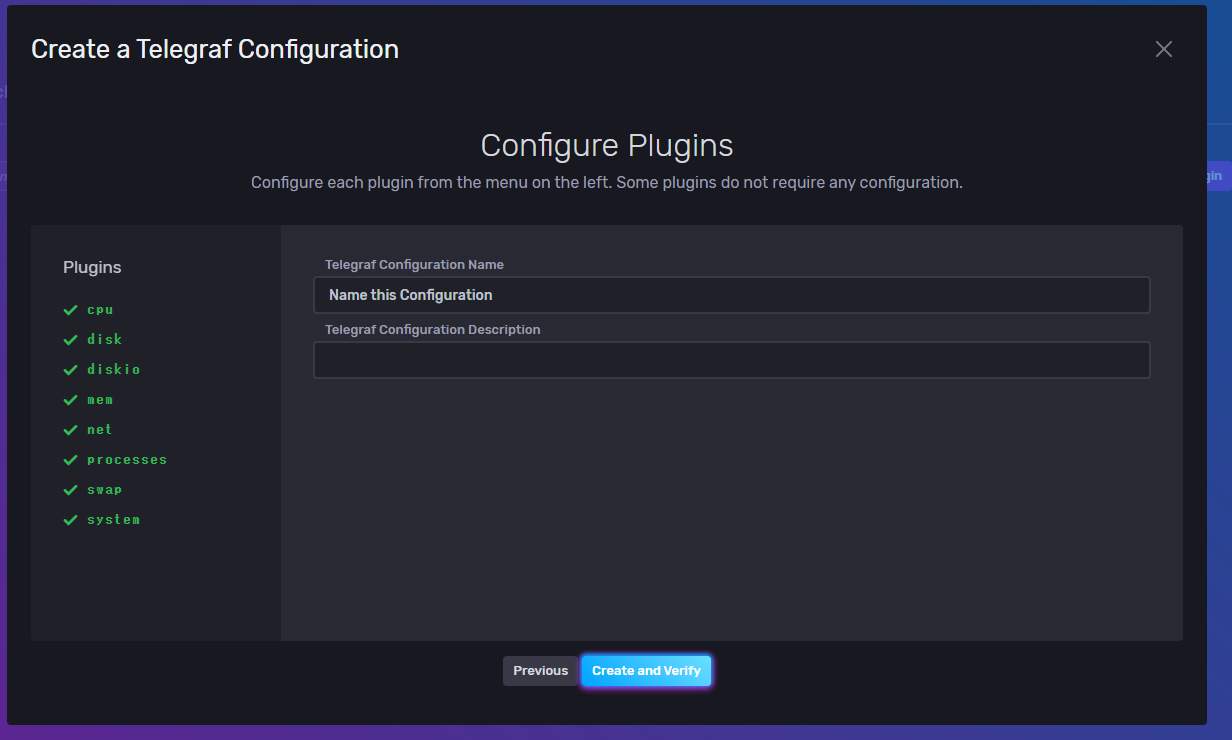
Proceed with Create and Verify.
The Test your Configuration screen will appear. Do not press Finish here yet!
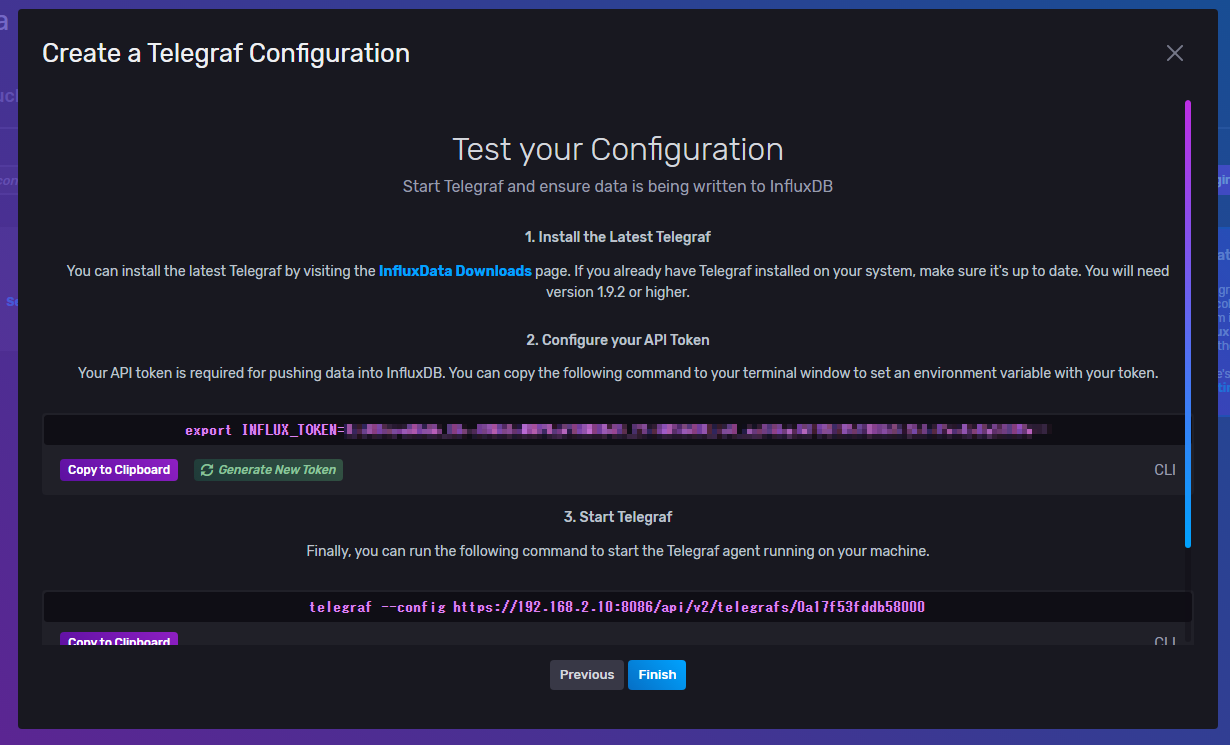
Copy the Telegraf Token
Click “Copy to Clipboard” in the Configure API token section.
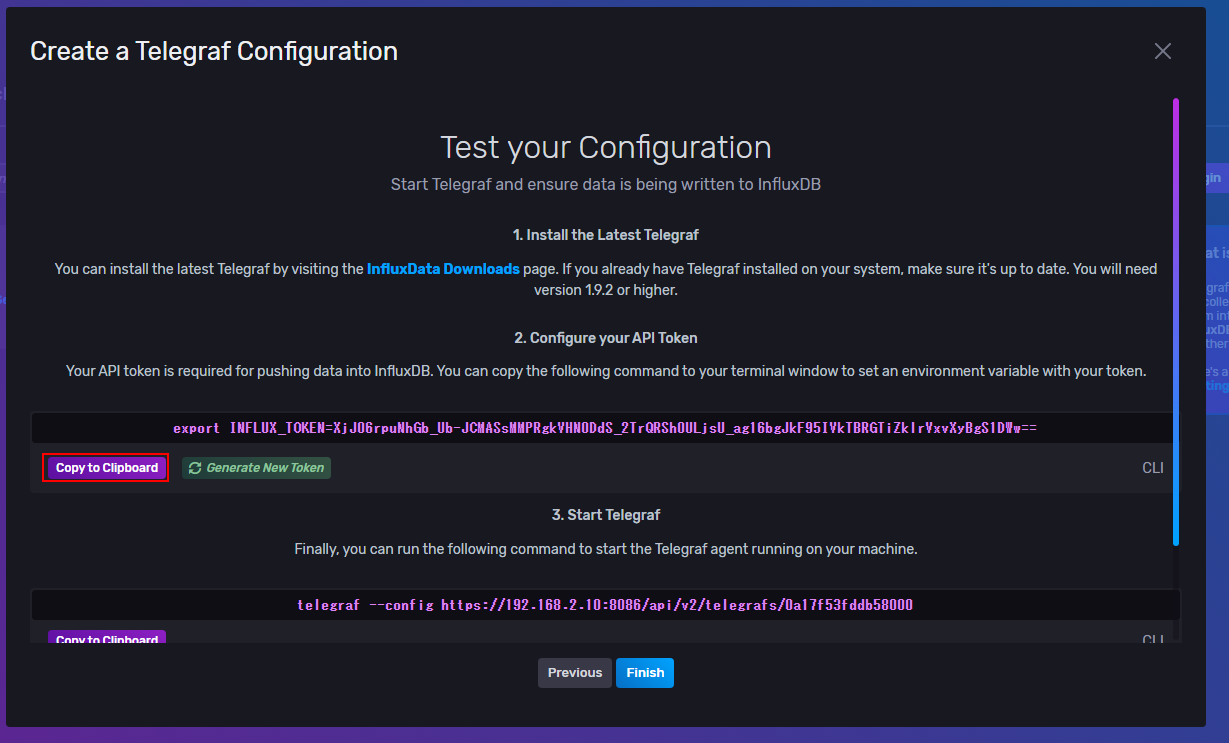
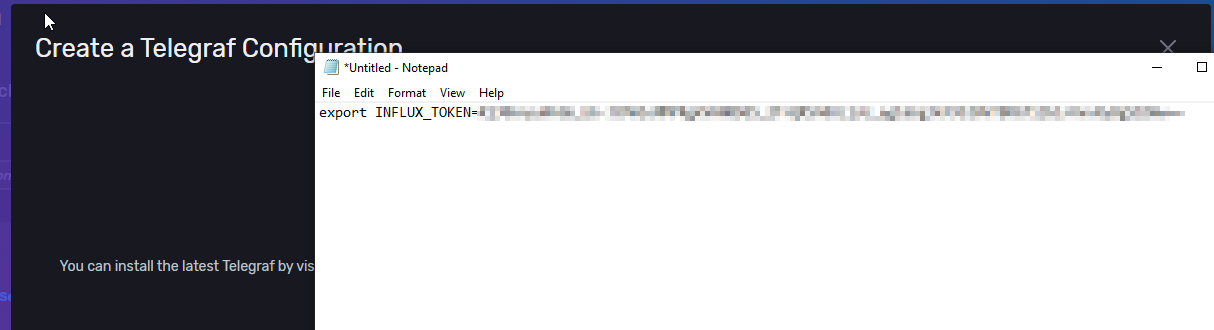
Paste the copied Token in Nodepad or similar and save it carefully.
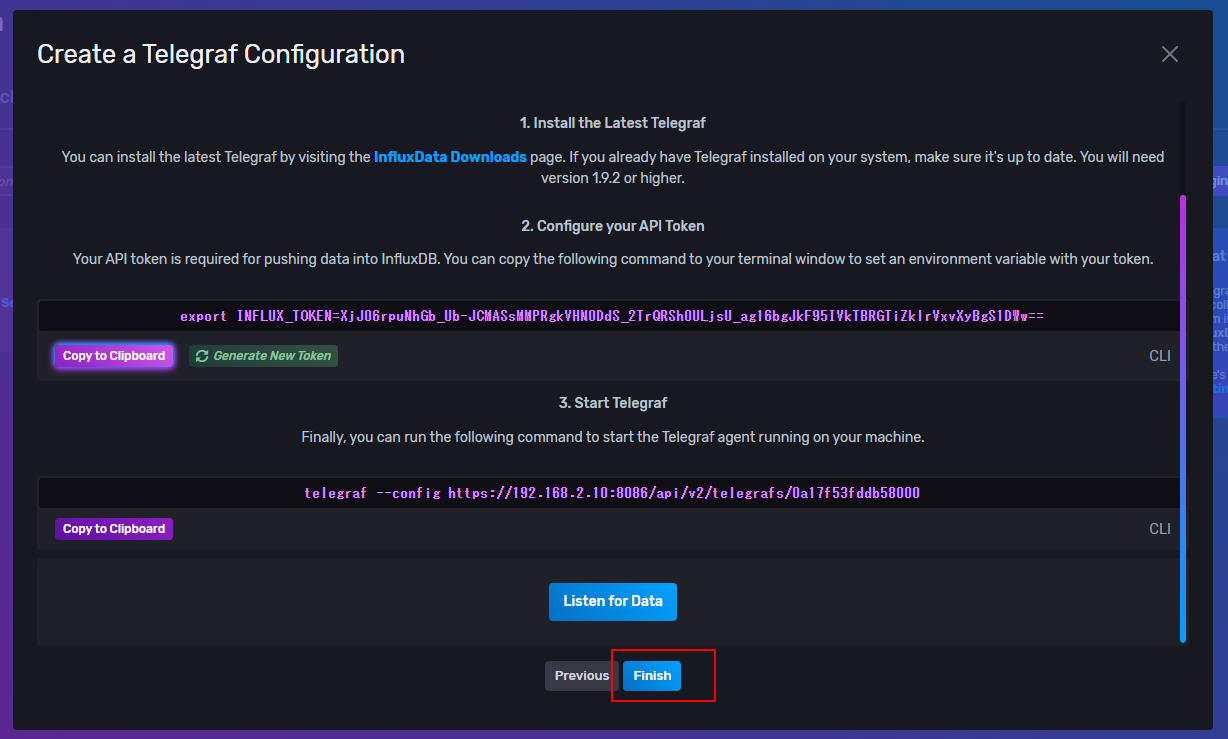
Save the Telegraf Configuration
Finally, save the Telegraf Configuration with the Finish button and you are done.
Download the Telegraf Configuration
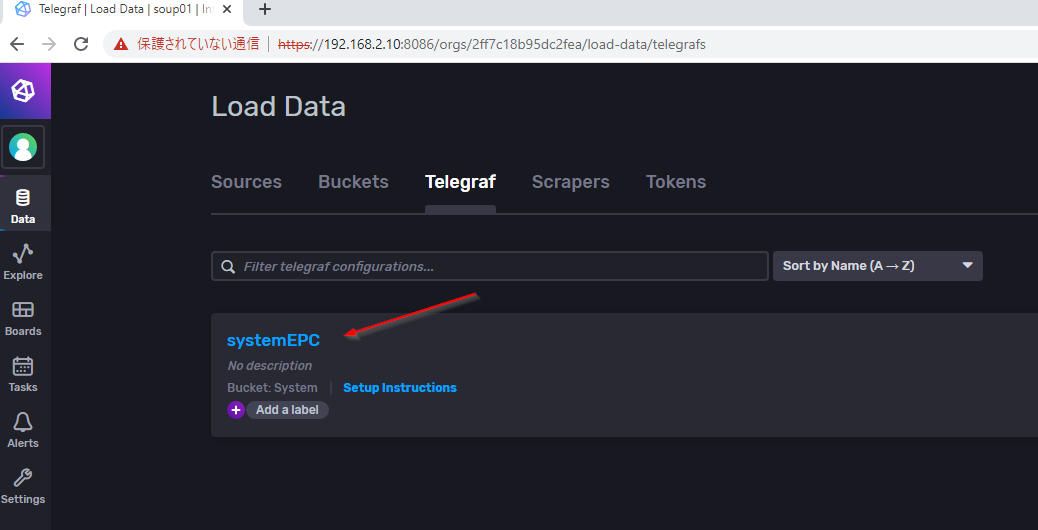
On the Telegraf tab you will find the Telegraf Connection for “systemEPC” that you have just added.
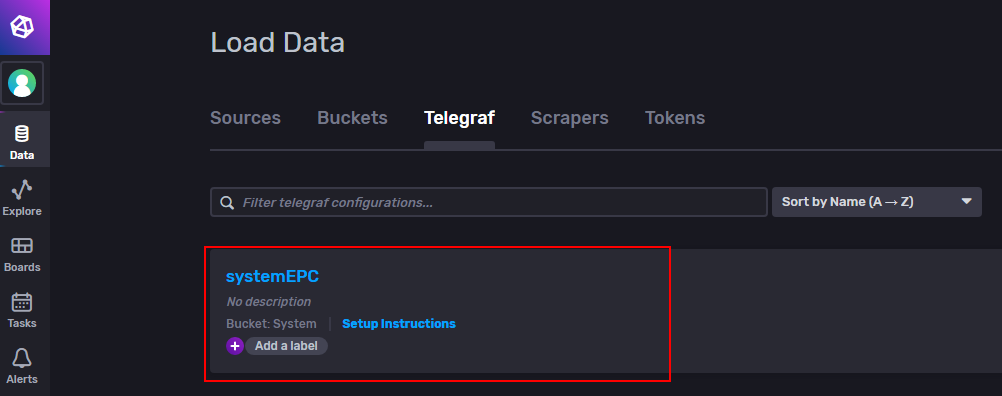
Click on systemEPC.
The File in Telegraf Configuration is displayed.
Edit – insecure skip verify
First add “insecure_skip_verify=true” under urls.
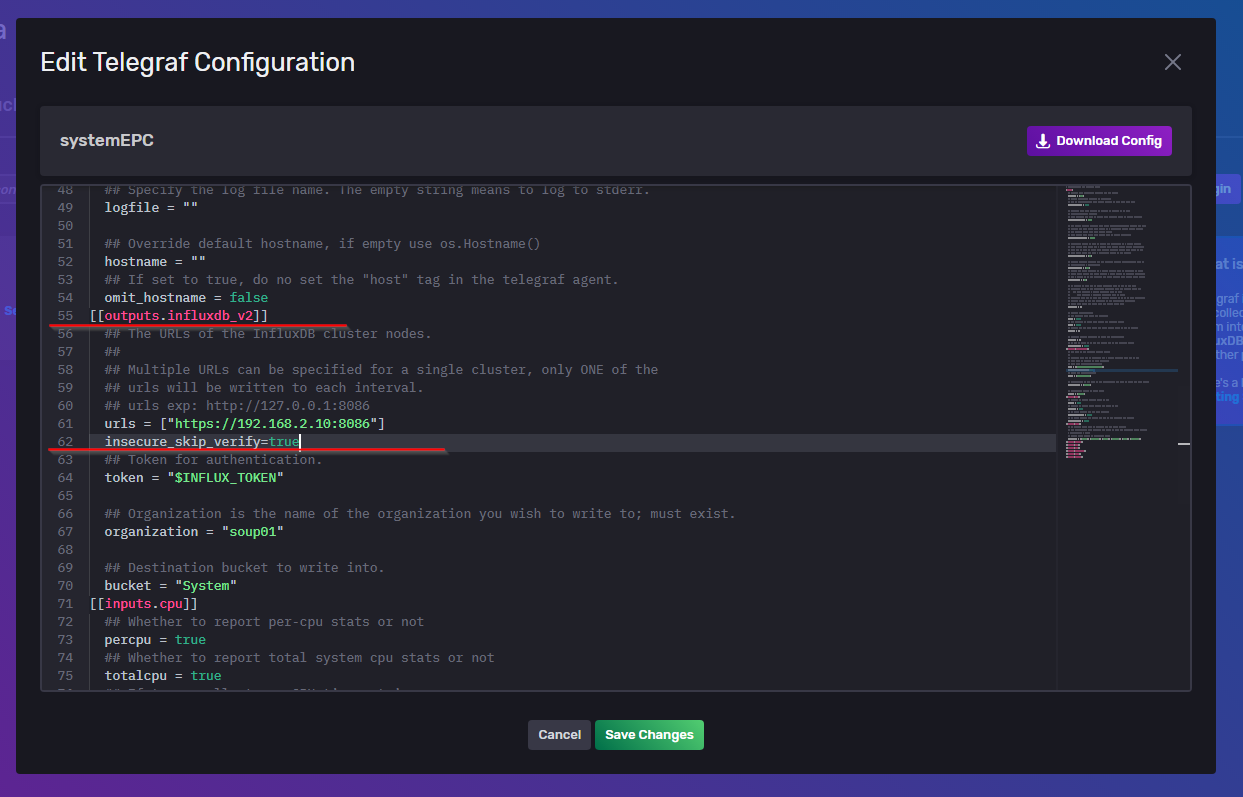
Edit – API User Token
Next, also paste the “token=xxxxxxxxxxxxxxxxxxxxxxxxxxx” that you have just copied.
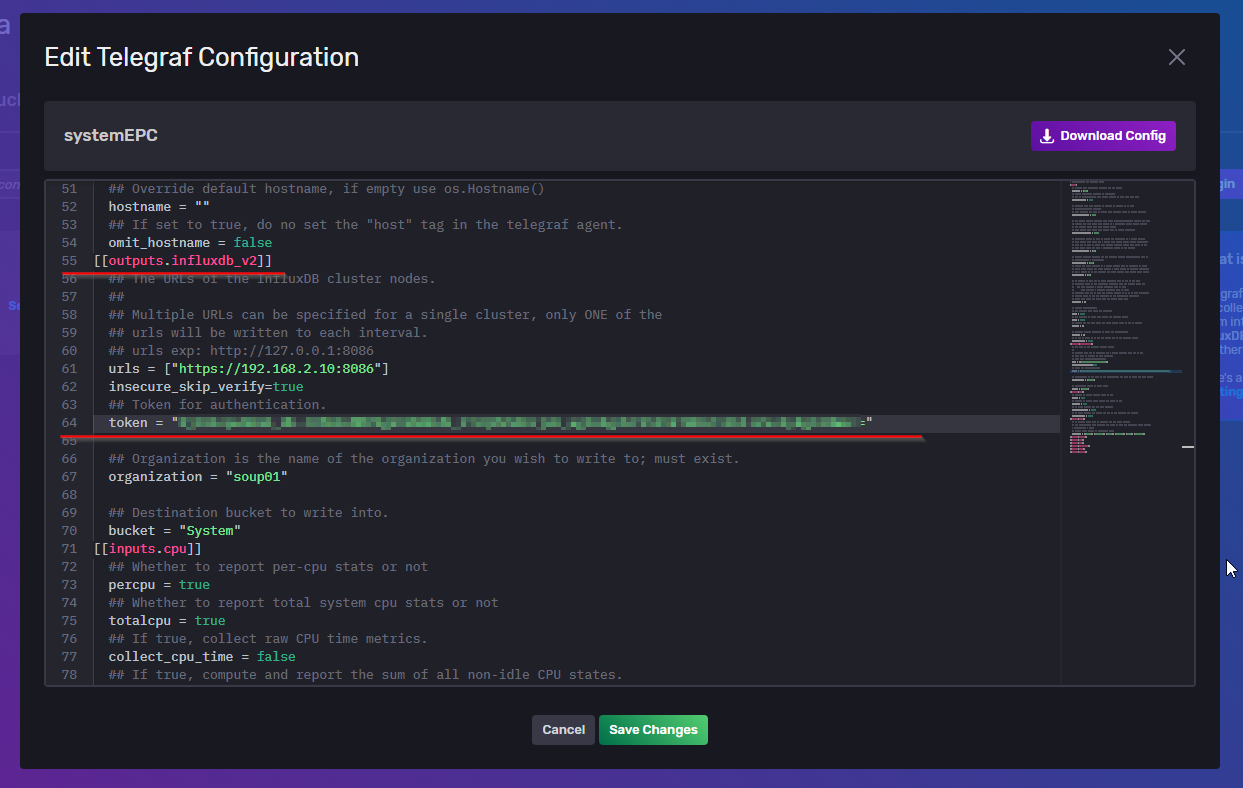
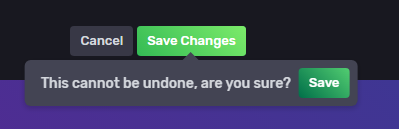
Save Changes
Press “Save Changes” to save the Configuration.
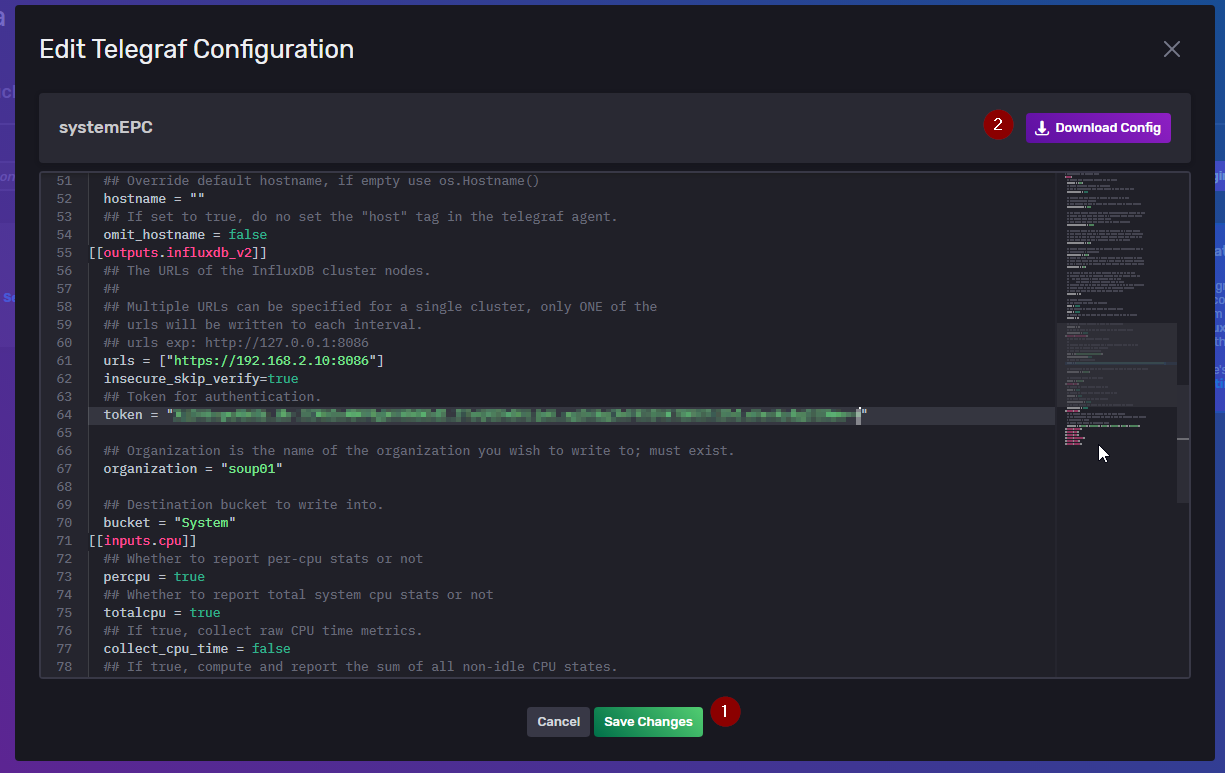
Save!
The next step is to Download Configuration.
My Telegraf.config
It is in fact my Configuration File.
| # Configuration for telegraf agent [agent] ## Default data collection interval for all inputs interval = “10s” ## Rounds collection interval to ‘interval’ ## ie, if interval=”10s” then always collect on :00, :10, :20, etc. round_interval = true ## Telegraf will send metrics to outputs in batches of at most ## metric_batch_size metrics. ## This controls the size of writes that Telegraf sends to output plugins. metric_batch_size = 1000 ## For failed writes, telegraf will cache metric_buffer_limit metrics for each ## output, and will flush this buffer on a successful write. Oldest metrics ## are dropped first when this buffer fills. ## This buffer only fills when writes fail to output plugin(s). metric_buffer_limit = 10000 ## Collection jitter is used to jitter the collection by a random amount. ## Each plugin will sleep for a random time within jitter before collecting. ## This can be used to avoid many plugins querying things like sysfs at the ## same time, which can have a measurable effect on the system. collection_jitter = “0s” ## Default flushing interval for all outputs. Maximum flush_interval will be ## flush_interval + flush_jitter flush_interval = “10s” ## Jitter the flush interval by a random amount. This is primarily to avoid ## large write spikes for users running a large number of telegraf instances. ## ie, a jitter of 5s and interval 10s means flushes will happen every 10-15s flush_jitter = “0s” ## By default or when set to “0s”, precision will be set to the same ## timestamp order as the collection interval, with the maximum being 1s. ## ie, when interval = “10s”, precision will be “1s” ## when interval = “250ms”, precision will be “1ms” ## Precision will NOT be used for service inputs. It is up to each individual ## service input to set the timestamp at the appropriate precision. ## Valid time units are “ns”, “us” (or “µs”), “ms”, “s”. precision = “” ## Logging configuration: ## Run telegraf with debug log messages. debug = false ## Run telegraf in quiet mode (error log messages only). quiet = false ## Specify the log file name. The empty string means to log to stderr. logfile = “” ## Override default hostname, if empty use os.Hostname() hostname = “” ## If set to true, do no set the “host” tag in the telegraf agent. omit_hostname = false [[outputs.influxdb_v2]] ## The URLs of the InfluxDB cluster nodes. ## ## Multiple URLs can be specified for a single cluster, only ONE of the ## urls will be written to each interval. ## urls exp: http://127.0.0.1:8086 urls = [“https://192.168.2.10:8086”] insecure_skip_verify=true ## Token for authentication. token = “xxxxxxxxxxxxxxxxxxxxxxxxxxxxxxxxxxxxxxxxxxxxxxxxxxxxxxxxxxxxxxxxxxxxxxx” ## Organization is the name of the organization you wish to write to; must exist. organization = “soup01” ## Destination bucket to write into. bucket = “System” [[inputs.cpu]] ## Whether to report per-cpu stats or not percpu = true ## Whether to report total system cpu stats or not totalcpu = true ## If true, collect raw CPU time metrics. collect_cpu_time = false ## If true, compute and report the sum of all non-idle CPU states. report_active = false [[inputs.disk]] ## By default stats will be gathered for all mount points. ## Set mount_points will restrict the stats to only the specified mount points. # mount_points = [“/”] ## Ignore mount points by filesystem type. ignore_fs = [“tmpfs”, “devtmpfs”, “devfs”, “overlay”, “aufs”, “squashfs”] [[inputs.diskio]] [[inputs.mem]] [[inputs.net]] [[inputs.processes]] [[inputs.swap]] [[inputs.system]] |
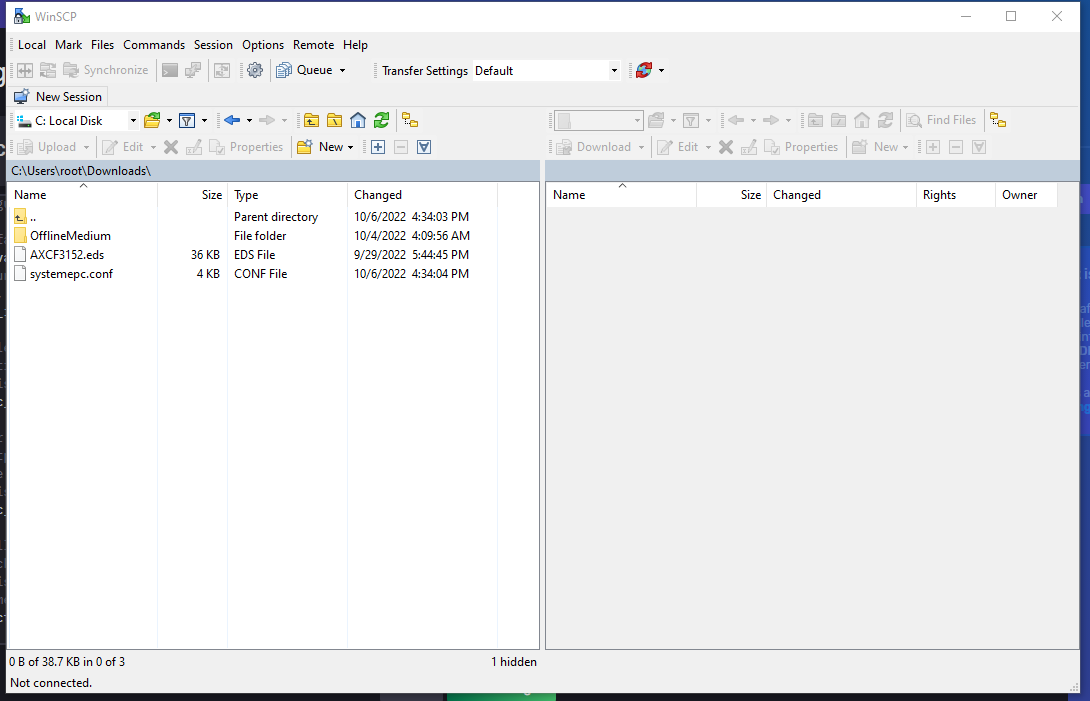
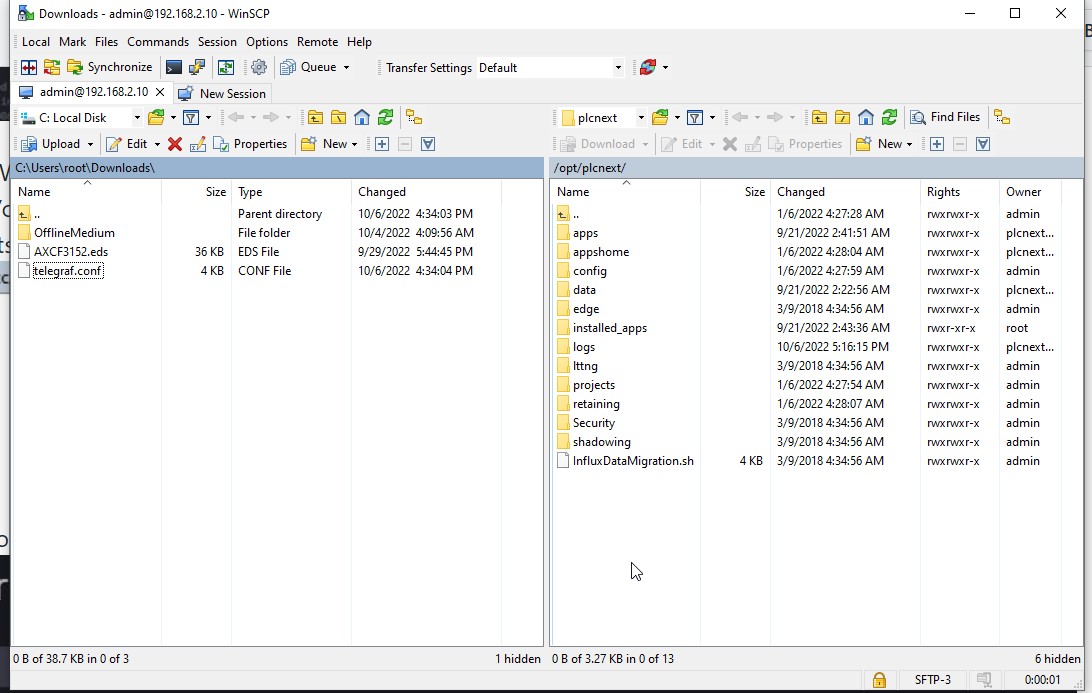
Transfer the Configuration file to EPC1522
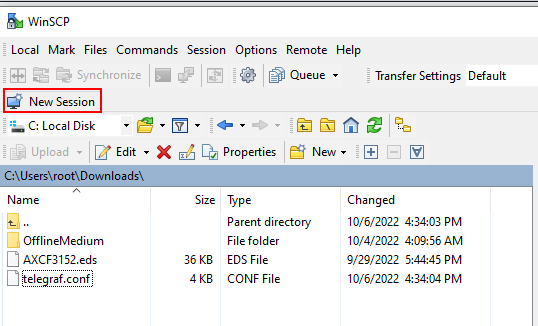
Transfer the Telegraf Configuration File to the EPC1522, start up WinSCP.
If you do not know how to do this, please refer to the Tutorial below.
Login
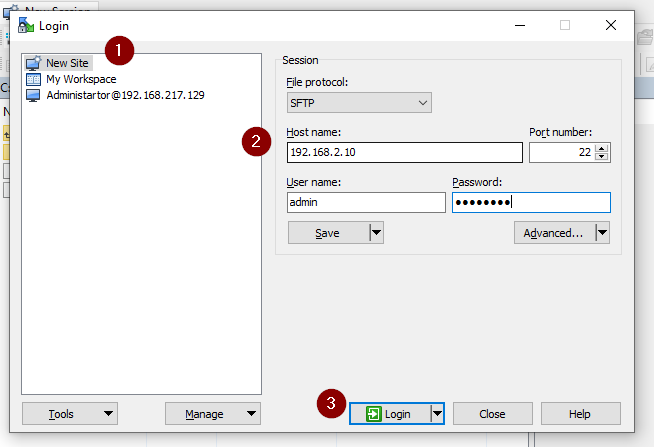
Login with New Session.
New Site>Host Name is the IP of EPC1522, enter your Uesrname and Password>Login.
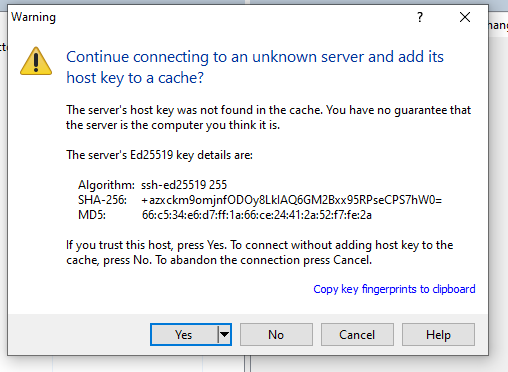
Yes.
Continue.
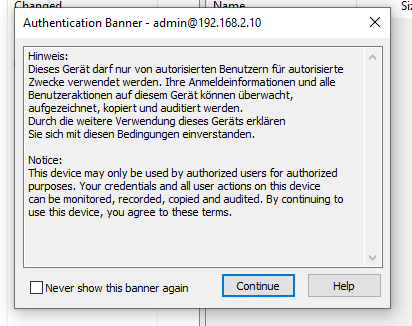
Login was successful.
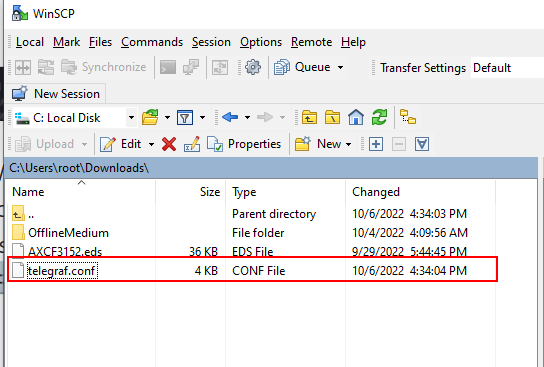
Rename
Rename the systemepc.conf downloaded earlier.
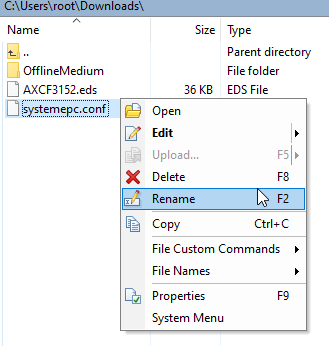
Just change to telegraf.conf.
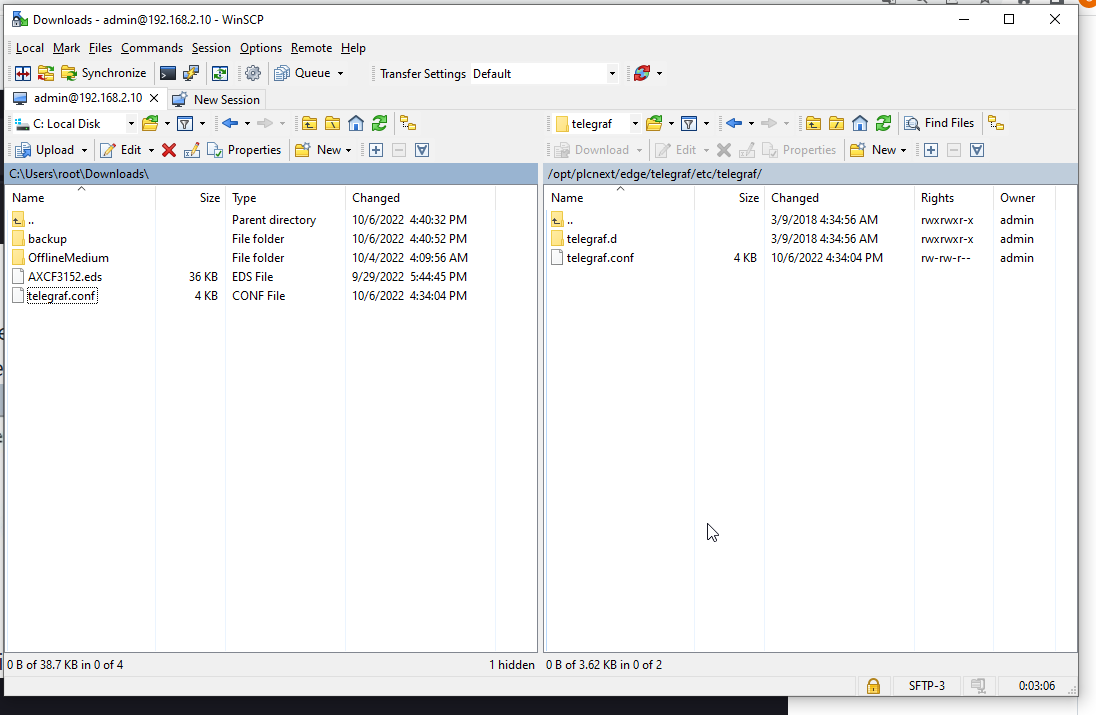
Backup the Telegraf.config
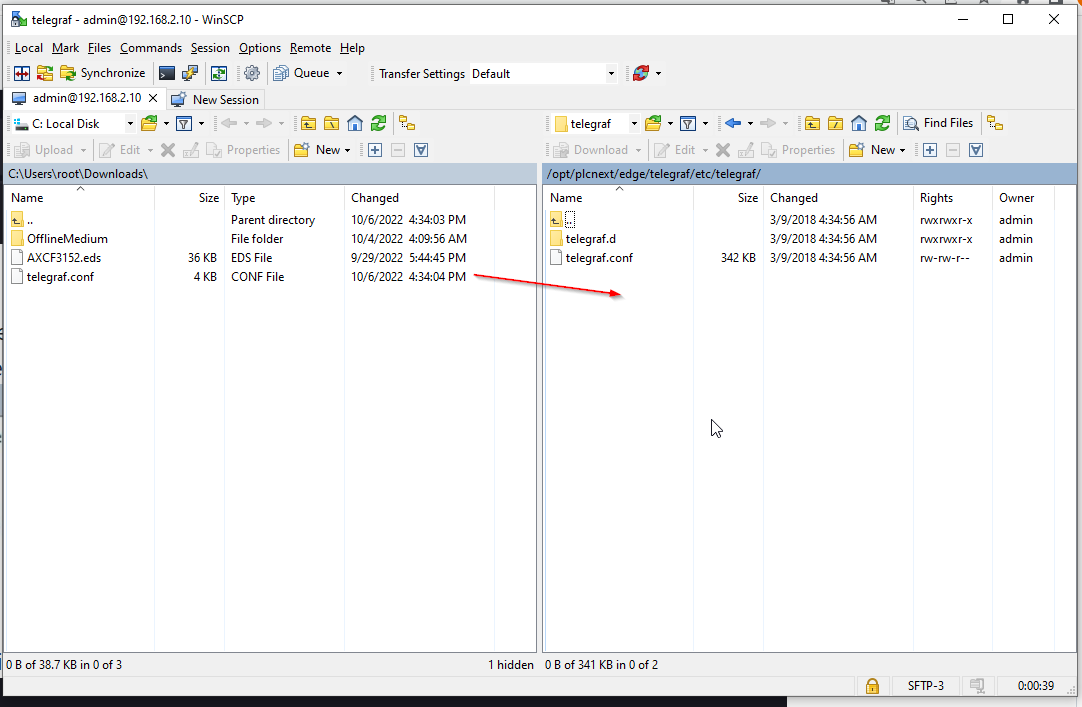
Move to /opt/plcnext/edge/telegraf/etc/telegraf/ and,
Before transferring, of course, Please backup the Configuration of the EPC1522.
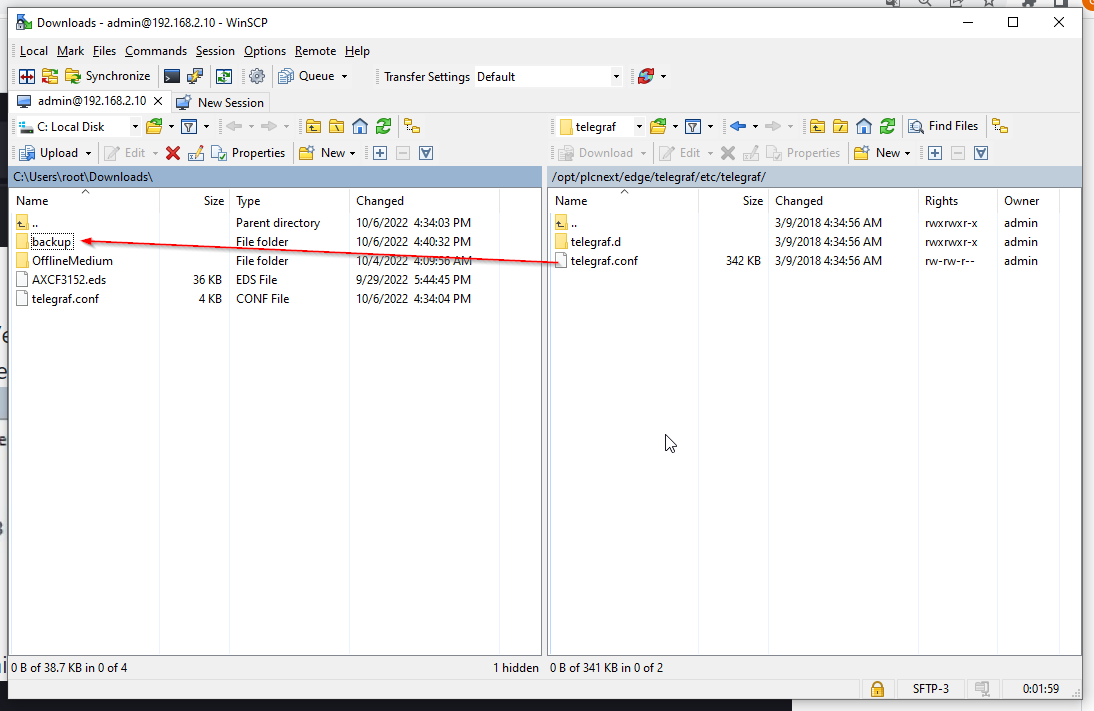
Transfer the file
Transfer telegraf.conf to /opt/plcnext/edge/telegraf/etc/telegraf/ on the EPC1522.
Done!
Check the Result
Restart the EPC1522
First switch the EPC1522 back on.
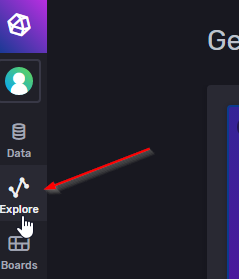
Explore
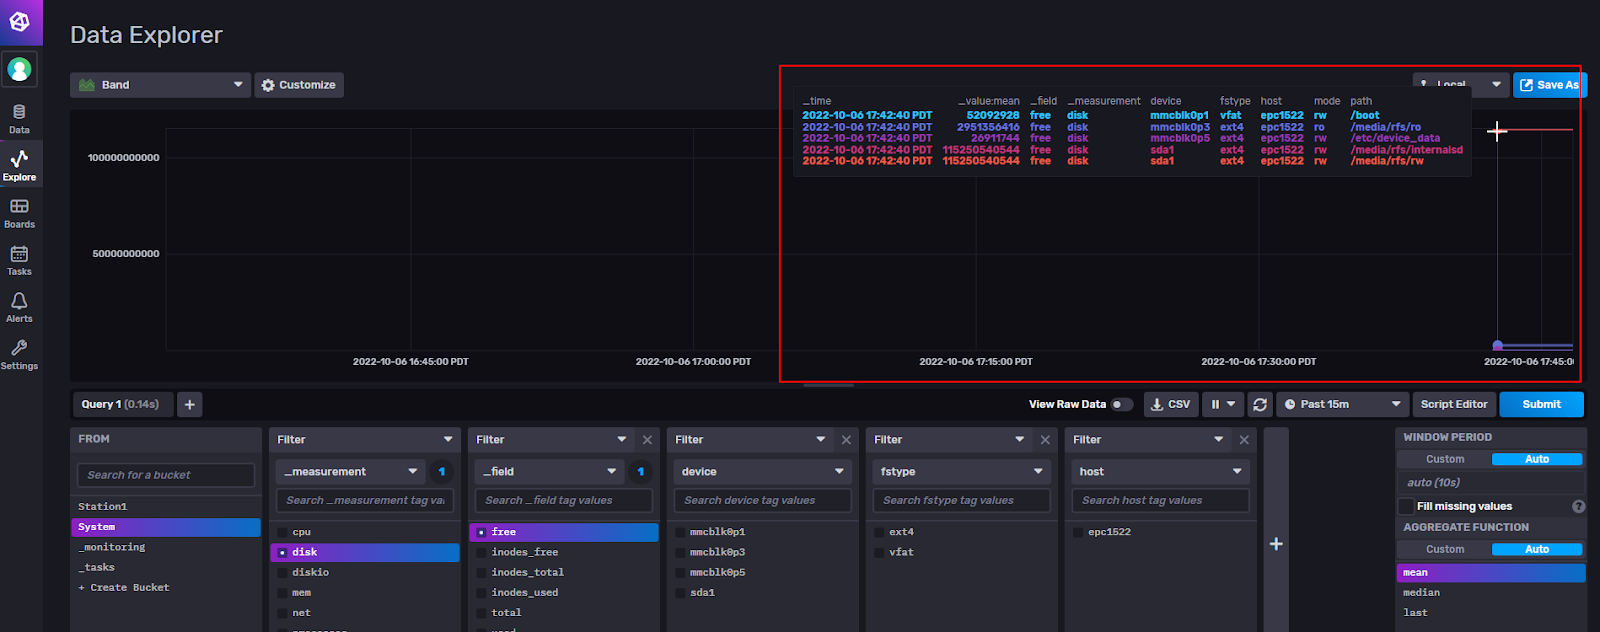
Go to https://yourEPC1522:8086にアクセスし and click Explore.
Select Buckets in System.
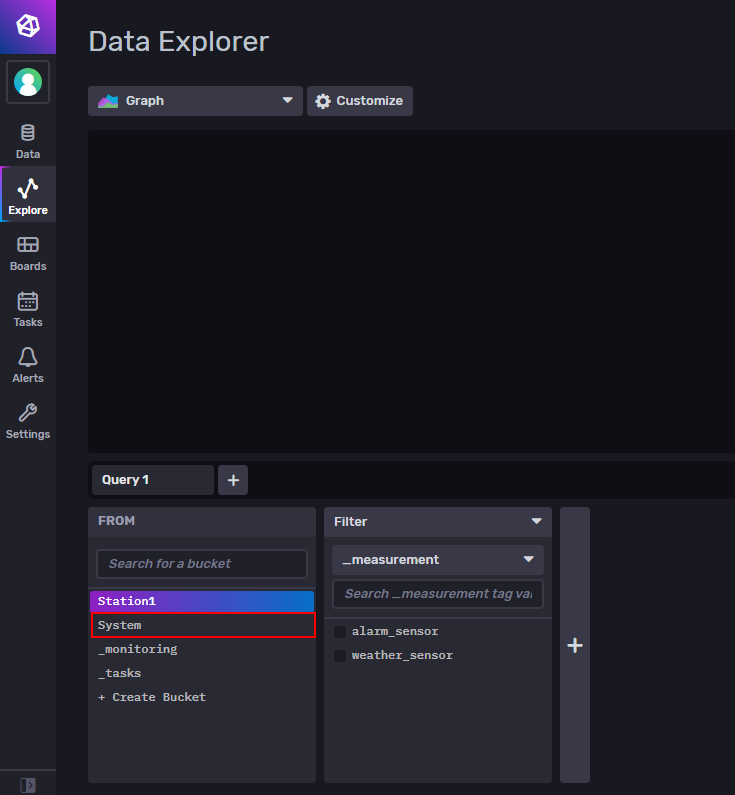
I’m getting the free space in Disck now.
You saw the data.
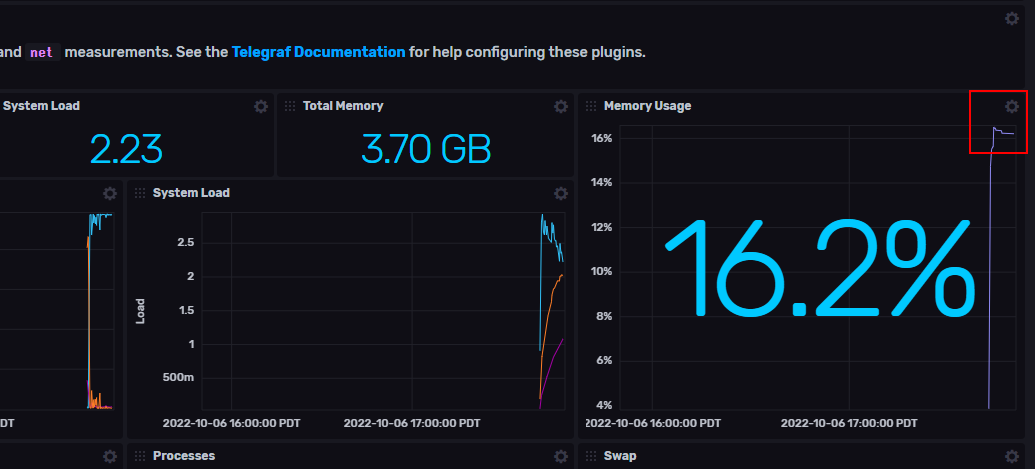
Configure your dashboard
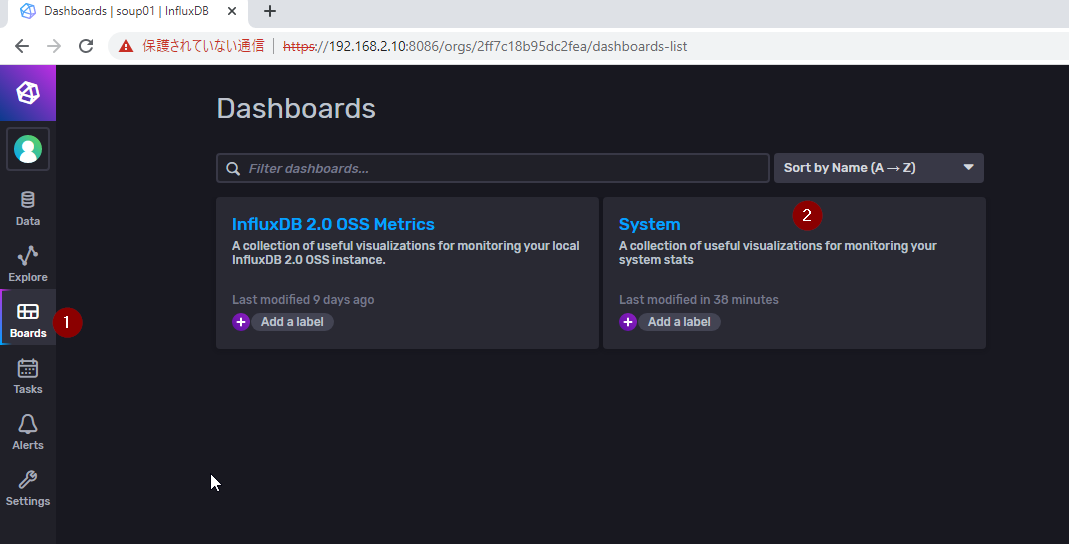
The last one is the bonus: open Boards and click on >System.
There you can list the data in the System’s Buckets.
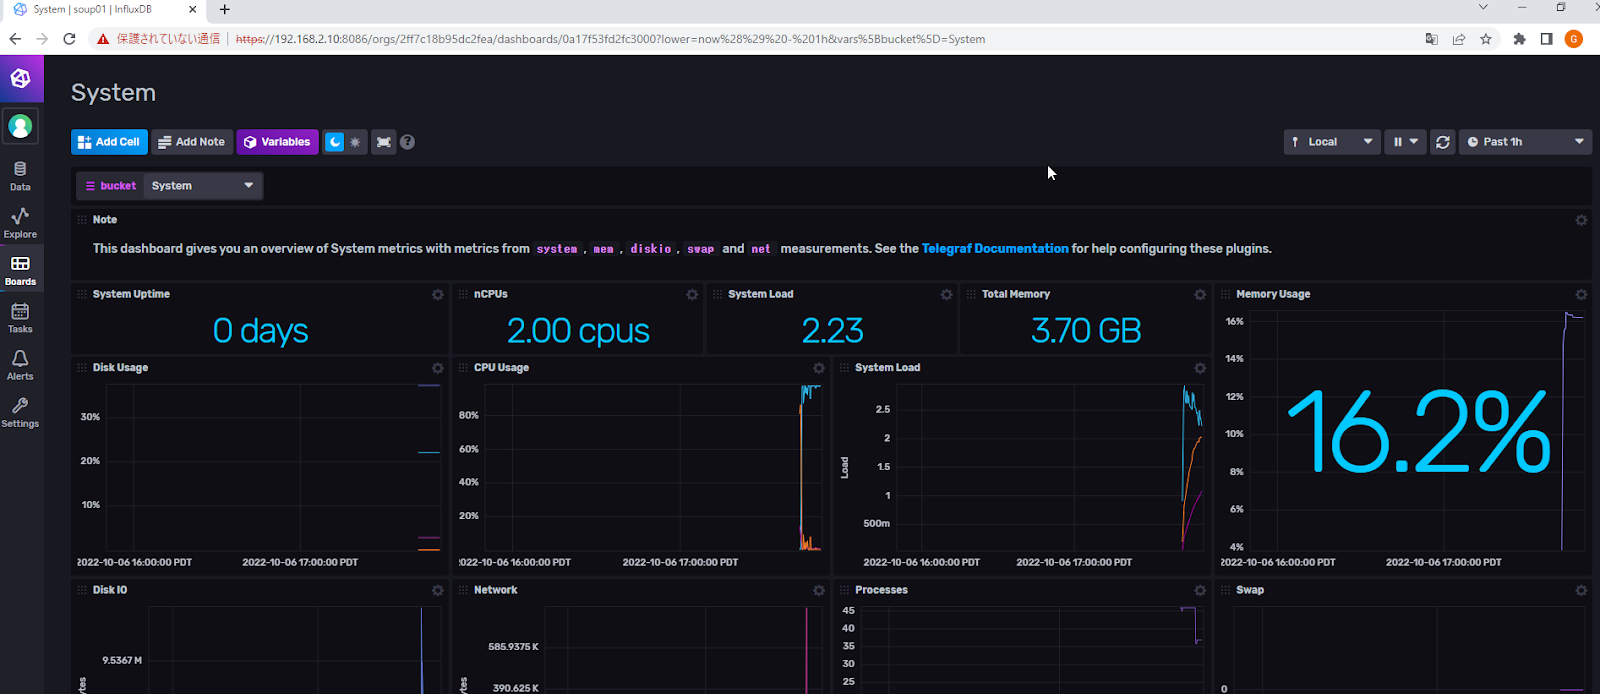
Each Field also has a small gear. Click on them.
Click Configure.
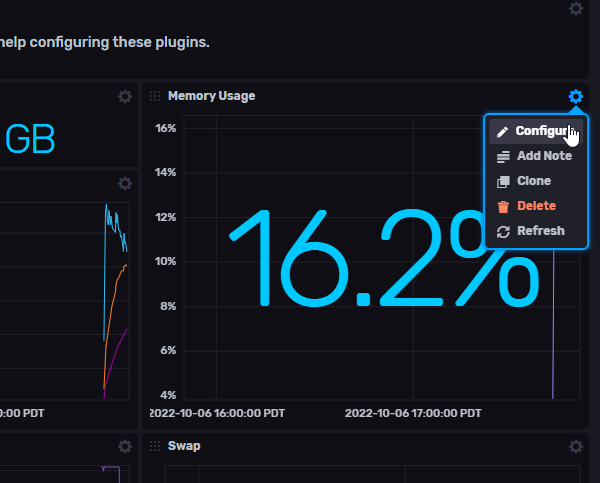
If you change the Flux Script there, it becomes your own personal display and Dashboard.