今回の記事ではctrlXのInfluxDBだけではなく、Telegraf APPの連携方法を説明します。Telegrafは300以上のPlug-inがあり、OTで一番使えそうなMQTT・OPC UA・ModbusのConfiguration設定し、Groov EPICのControllerのデータを取得します。
さ、はじめよう!

ctrlX AUTOMATION – Telegraf
Telegraf™はInfluxDataによって登録/所有されている商標であり、InfluxDataはこのctrlX COREアプリと関係ありません。Telegraf Appは、情報を収集、処理、集約し、InfluxDBのようなターゲットシステムに書き込み可能なPluginをたくさん提供しています。
Telegrafを使うことによって、例えば以下の機能を実装できます。
- Database: MongoDB、MySQL、Redisなどのデータソースに接続し、データ収集と送信を行います。
- Systems: クラウドプラットフォーム、コンテナ、オーケストレーターの最新スタックから情報を収集できます。
- IoT sensors: IoTセンサーやデバイスから重要な状態データ(圧力レベル、温度レベルなど)を収集できます。
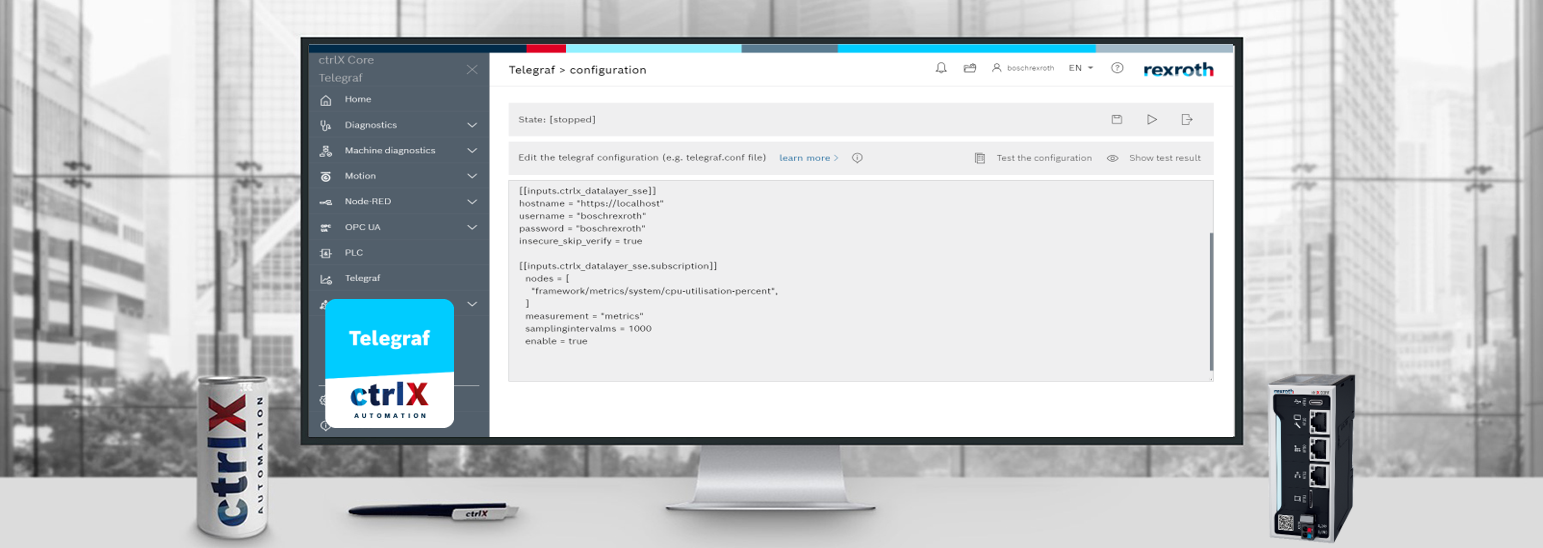
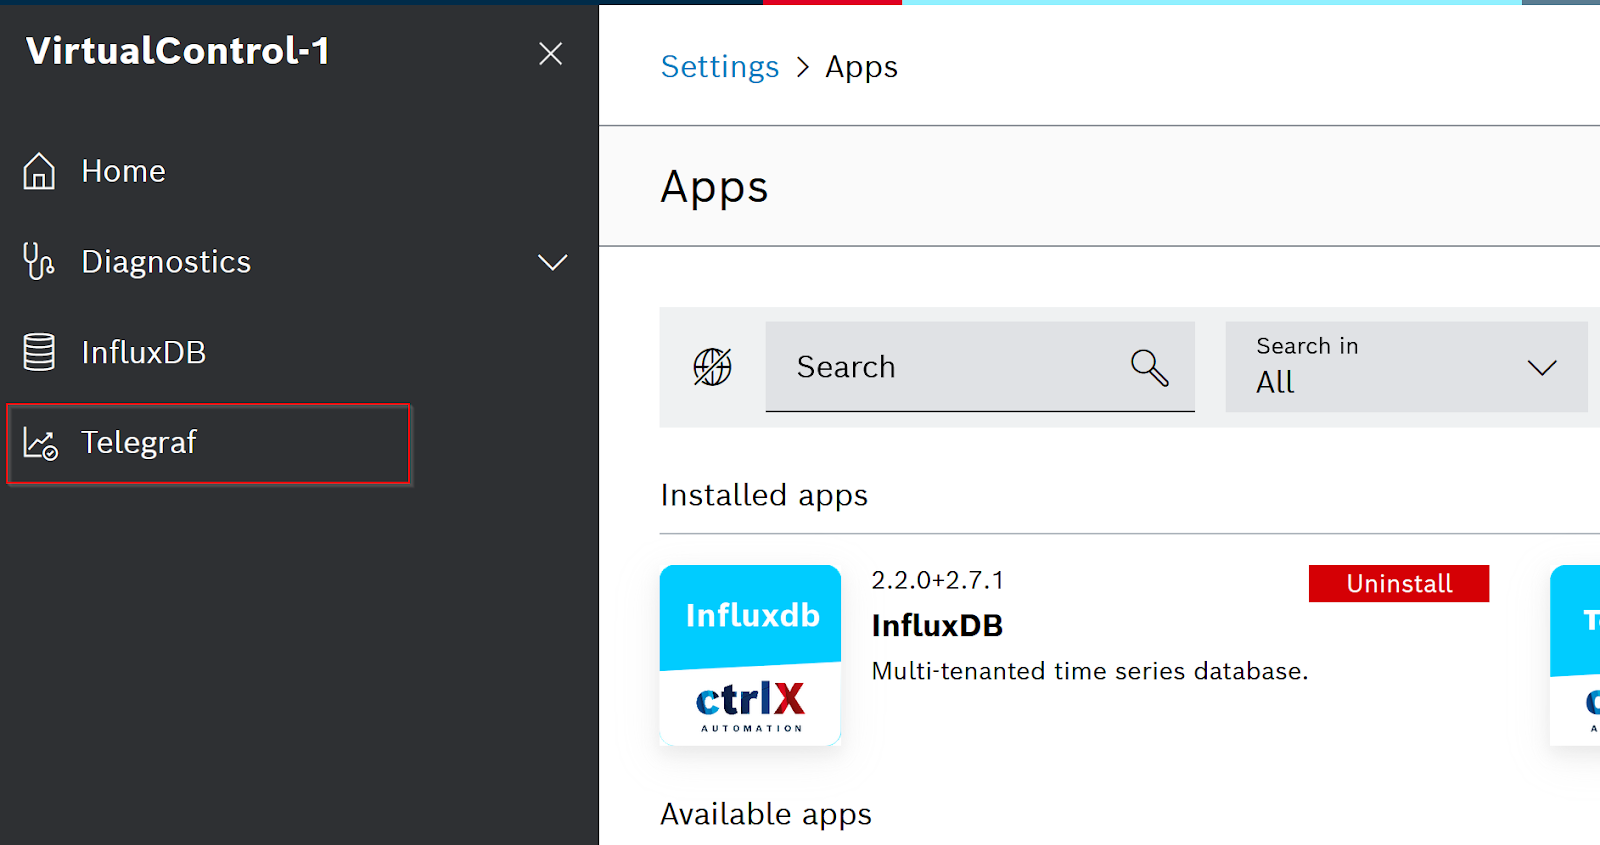
こちらはTelegraf Appの基本画面です。
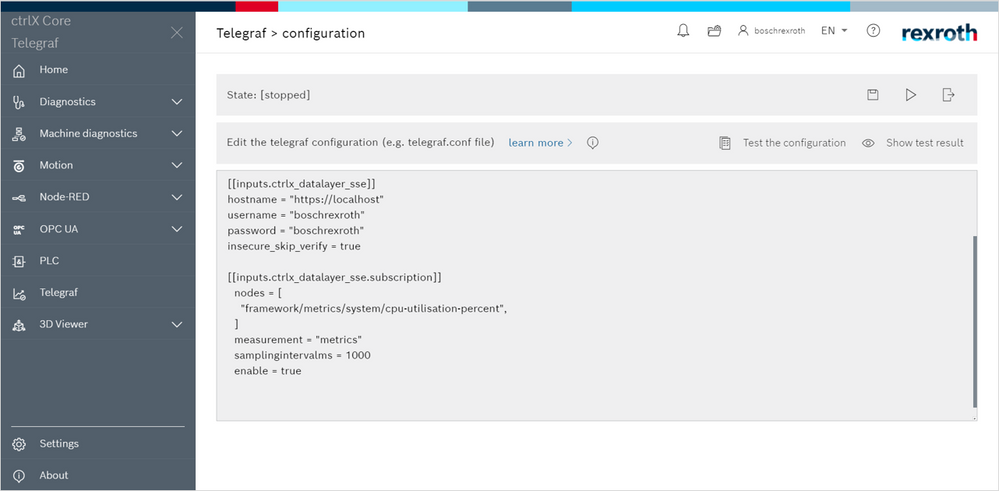
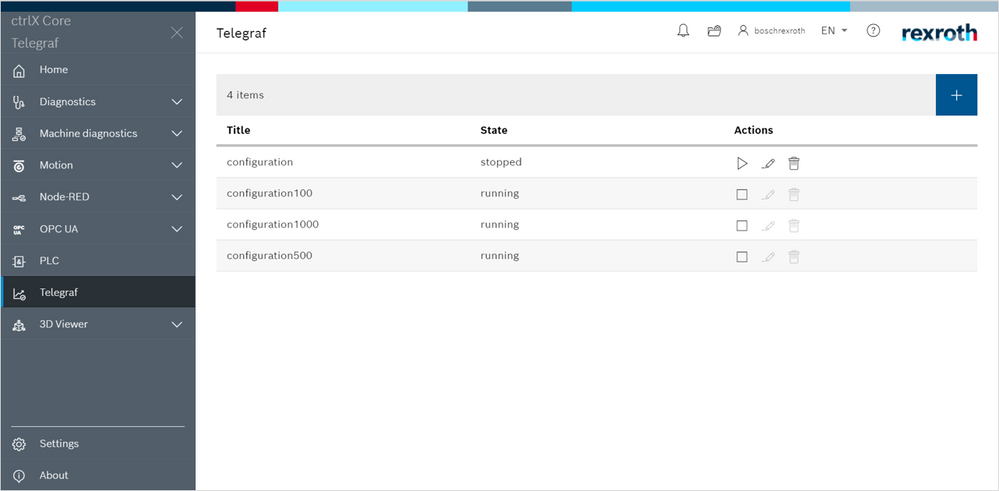
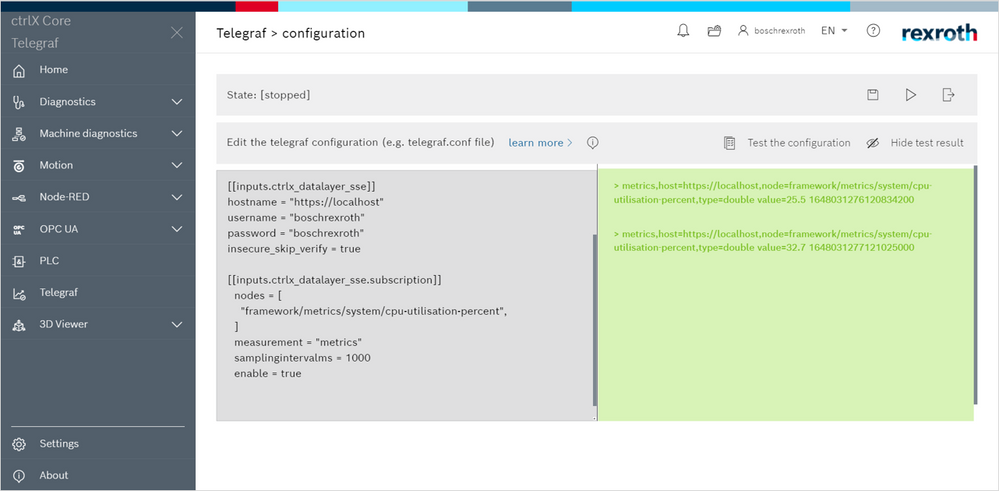
こちらはTelegrafのConfiguration管理画面です。
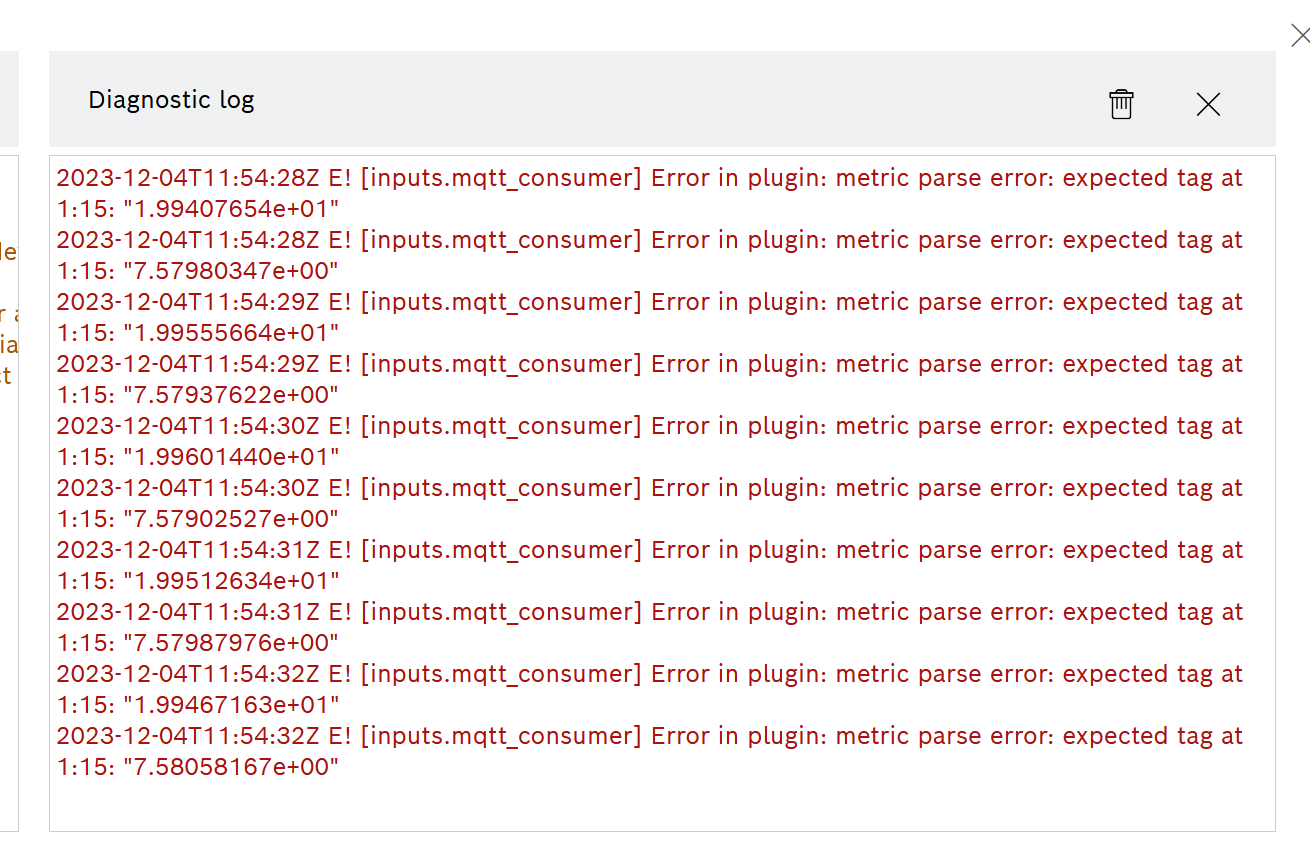
Telegraf APPには診断Log機能もあり、実際Telegrafの状態を確認もできます。
下図のように、Telgrafがエラー発生するときは赤色のメッセージが表示されています。
Install APP
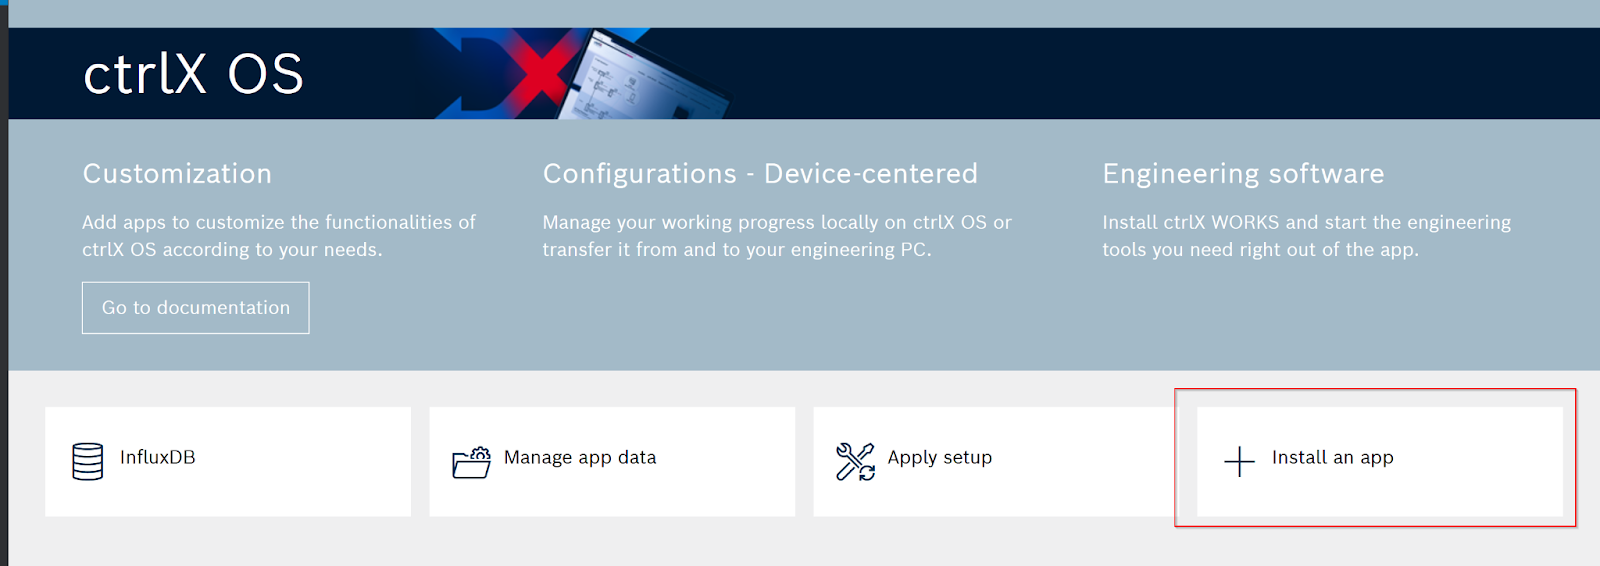
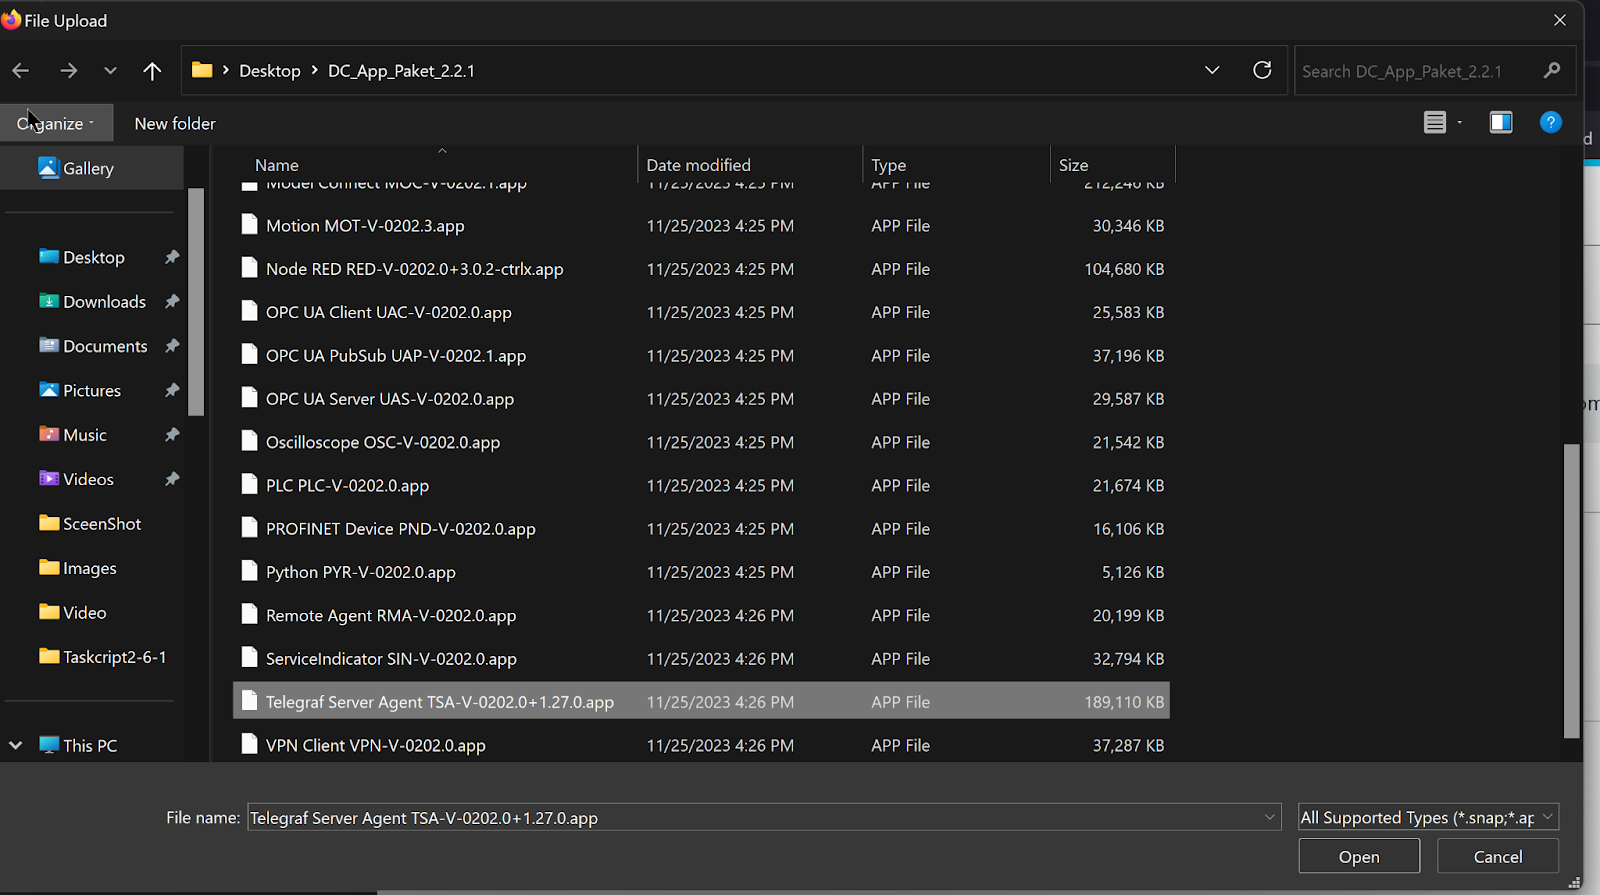
次はTelegraf Appをインストールするため、Web Server>Install an appをクリックします。
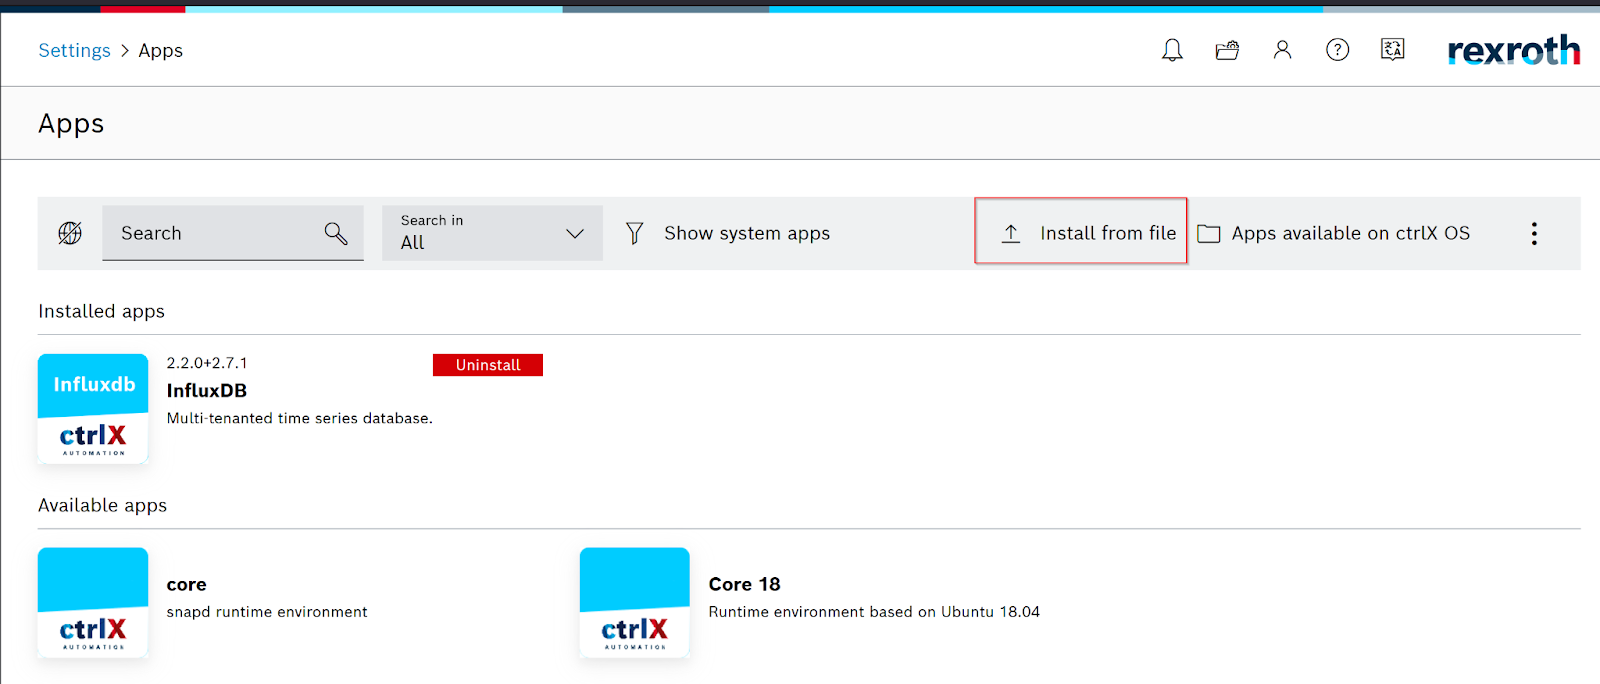
Install from fileをクリックします。
Telegraf Appを選択します。
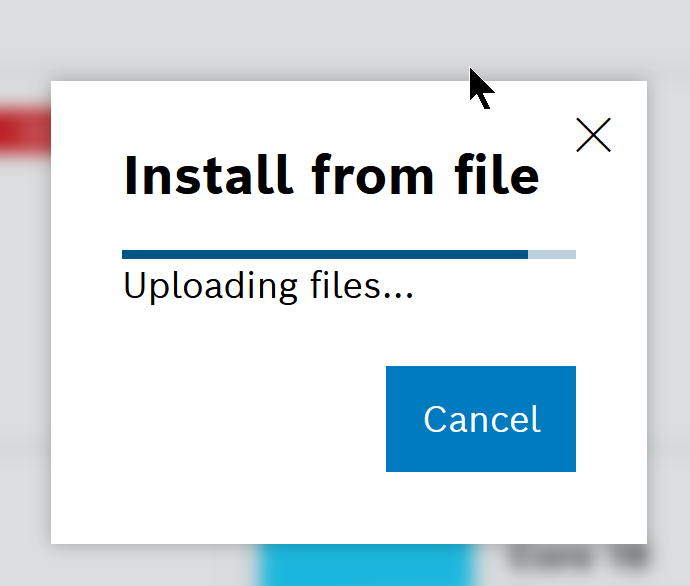
しばらくまちます…
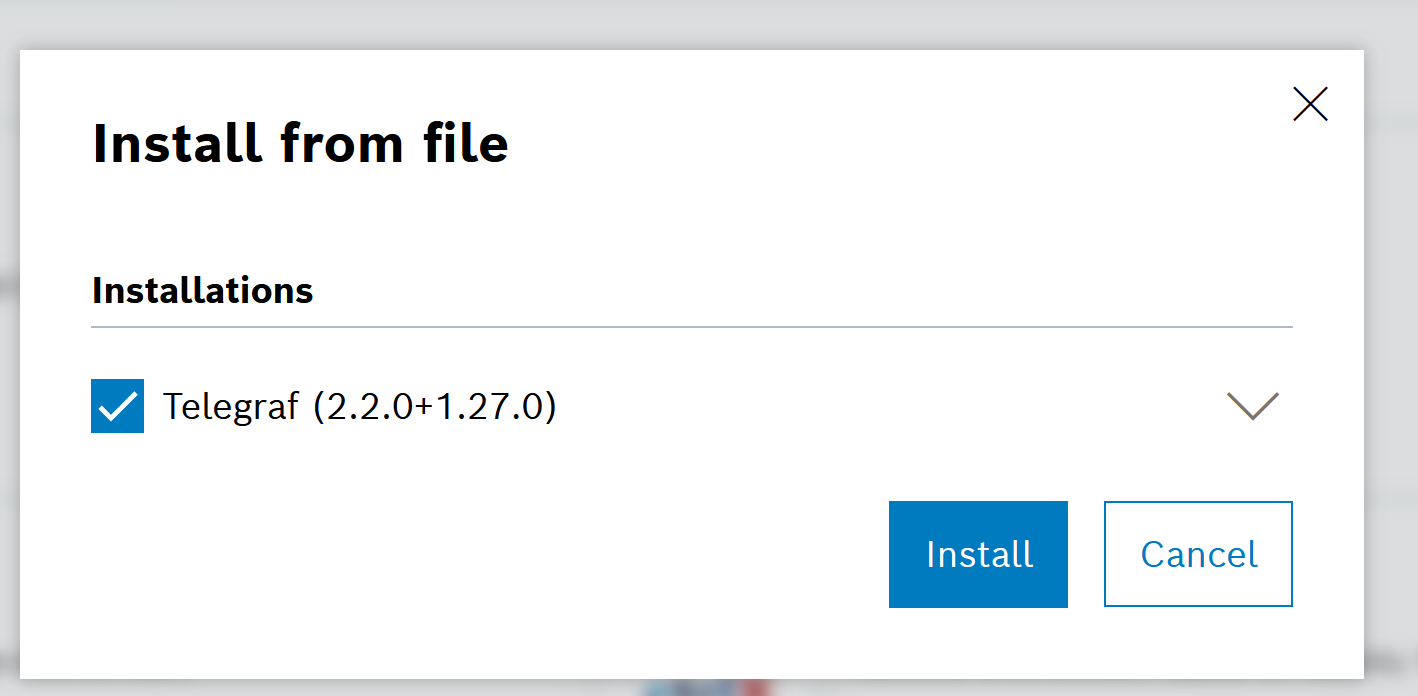
TelegrafのCheckboxを入れて、Installボタンをクリックします。
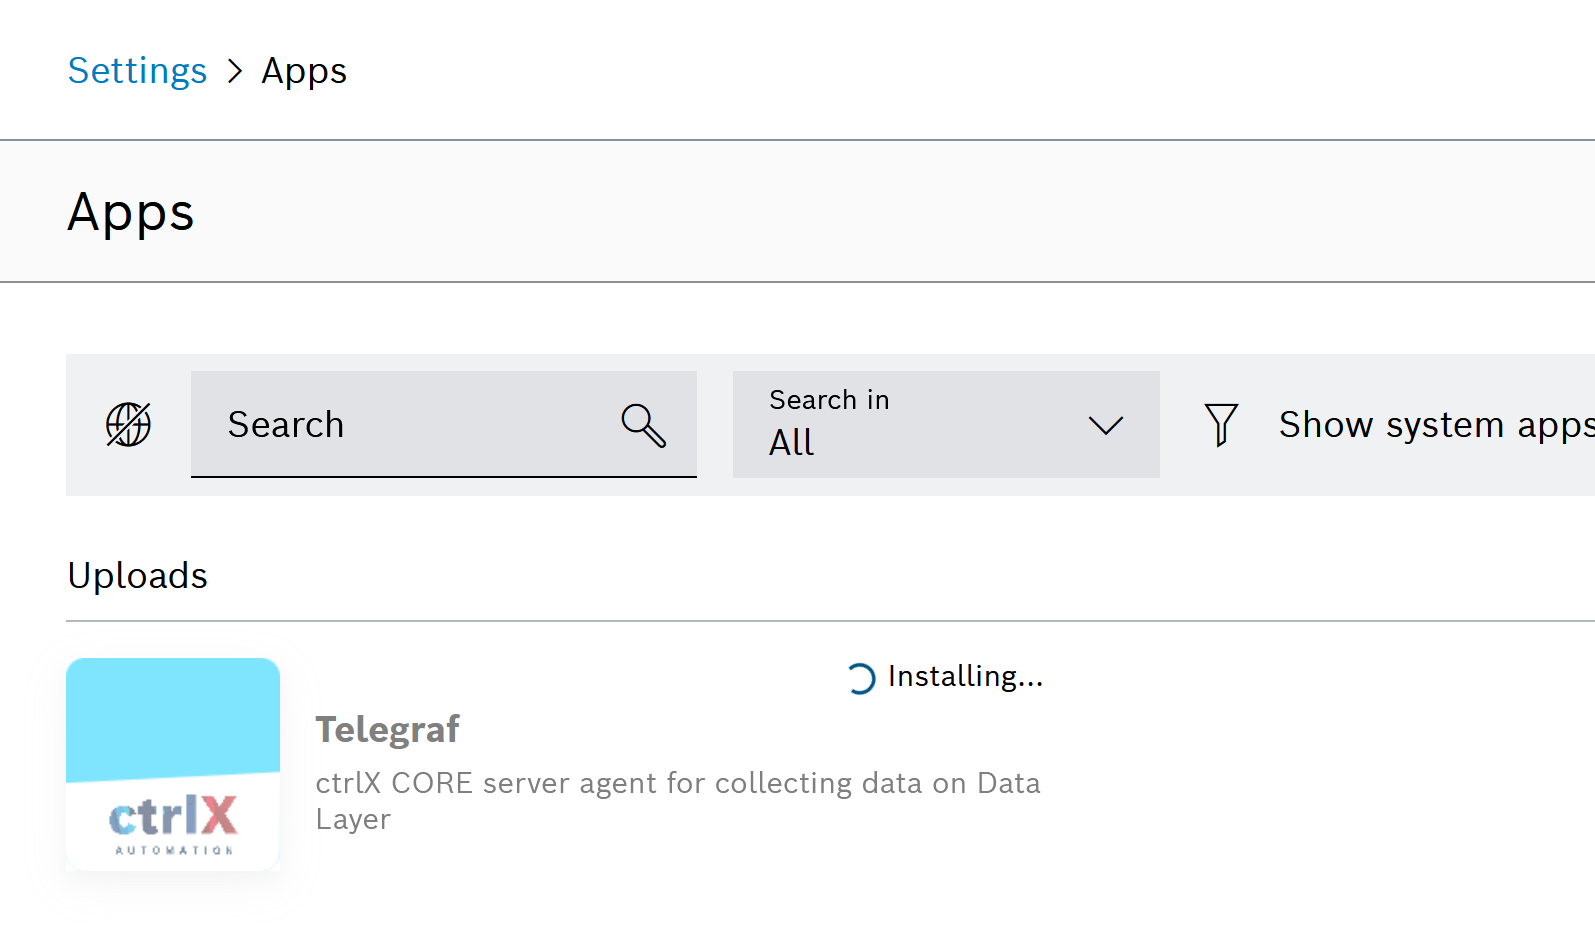
Done!
Reference Link
Implemnetation1
まずはTelegraf APPのConfigurationを作成し、ctrlXの内部UsageをInfluxDBに送信します。

ctrlXのWeb serverをアクセスし、右にあるTelegrafをクリックします。
こちらはctrlXのTelgrafのConfiguration画面になります。
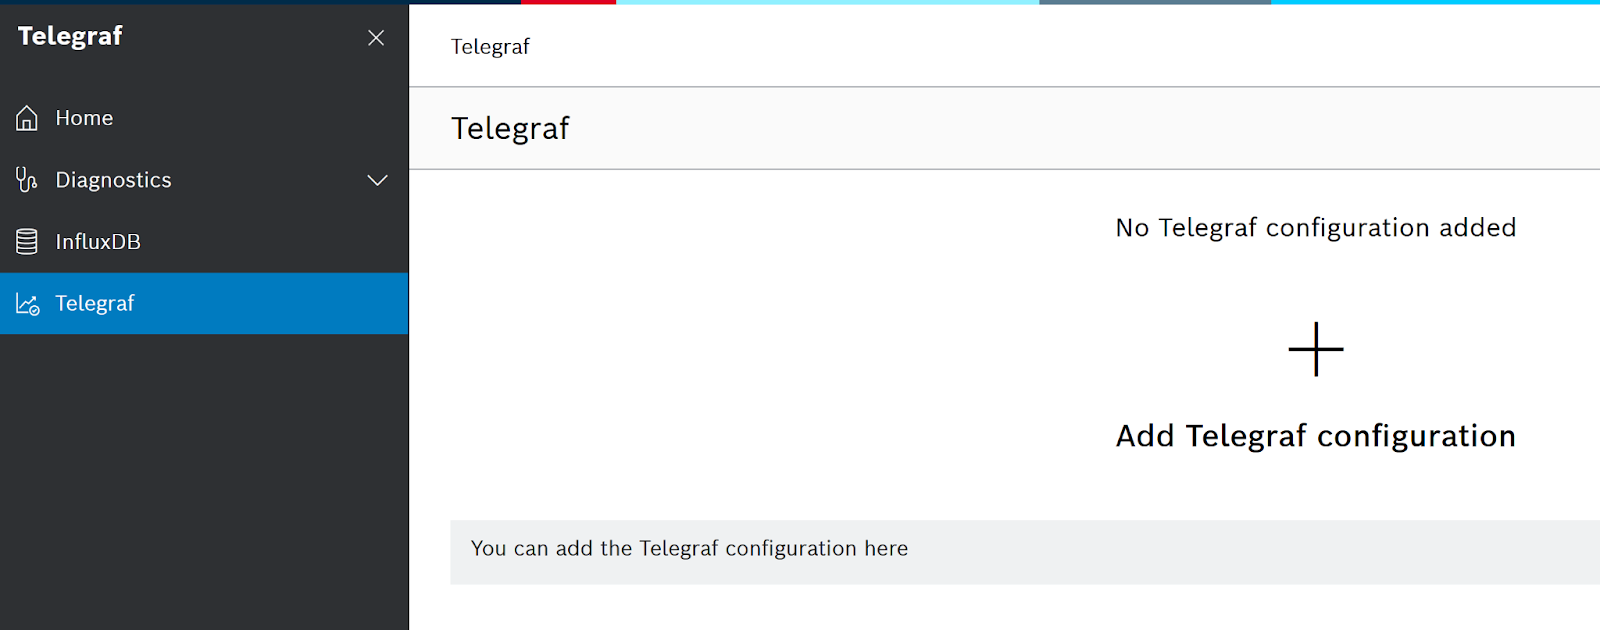
Add Telegraf Configurationをクリックします。
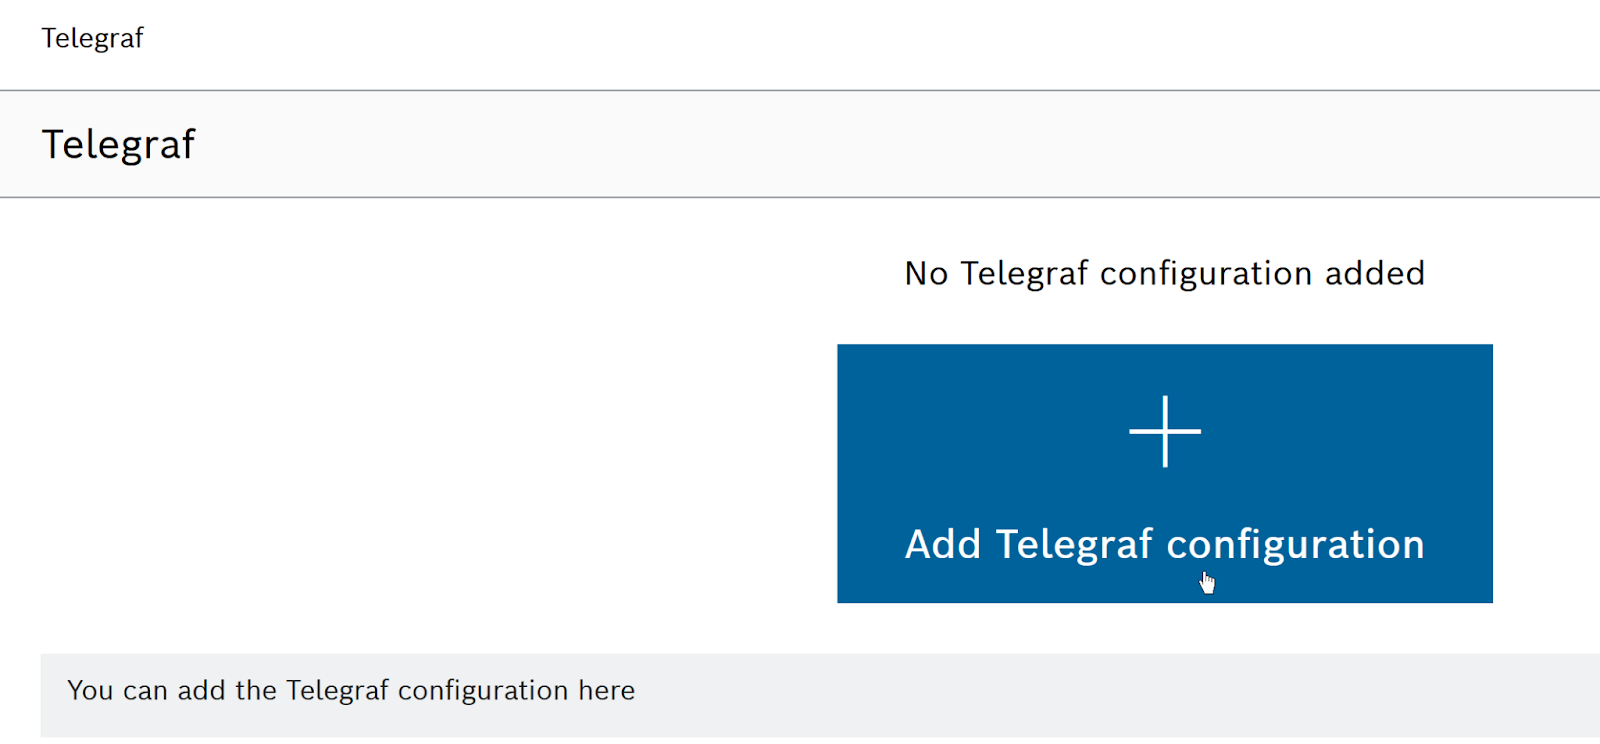
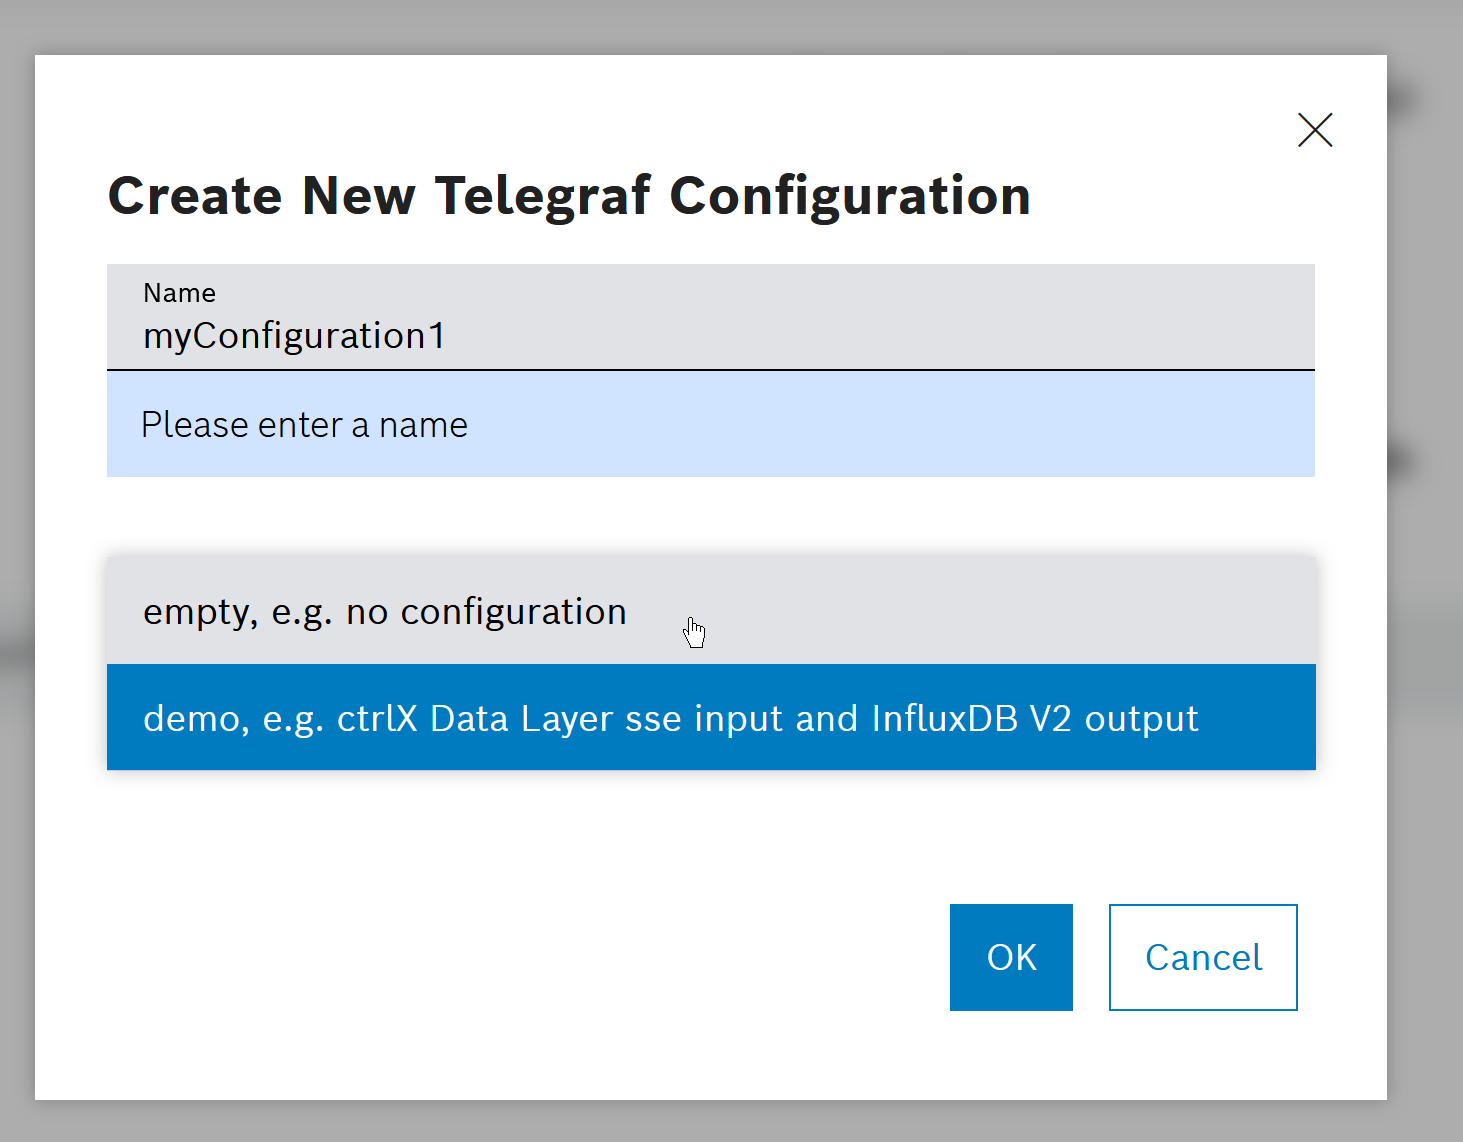
Telegrafの新規作成画面が表示されています。
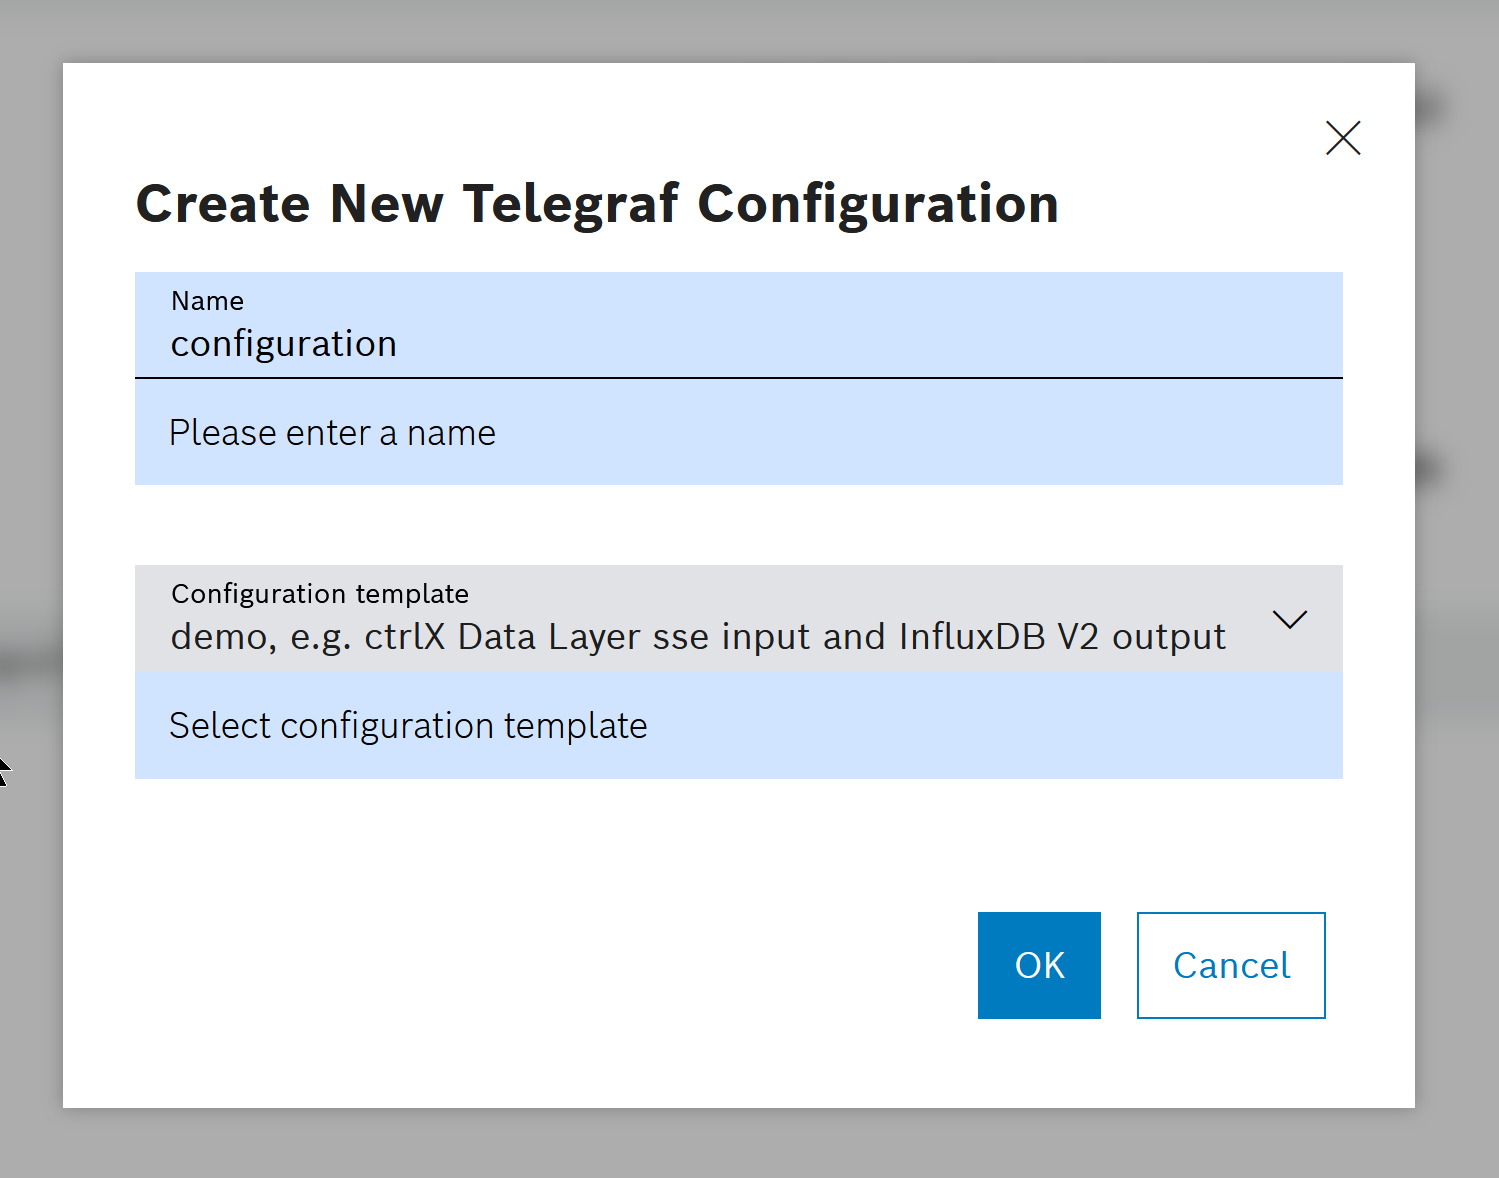
Configuration名を入力し、demo Configurationを選び>Okで進みます。
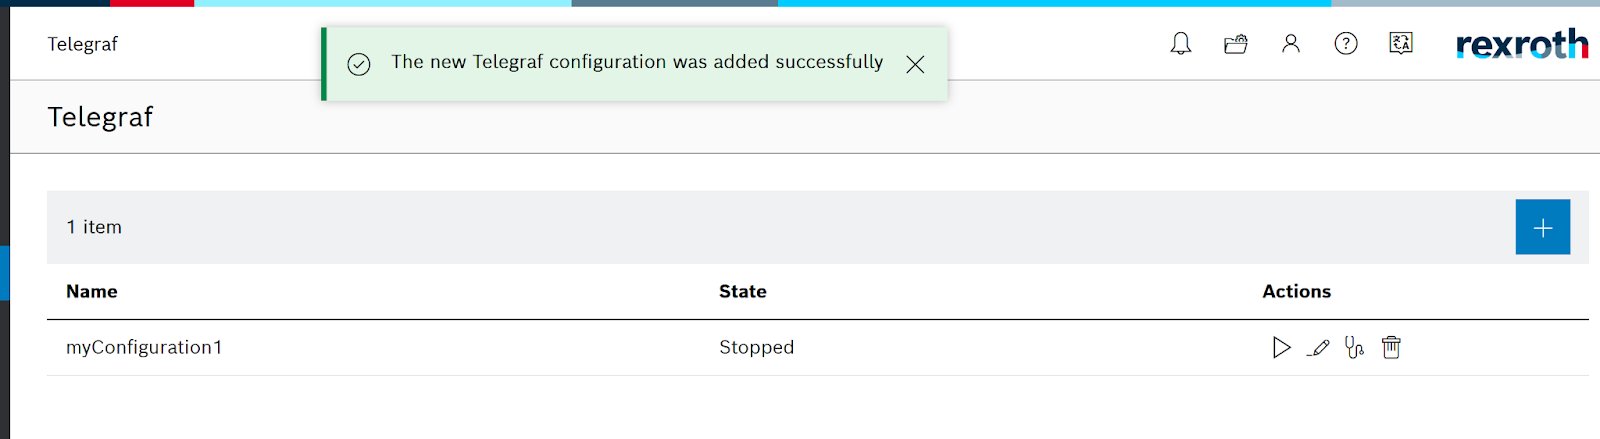
Done!新しいConfigurationが作成しました。
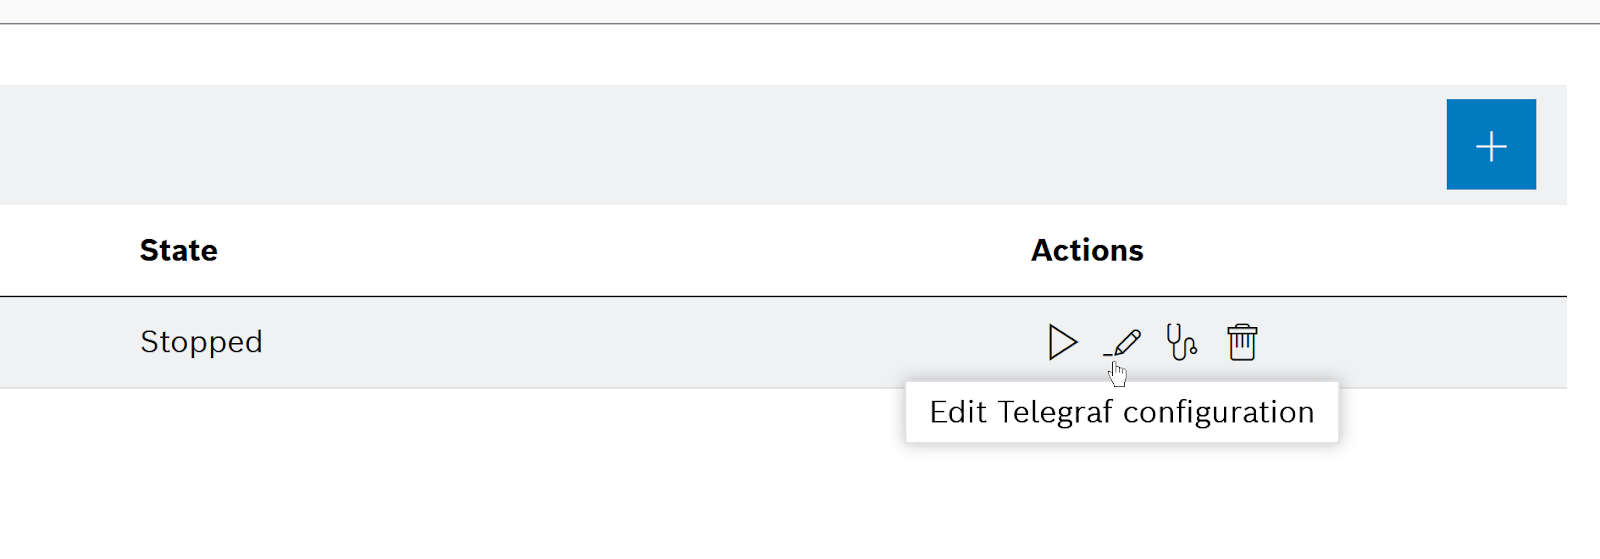
次は鉛筆ICONをクリックしTelegrafのConfiguraiton Fileを修正します。
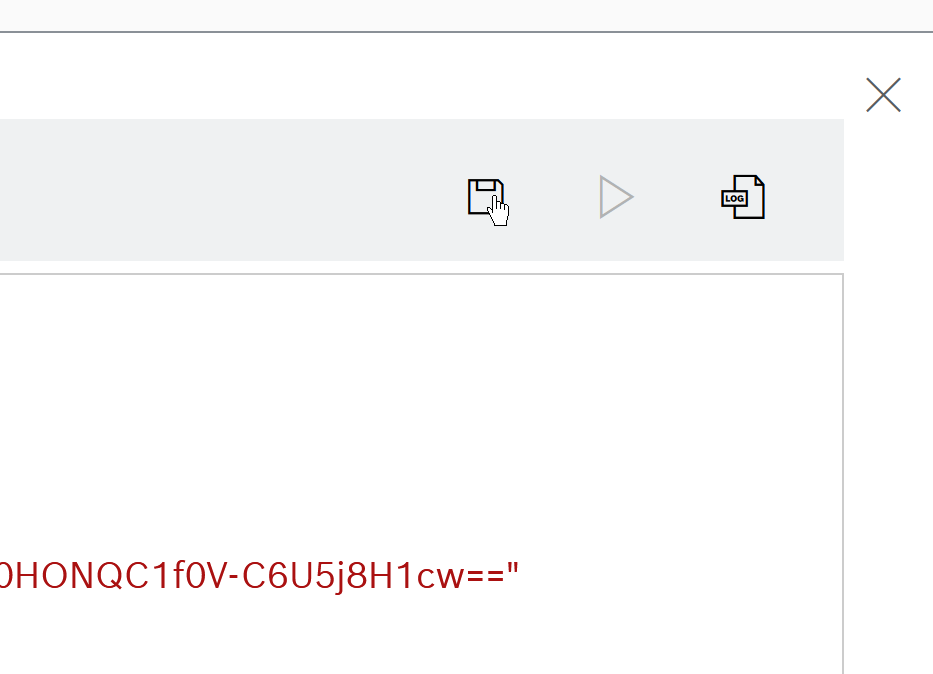
ctrlX内でTelegraf Configuration Fileが表示されました。
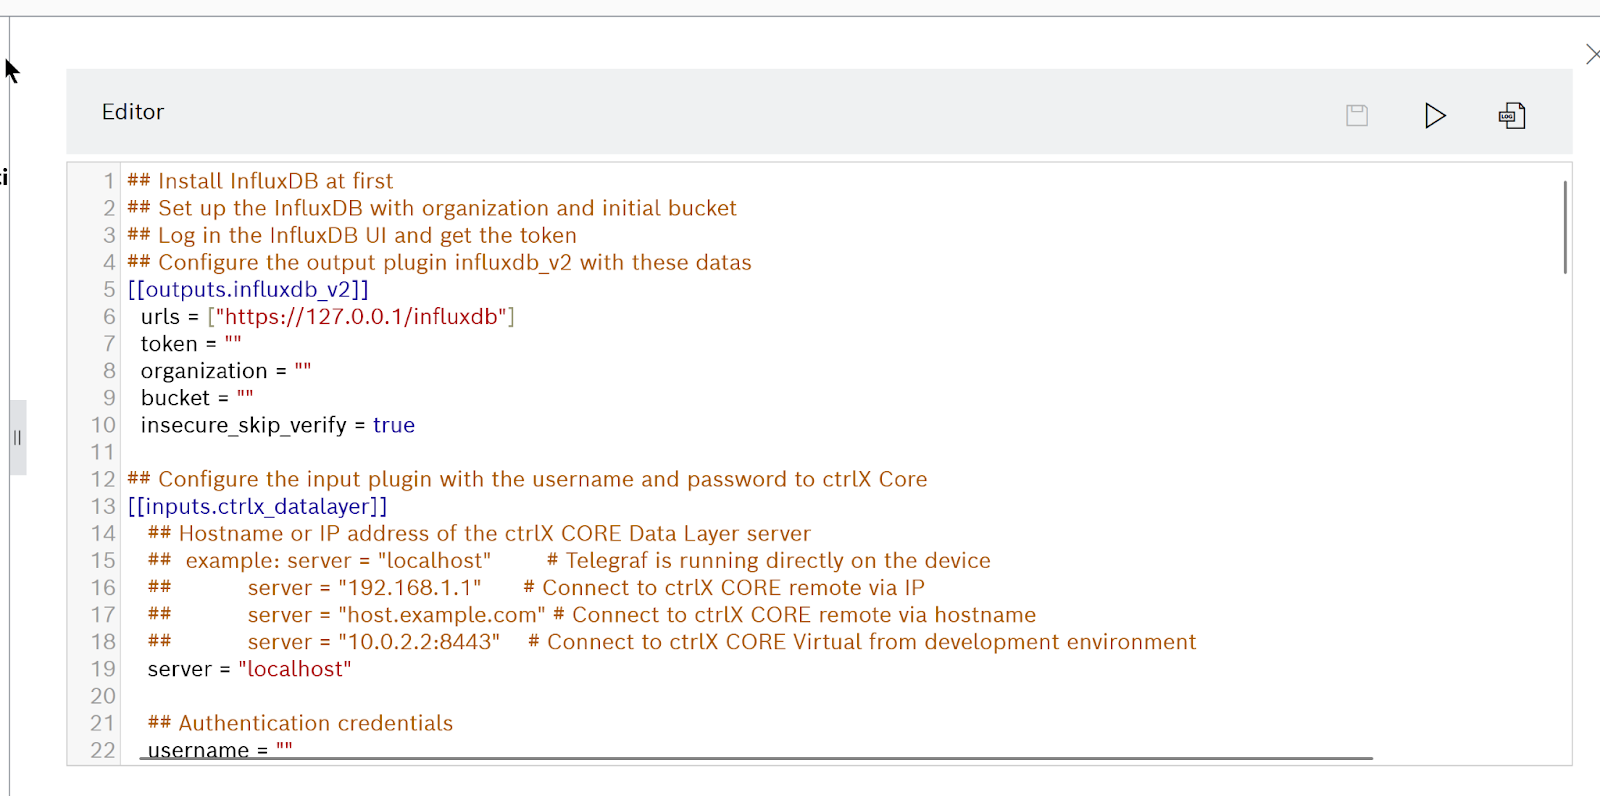
こちらのボタンでConfigurationを保存できます。
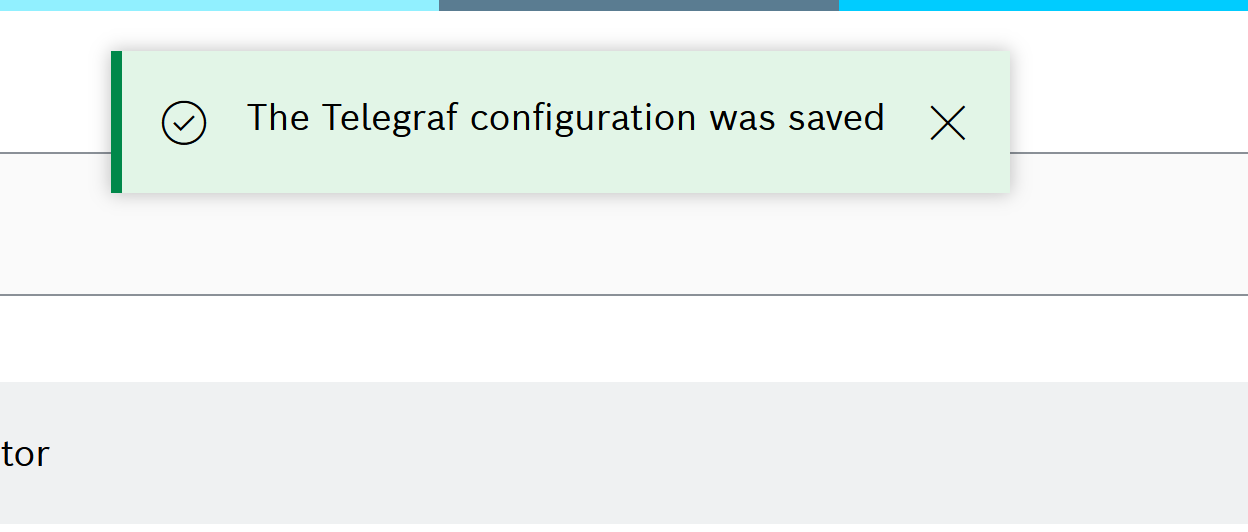
Done!
Configuration File
こちらはImplementation1のTelegraf Configuration画面です。
| [agent] interval = “5s” round_interval = true flush_interval = “5s” ## Install InfluxDB at first ## Set up the InfluxDB with organization and initial bucket ## Log in the InfluxDB UI and get the token ## Configure the output plugin influxdb_v2 with these datas [[outputs.influxdb_v2]] urls = [“https://127.0.0.1/influxdb”] token = “CquPrz9Vmbx-QgvMqGJgMVdHADDkjVAKZELRcANRKqWXRr-nxKQfVEGesQz6gad5GNV1neHdSMKfkd5eb5urkA==” organization = “mana” bucket = “mainBucket” insecure_skip_verify = true ## Configure the input plugin with the username and password to ctrlX Core [[inputs.ctrlx_datalayer]] ## Hostname or IP address of the ctrlX CORE Data Layer server ## example: server = “localhost” # Telegraf is running directly on the device ## server = “192.168.1.1” # Connect to ctrlX CORE remote via IP ## server = “host.example.com” # Connect to ctrlX CORE remote via hostname ## server = “10.0.2.2:8443” # Connect to ctrlX CORE Virtual from development environment server = “192.168.5.67:8443” ## Authentication credentials username = “boschrexroth” password = “boschrexroth” ## Use TLS but skip chain & host verification insecure_skip_verify = true ## Timeout for HTTP requests. (default: “10s”) # timeout = “10s” ## Create a ctrlX Data Layer subscription. ## It is possible to define multiple subscriptions per host. Each subscription can have its own ## sampling properties and a list of nodes to subscribe to. ## All subscriptions share the same credentials. [[inputs.ctrlx_datalayer.subscription]] ## The name of the measurement. (default: “ctrlx”) measurement = “metrics” ## Configure the ctrlX Data Layer nodes which should be subscribed. ## address – node address in ctrlX Data Layer (mandatory) ## name – field name to use in the output (optional, default: base name of address) ## tags – extra node tags to be added to the output metric (optional) ## Note: ## Use either the inline notation or the bracketed notation, not both. ## The tags property is only supported in bracketed notation due to toml parser restrictions ## Examples: ## Inline notation nodes=[ {name=”cpu_usage_percent”, address=”framework/metrics/system/cpu-utilisation-percent”}, ] ## Bracketed notation # [[inputs.ctrlx_datalayer.subscription.nodes]] # name =”available” # address=”framework/metrics/system/memavailable-mb” # ## Define extra tags related to node to be added to the output metric (optional) # [inputs.ctrlx_datalayer.subscription.nodes.tags] # node_tag1=”node_tag1″ # node_tag2=”node_tag2″ # [[inputs.ctrlx_datalayer.subscription.nodes]] # name =”used” # address=”framework/metrics/system/memused-mb” ## The switch “output_json_string” enables output of the measurement as json. ## That way it can be used in in a subsequent processor plugin, e.g. “Starlark Processor Plugin”. # output_json_string = false ## Define extra tags related to subscription to be added to the output metric (optional) # [inputs.ctrlx_datalayer.subscription.tags] # subscription_tag1 = “subscription_tag1” # subscription_tag2 = “subscription_tag2” ## The interval in which messages shall be sent by the ctrlX Data Layer to this plugin. (default: 1s) ## Higher values reduce load on network by queuing samples on server side and sending as a single TCP packet. #publish_interval = “1s” ## The interval a “keepalive” message is sent if no change of data occurs. (default: 60s) ## Only used internally to detect broken network connections. # keep_alive_interval = “60s” ## The interval an “error” message is sent if an error was received from a node. (default: 10s) ## Higher values reduce load on output target and network in case of errors by limiting frequency of error messages. # error_interval = “10s” ## The interval that defines the fastest rate at which the node values should be sampled and values captured. (default: 1s) ## The sampling frequency should be adjusted to the dynamics of the signal to be sampled. ## Higher sampling frequence increases load on ctrlX Data Layer. ## The sampling frequency can be higher, than the publish interval. Captured samples are put in a queue and sent in publish interval. ## Note: The minimum sampling interval can be overruled by a global setting in the ctrlX Data Layer configuration (‘datalayer/subscriptions/settings’). #sampling_interval = “1s” ## The requested size of the node value queue. (default: 10) ## Relevant if more values are captured than can be sent. # queue_size = 10 ## The behaviour of the queue if it is full. (default: “DiscardOldest”) ## Possible values: ## – “DiscardOldest” ## The oldest value gets deleted from the queue when it is full. ## – “DiscardNewest” ## The newest value gets deleted from the queue when it is full. # queue_behaviour = “DiscardOldest” ## The filter when a new value will be sampled. (default: 0.0) ## Calculation rule: If (abs(lastCapturedValue – newValue) > dead_band_value) capture(newValue). # dead_band_value = 0.0 ## The conditions on which a sample should be captured and thus will be sent as a message. (default: “StatusValue”) ## Possible values: ## – “Status” ## Capture the value only, when the state of the node changes from or to error state. Value changes are ignored. ## – “StatusValue” ## Capture when the value changes or the node changes from or to error state. ## See also ‘dead_band_value’ for what is considered as a value change. ## – “StatusValueTimestamp”: ## Capture even if the value is the same, but the timestamp of the value is newer. ## Note: This might lead to high load on the network because every sample will be sent as a message ## even if the value of the node did not change. # value_change = “StatusValue” |
[[outputs.influxdb_v2]]
TelegrafとInfluxdbの接続設定を変更します。
| [[outputs.influxdb_v2]] urls = [“https://127.0.0.1/influxdb”] token = “CquPrz9Vmbx-QgvMqGJgMVdHADDkjVAKZELRcANRKqWXRr-nxKQfVEGesQz6gad5GNV1neHdSMKfkd5eb5urkA==” organization = “mana” bucket = “mainBucket” insecure_skip_verify = true |
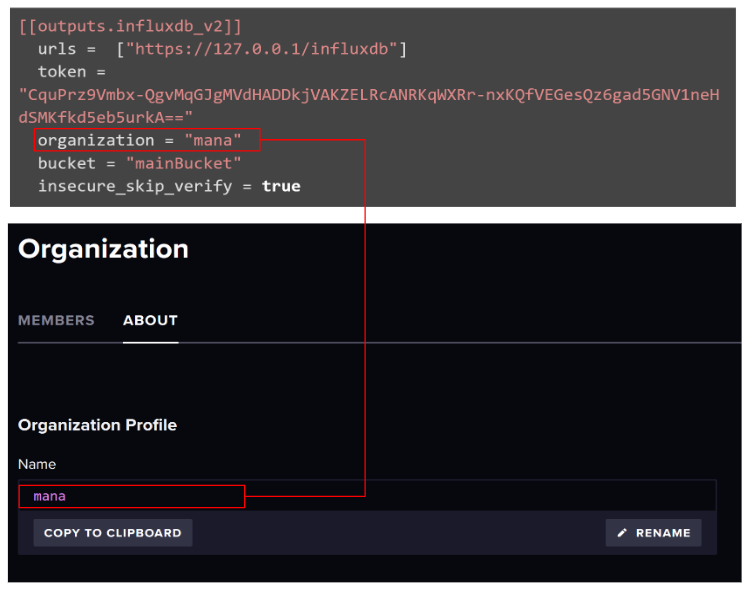
organization
organizationはInfluxDBで設定したものに該当します。
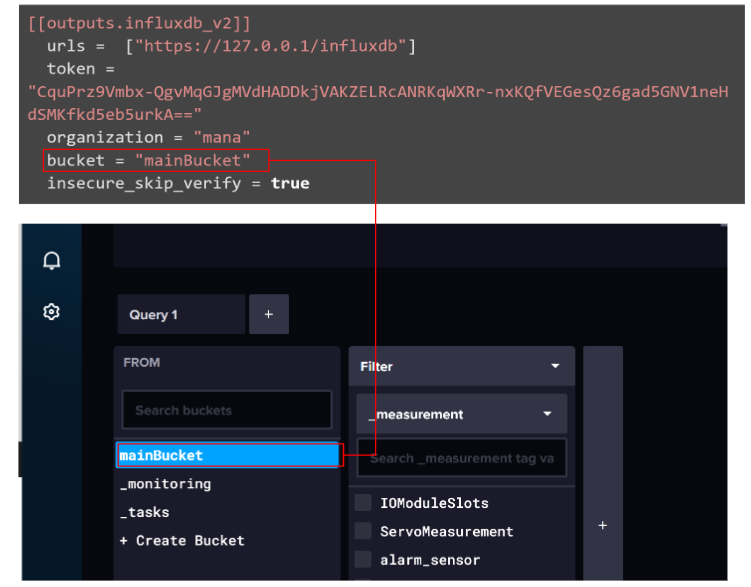
bucket
bucketはDataを保存したいTable名に合わせます。
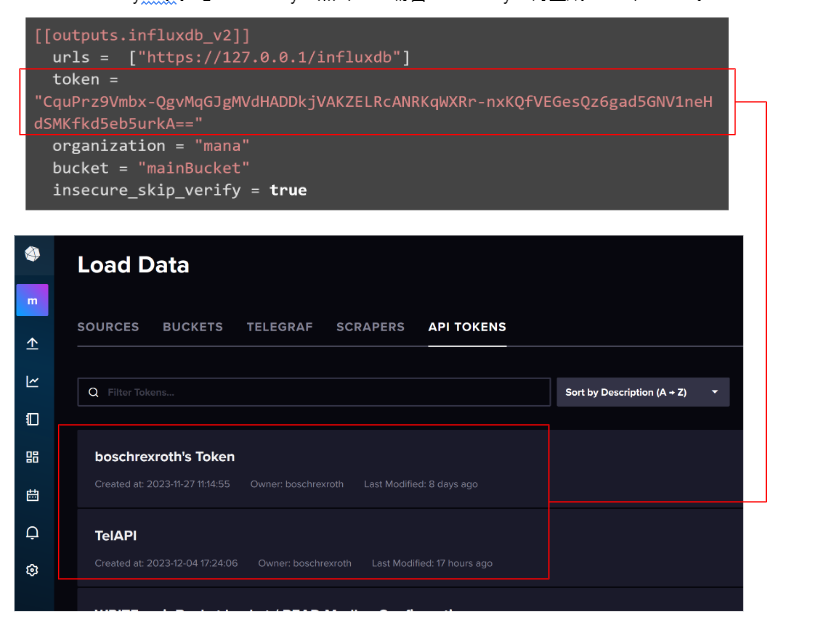
token
tokenはAPI Keyです。もしAPI Keyが無くした場合はAPI Keyを再生成してください。
[[inputs.ctrlx_datalayer]]
次はctrlXと接続するInterfaceを設定します。

server
serverはVirtualCoreのIPアドレスになります。
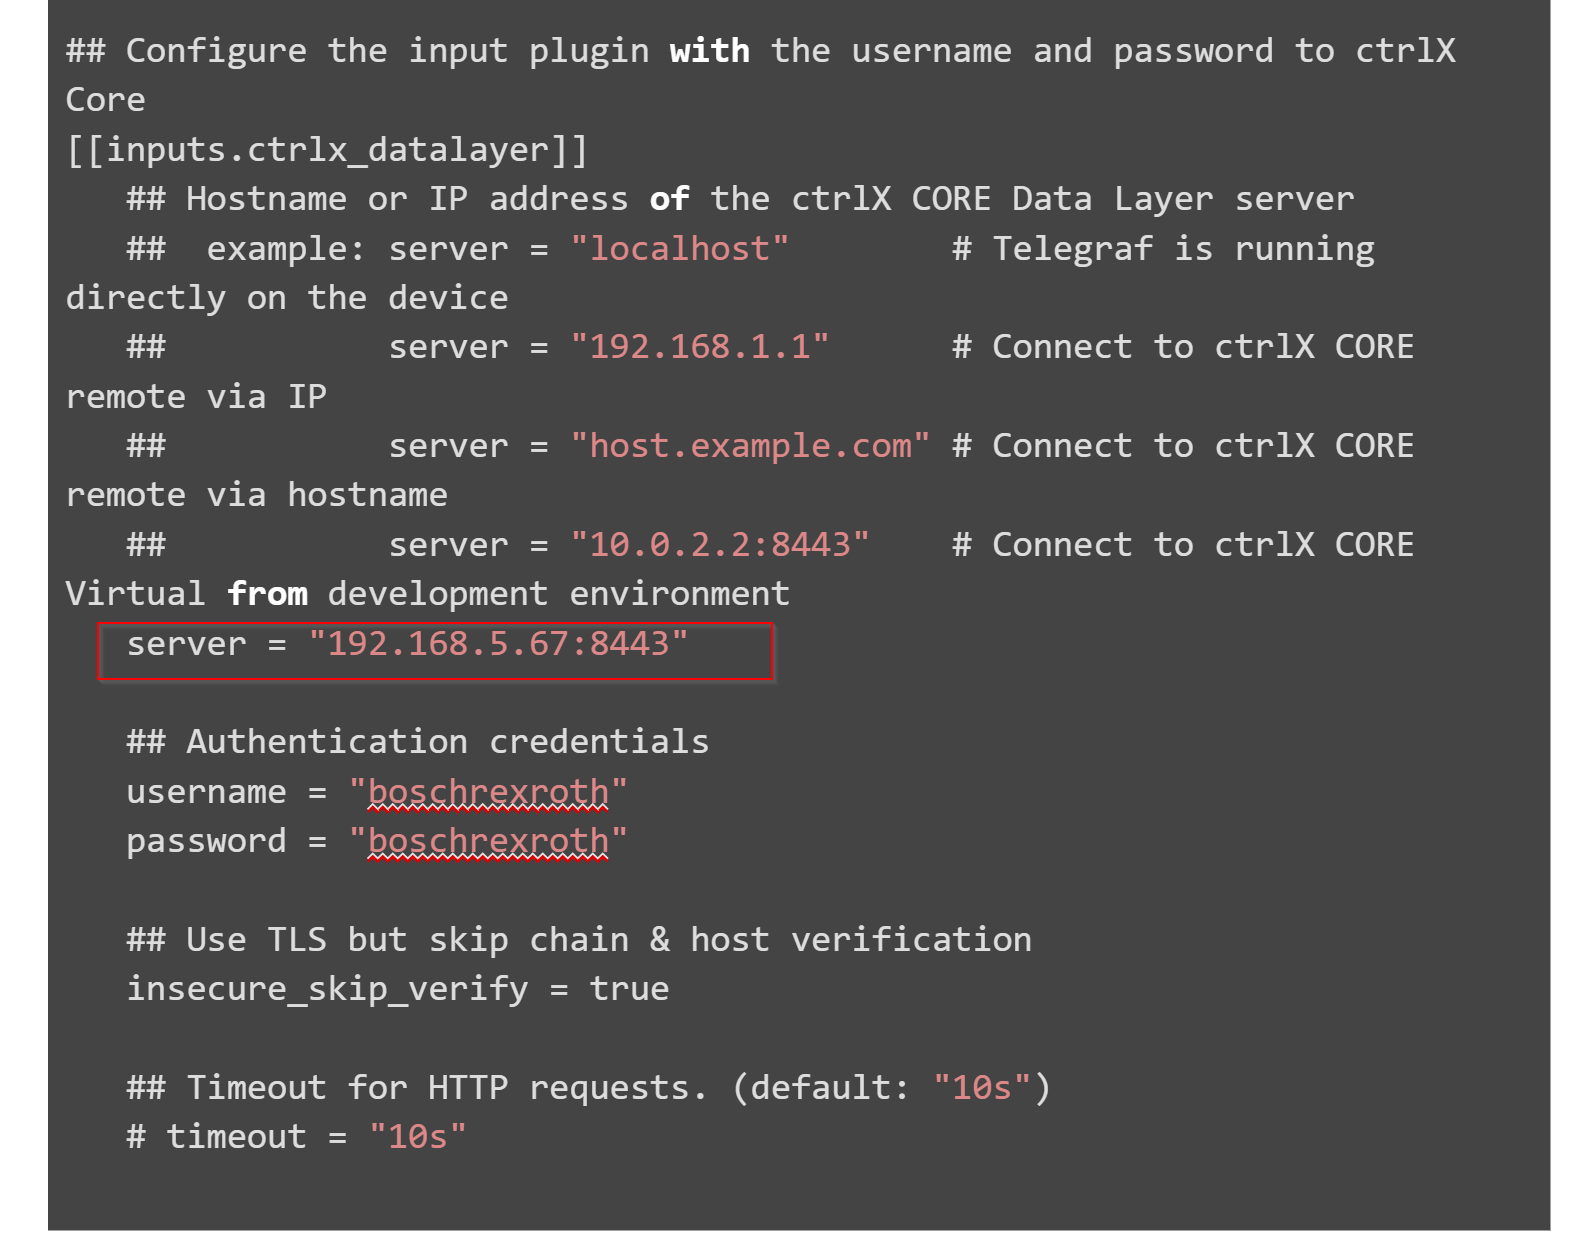
username/passaword
username/passawordはWeb serverで設定したものに入力しましょう。

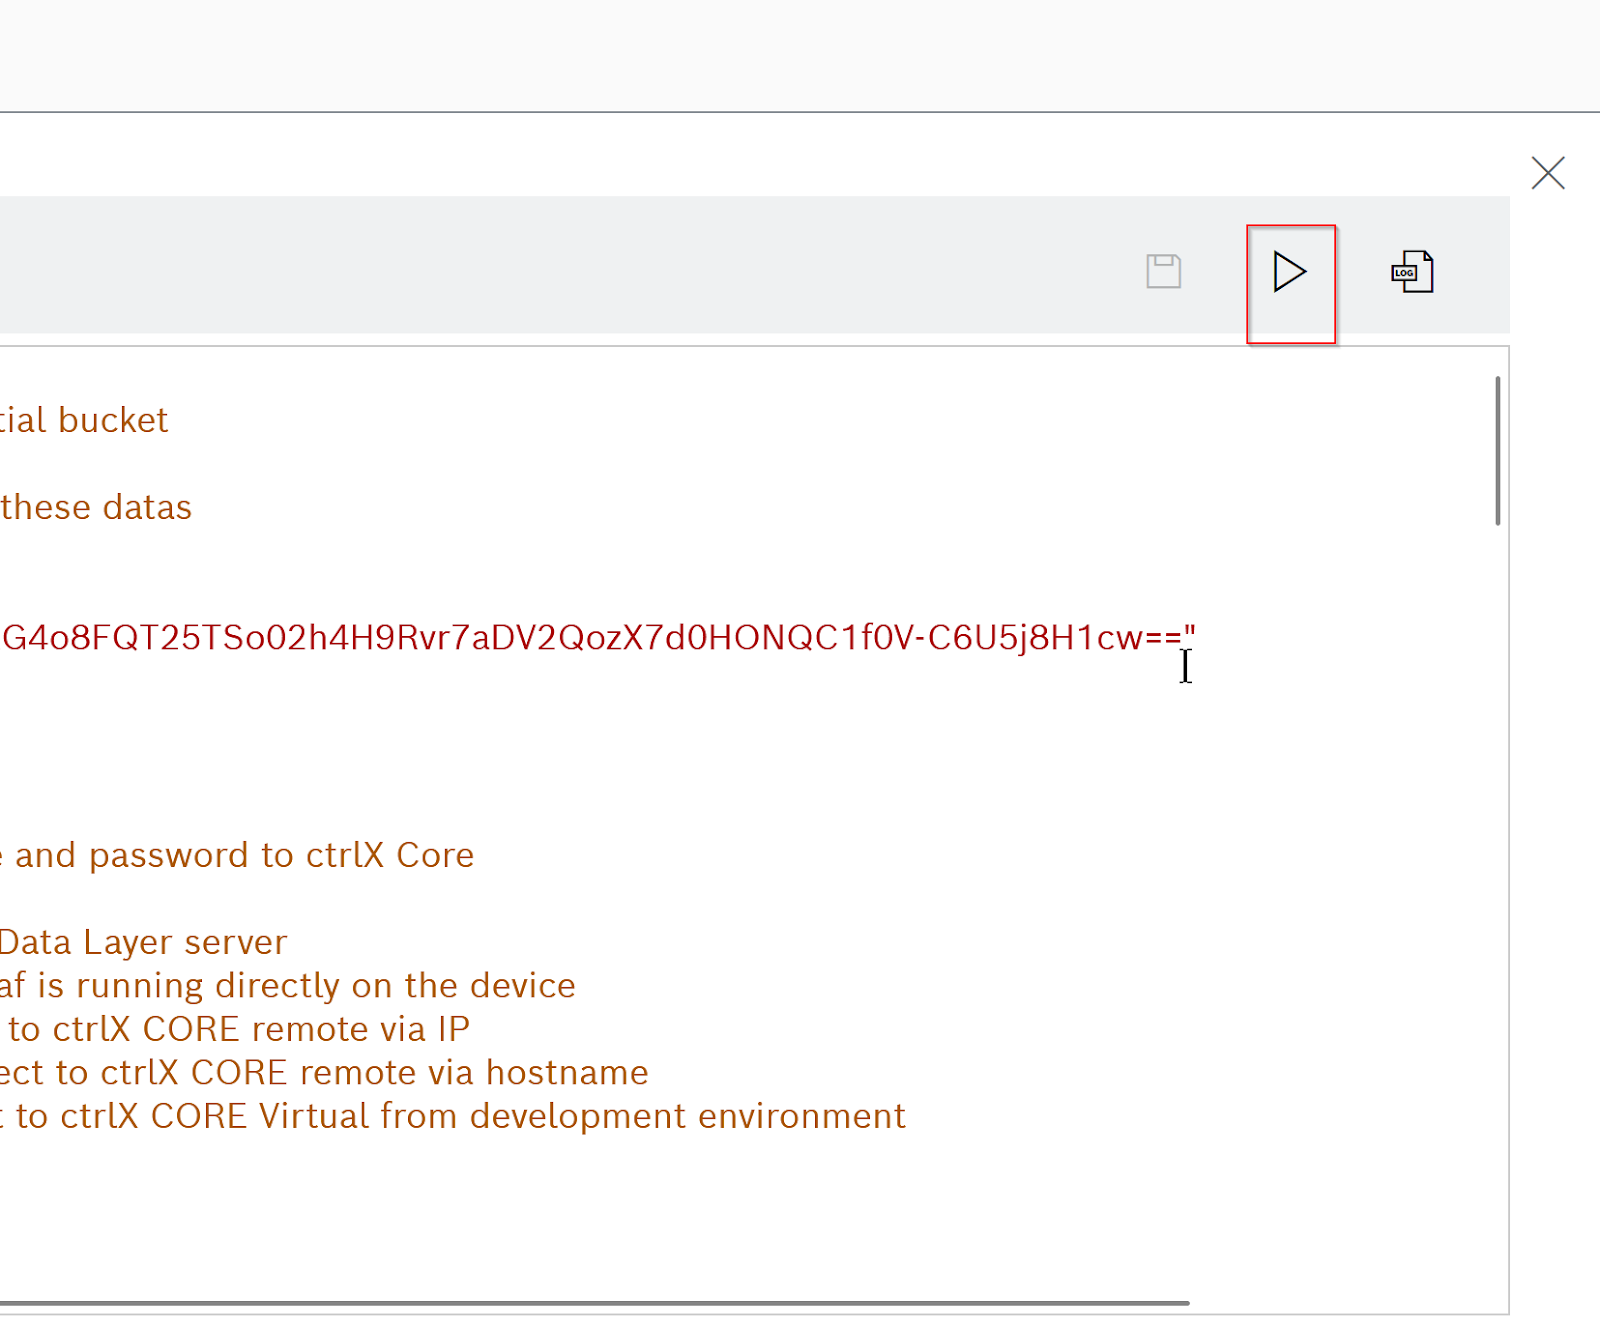
RUN
最後はPlayボタンをクリックしTelegrafを起動しましょう。
しばらくまちます…
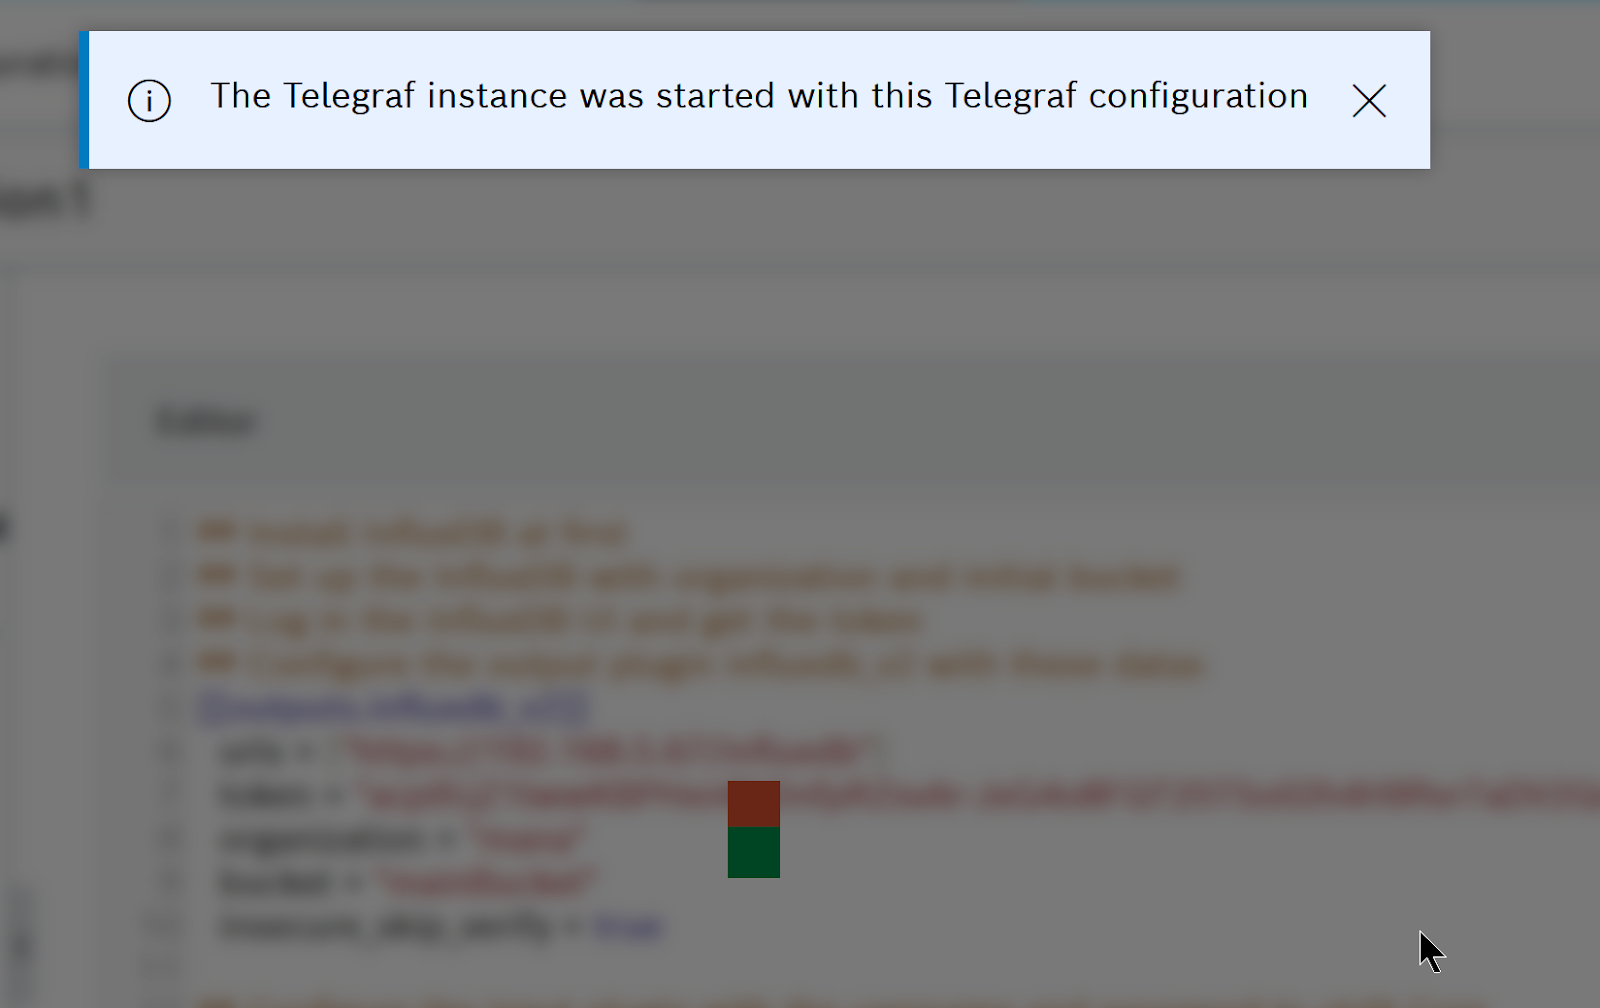
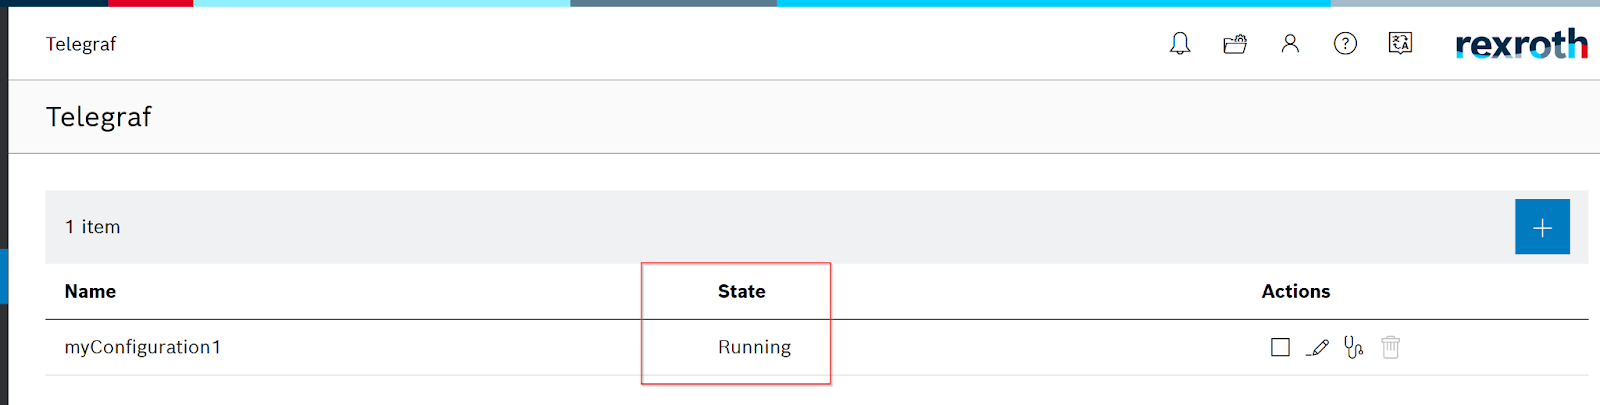
Telegraf ConfigurationのStateはRunningになります。
現在Telegrafの実行状態を確認したい場合、赤枠のICONをクリックしてください。
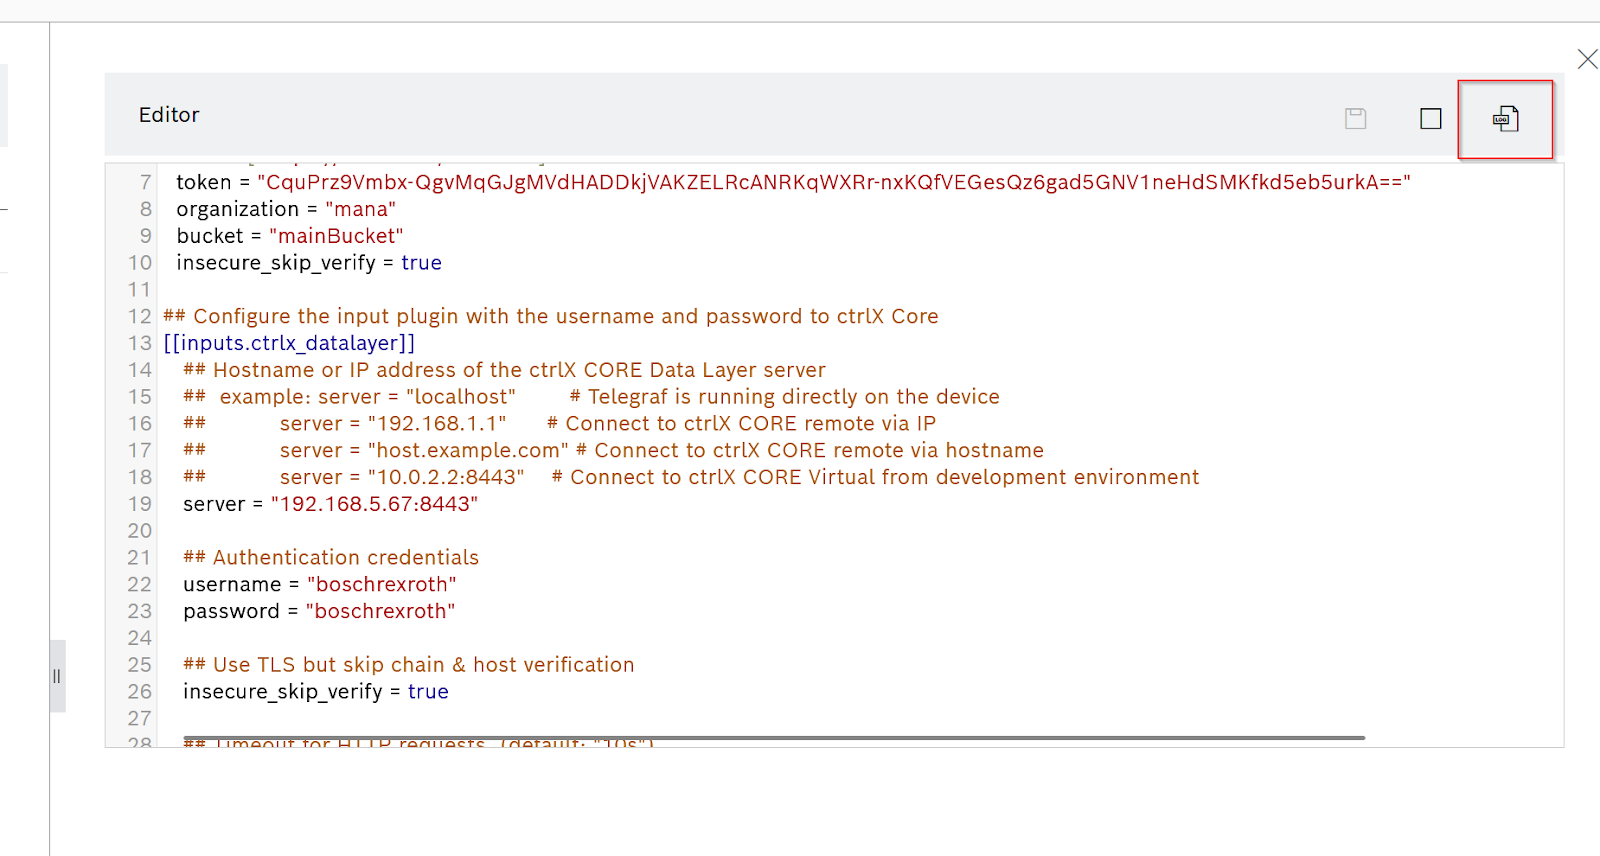
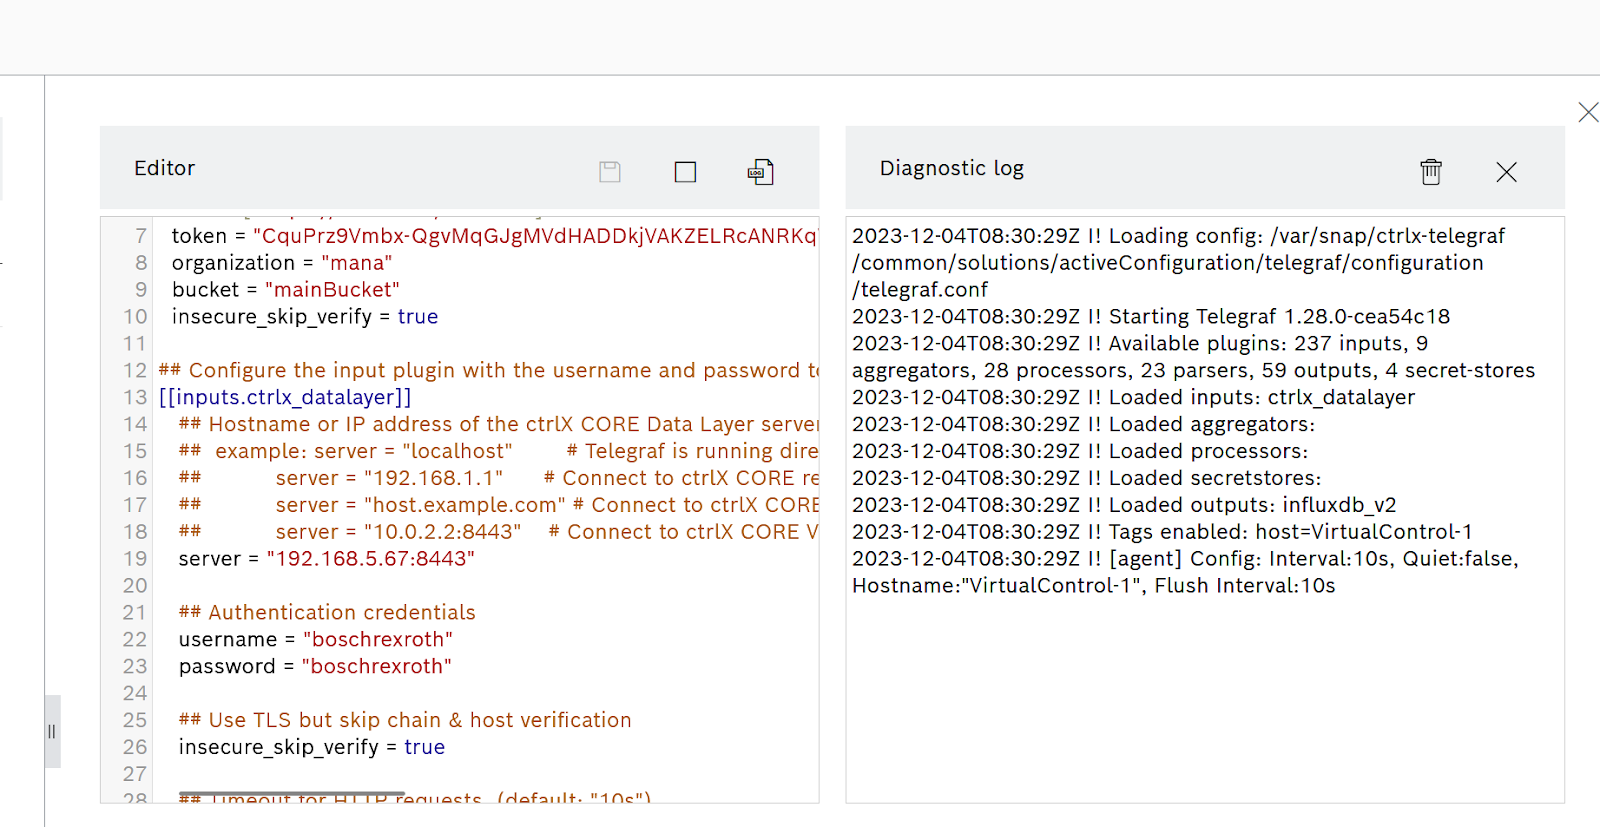
画面が2つに分かれ、Diagnostic logに実行履歴が表示されるようになります。
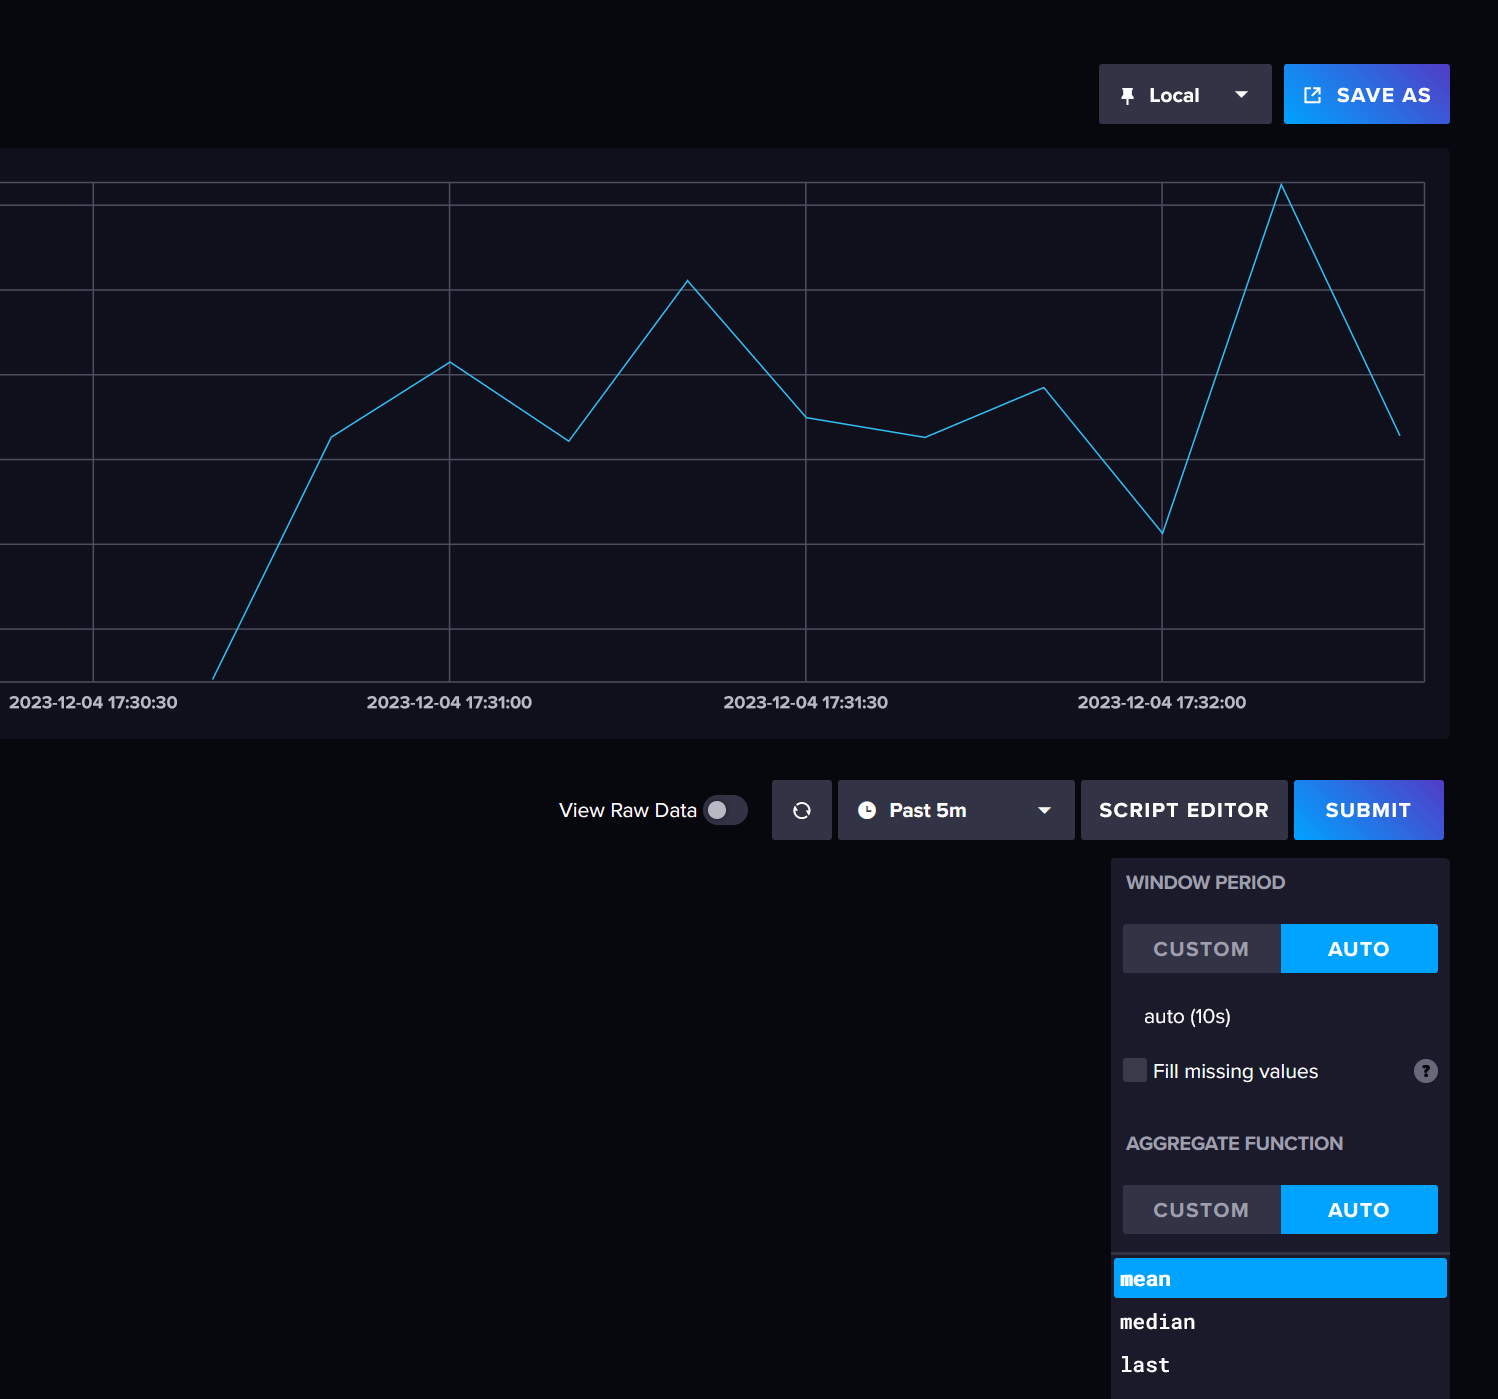
Result
Done!_measurementの中にmetricsがあり、cpu_usage_percnetという_fieldがあります。
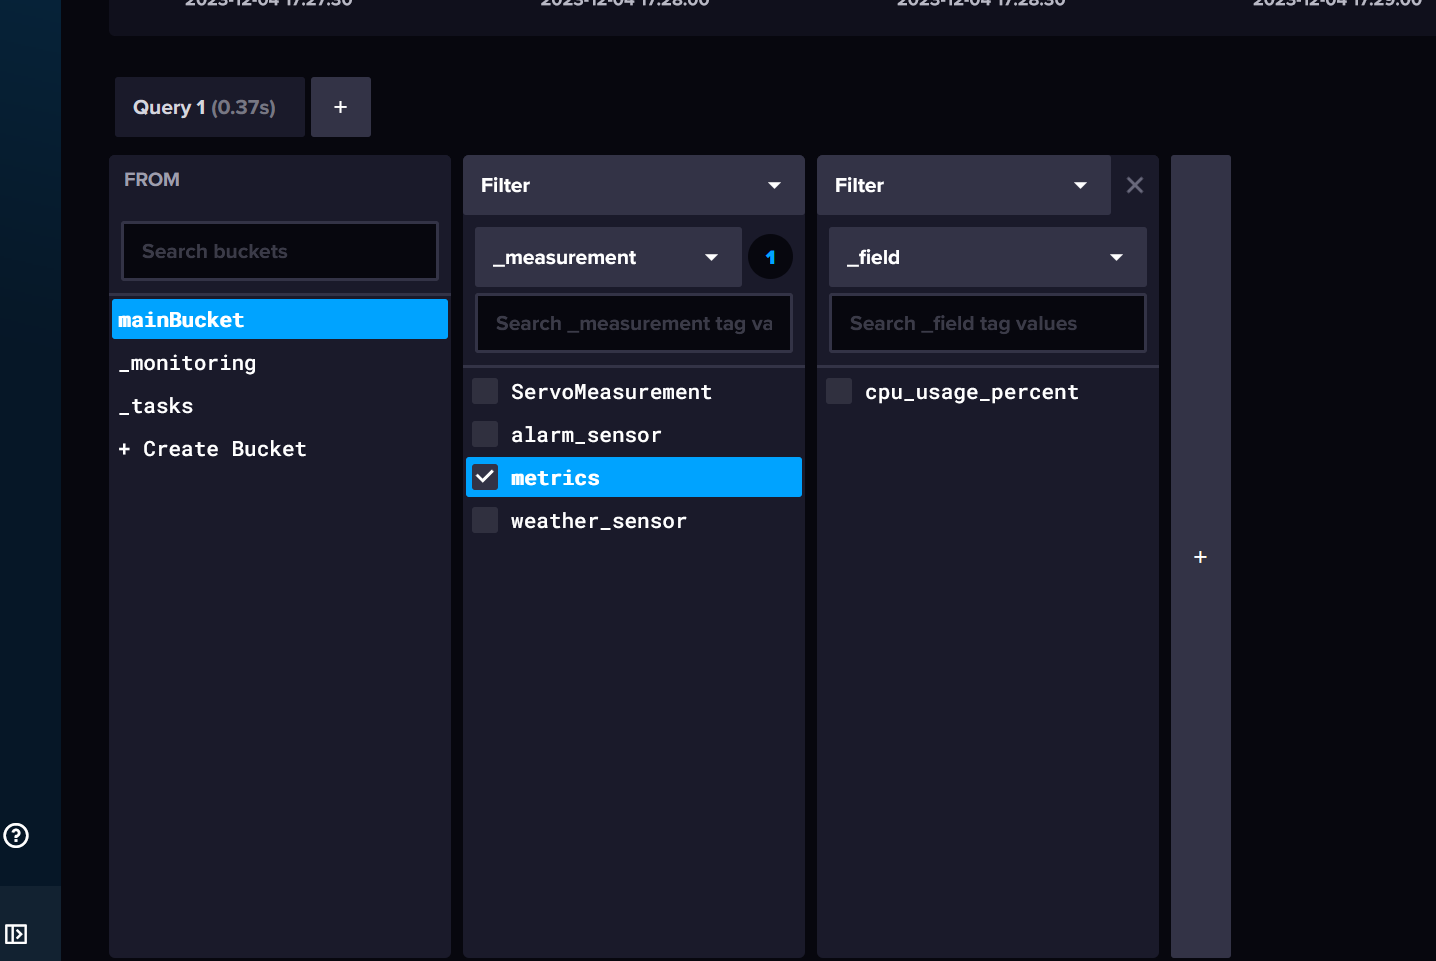
ctrlX VirtualcoreのCPU使用率が見えるようになりました。
Implementation2 OPC-UA Plugin
次はTelegraf APPのConfigurationにOPC UA Plginを追加し、groov EPIC CPUのOPC UA Serverにアクセスし、データをInfluxDBに保存します。

Reference Link
Opto22 Side
先ほどのReference Linkからも詳しい説明がありますが、今回の記事でも簡単な設定紹介だけさせていただきます。
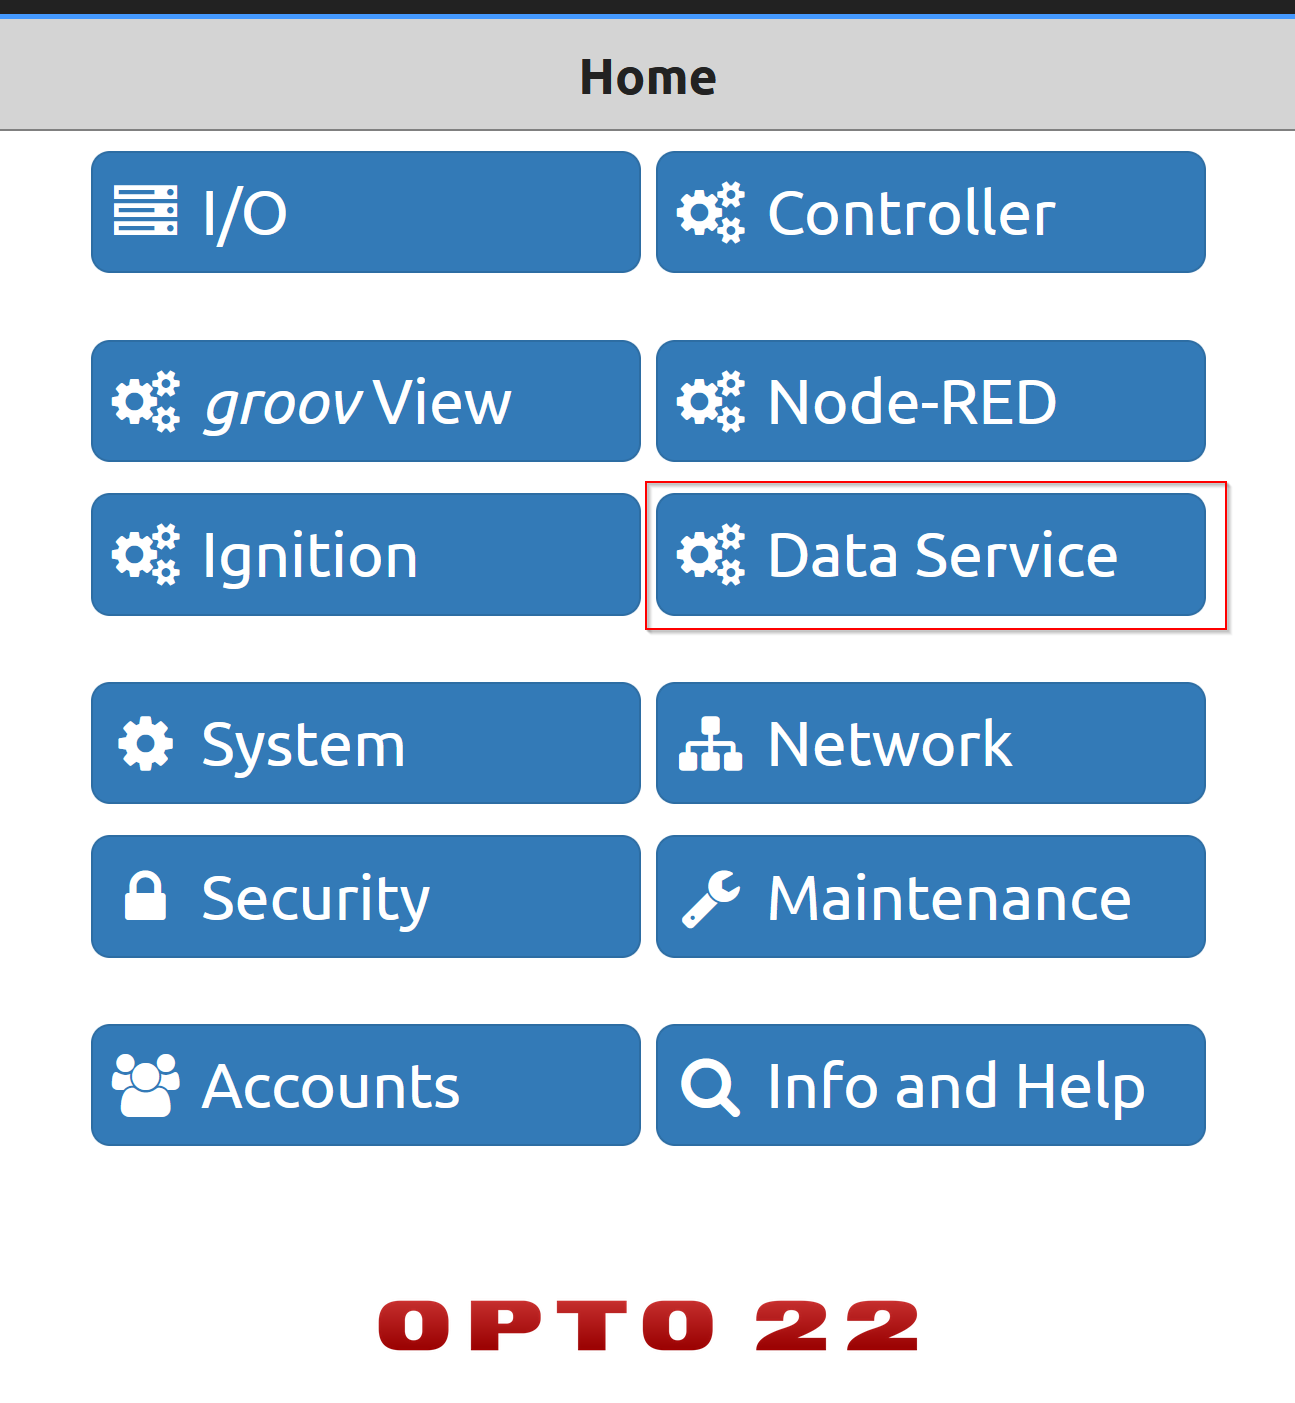
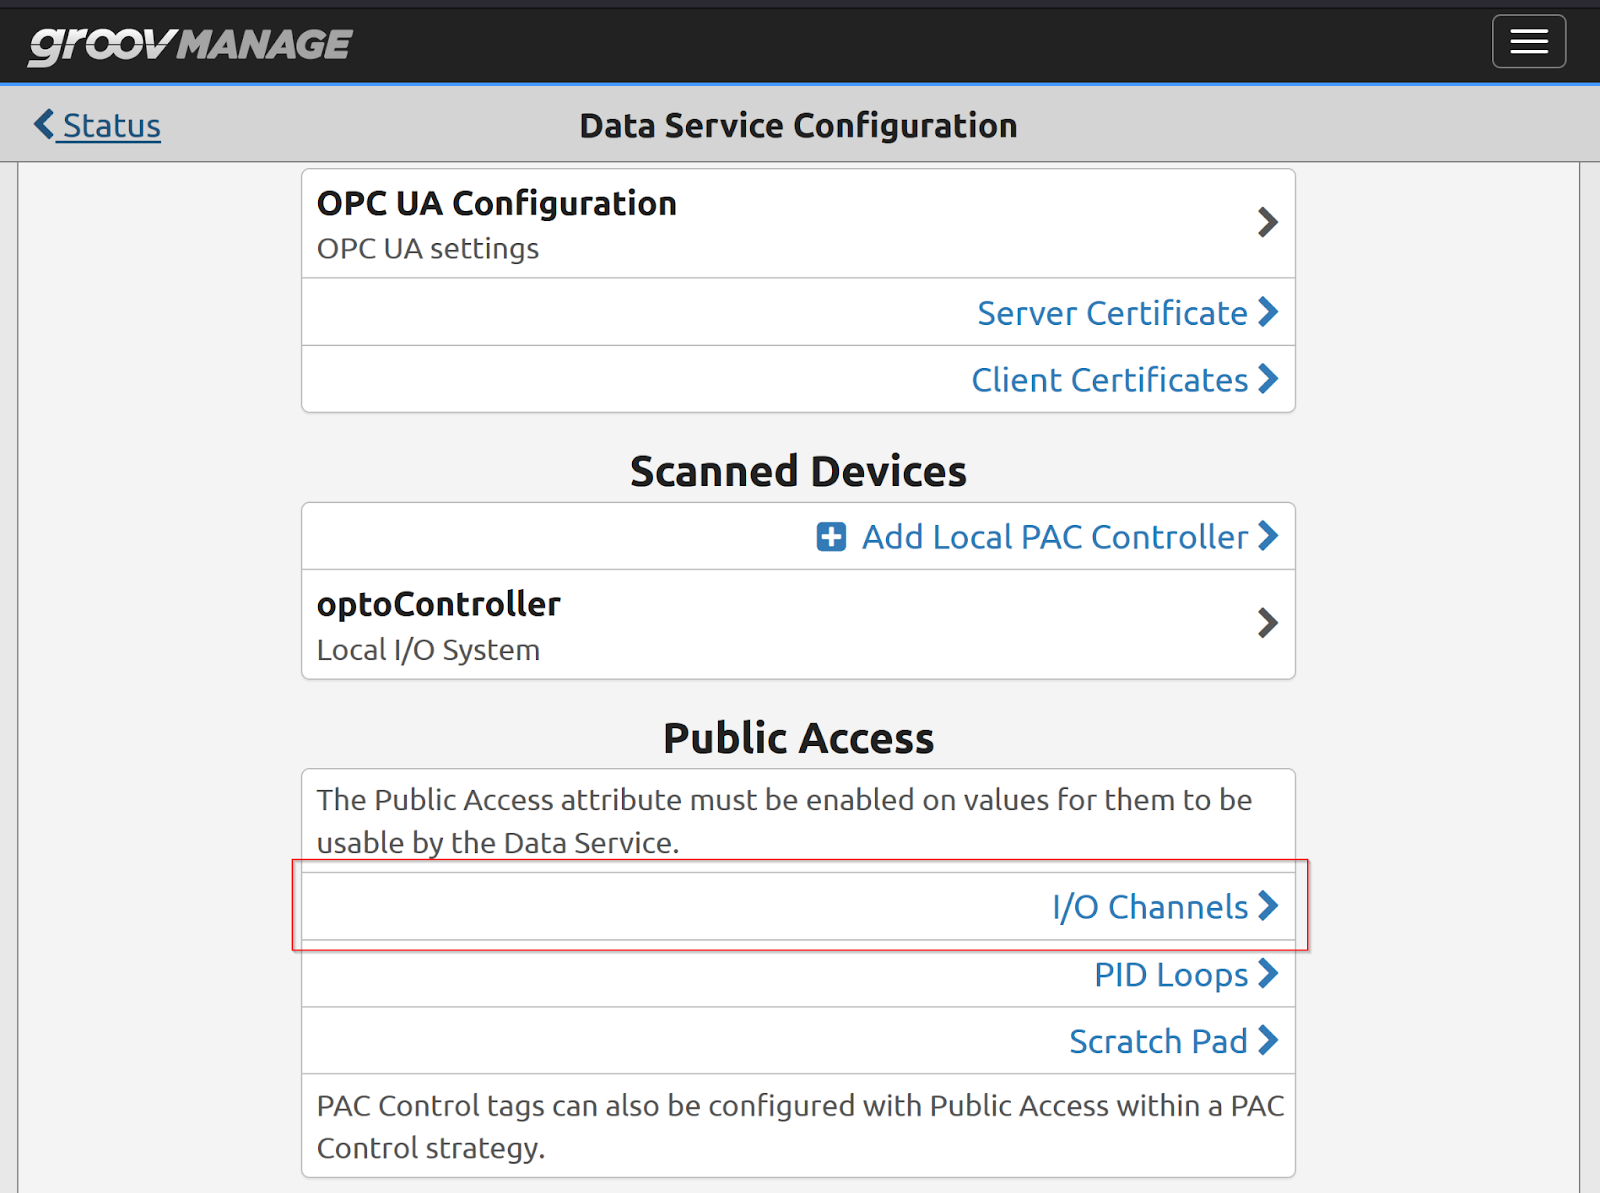
Opto22の中にある”Data Service”をクリックします。
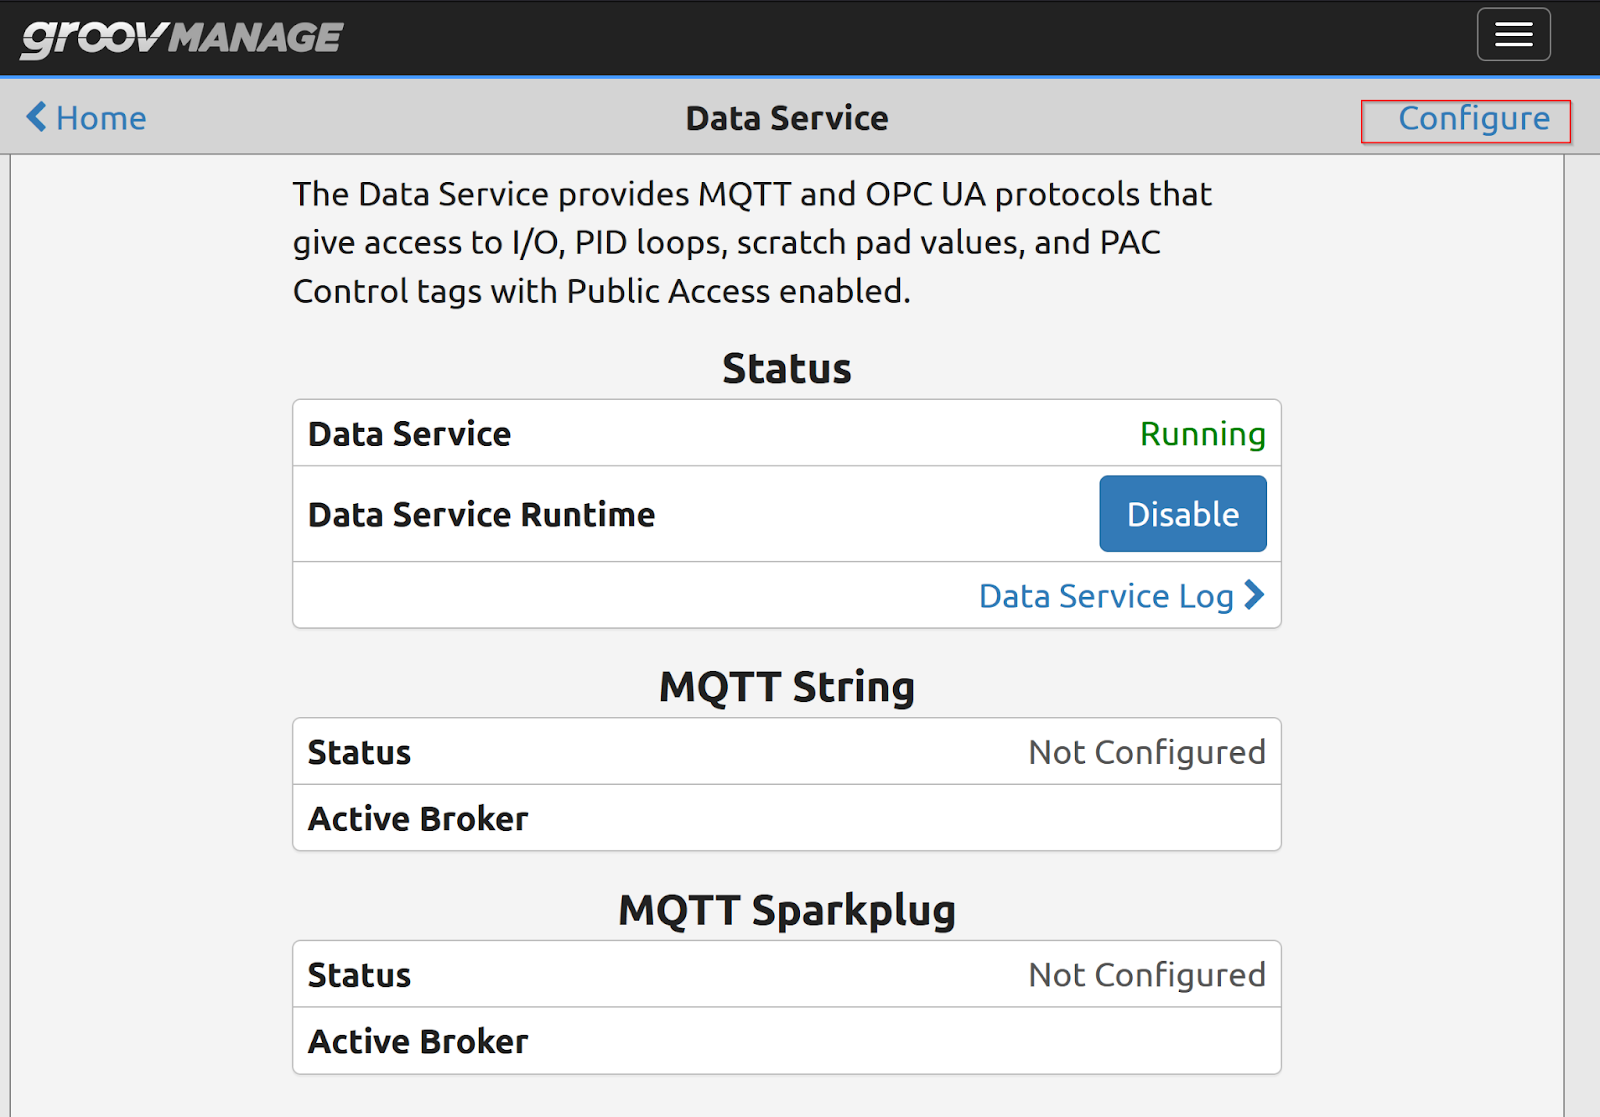
Data Services の画面が表示され、Configuure Buttonをクリックします。
Scanned Devicesの中でLocal I/O System設定を行います。
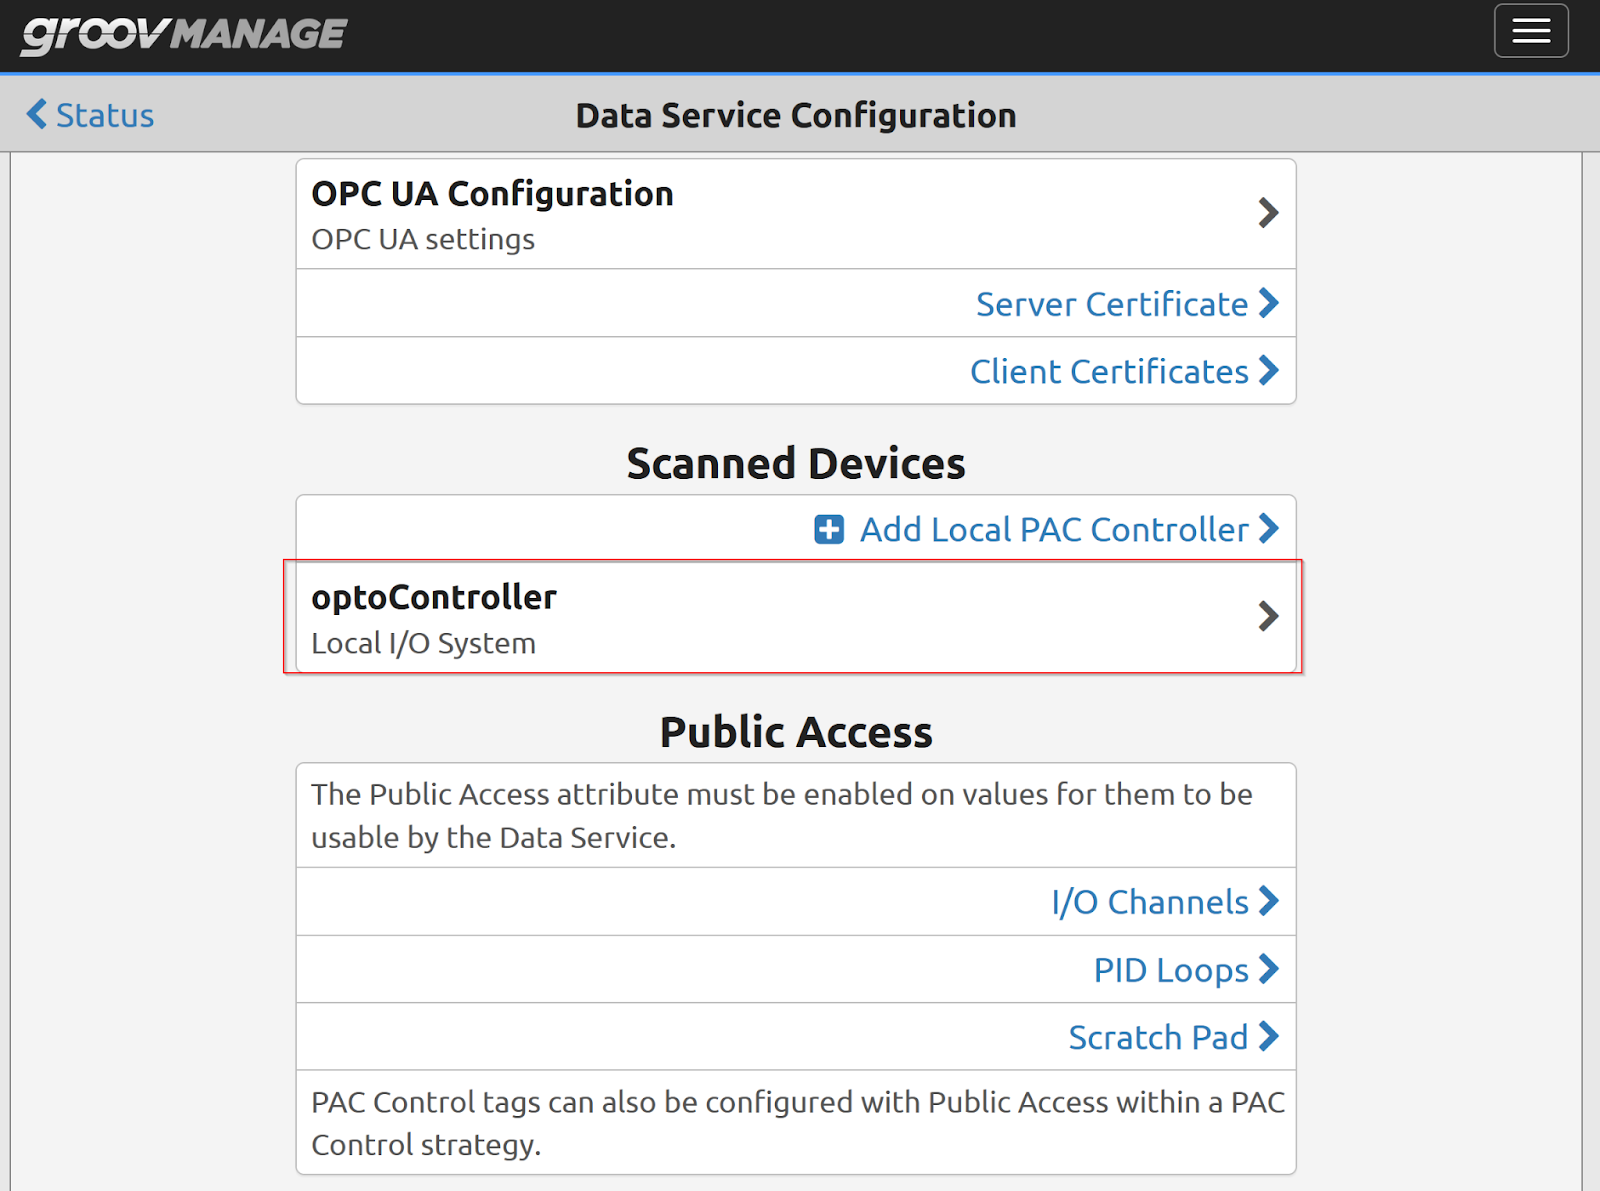
Local I/O SystemのData Servicesが有効であることを確認してください。
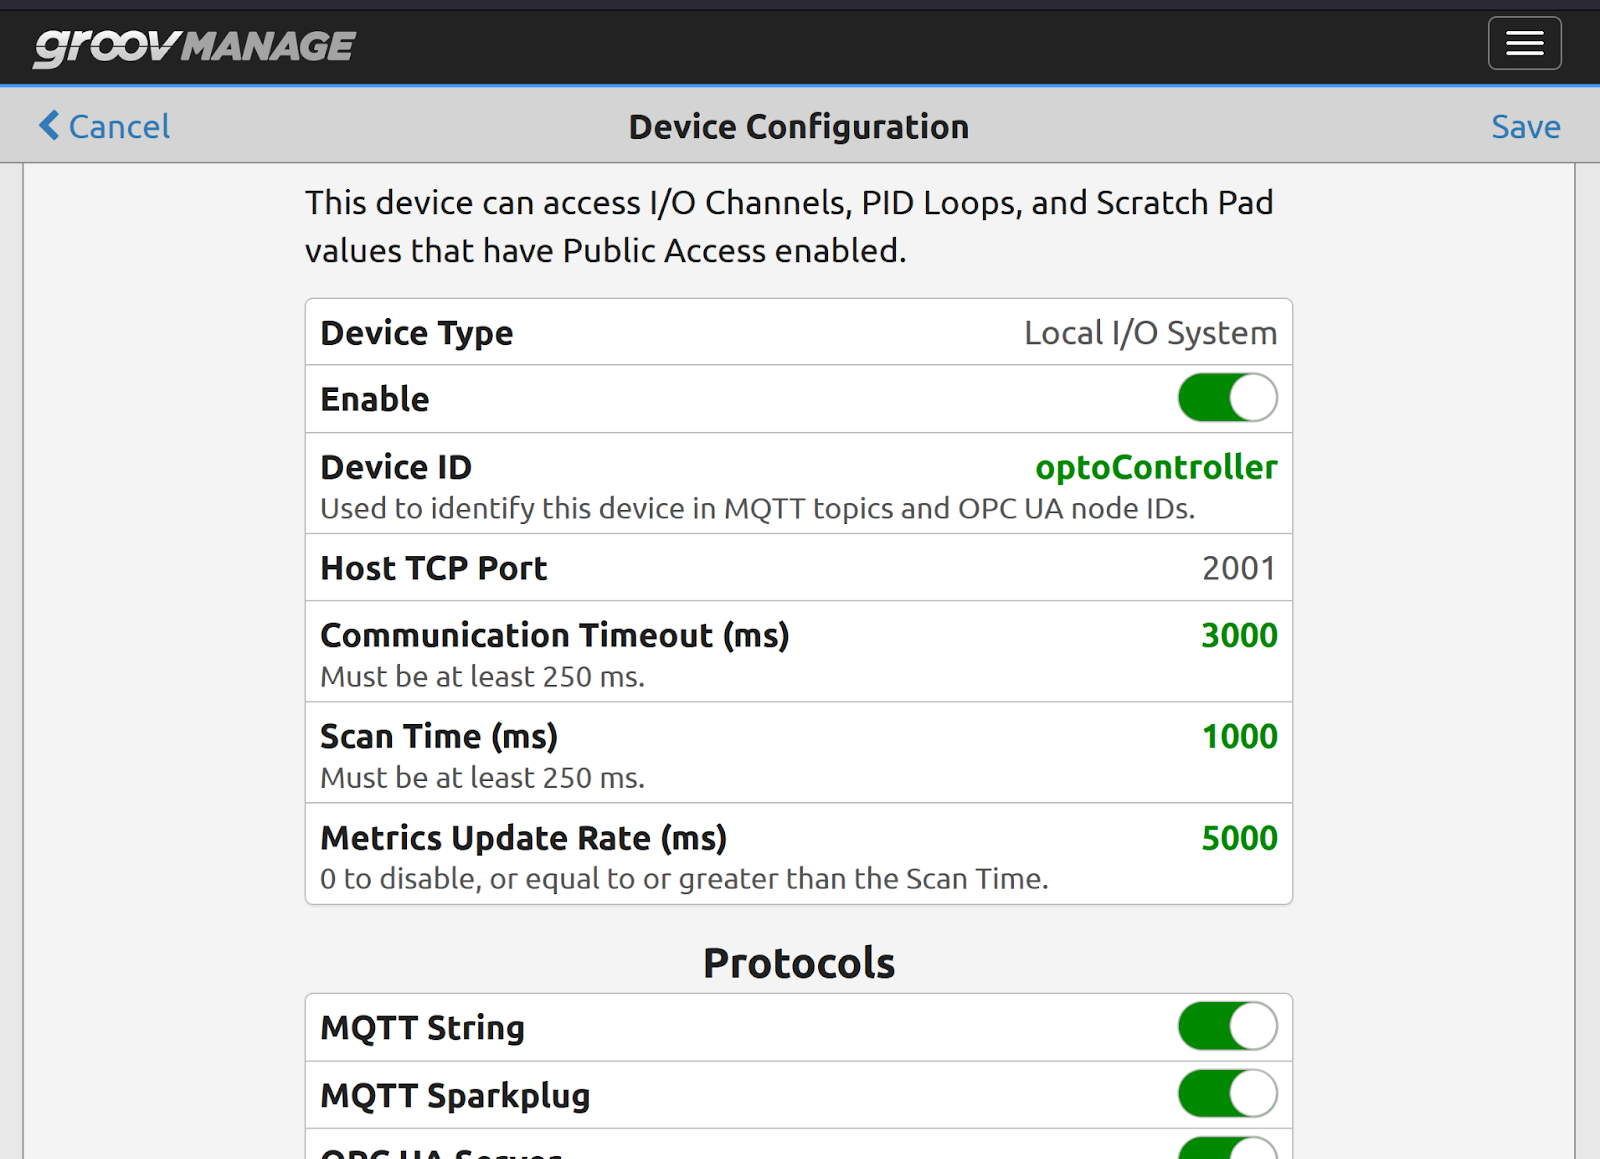
また、Public Accessの中ににあるI/O Channelsの有効設定が必要です。
I/O画面にはOpto22にインストールされているIO Slotがすべて表示しています。
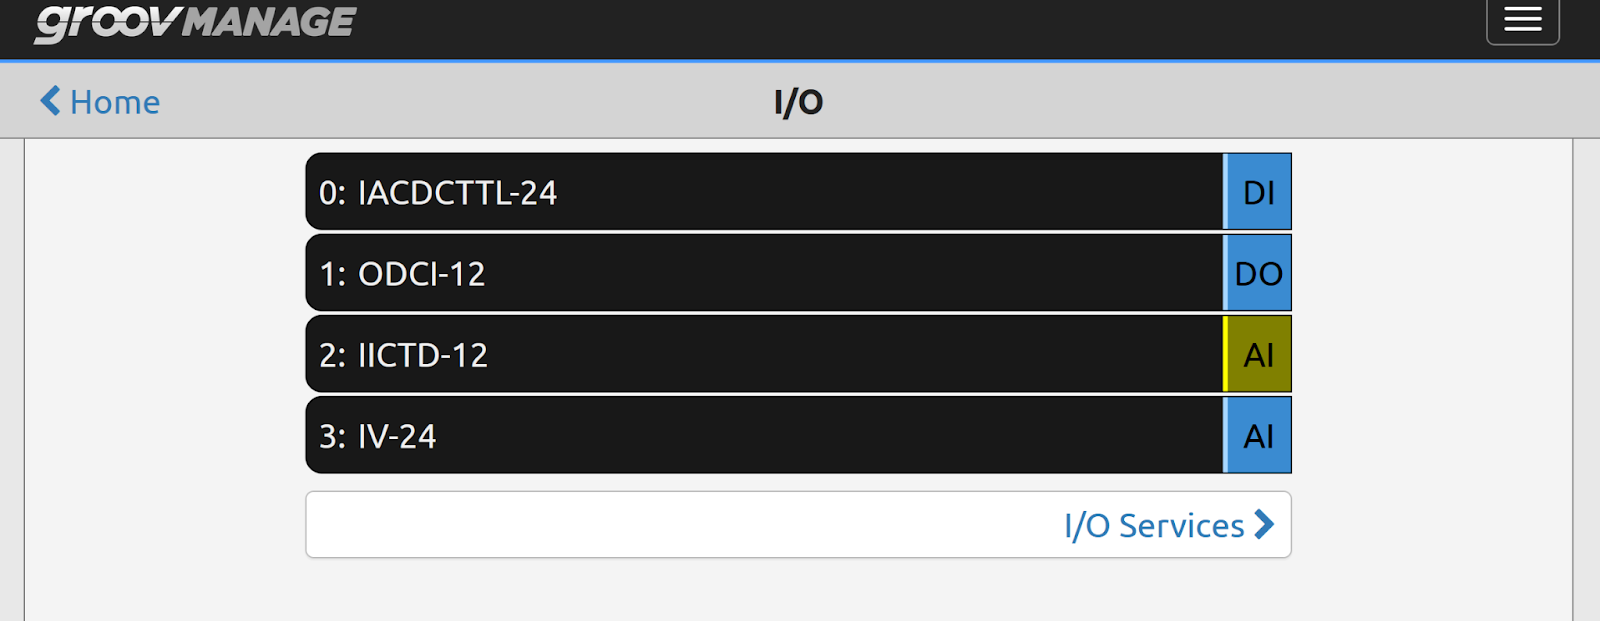
また、各Channelには名前を設定することによって、OPCUA Serverの中にNodeとしてアクセス可能になります。
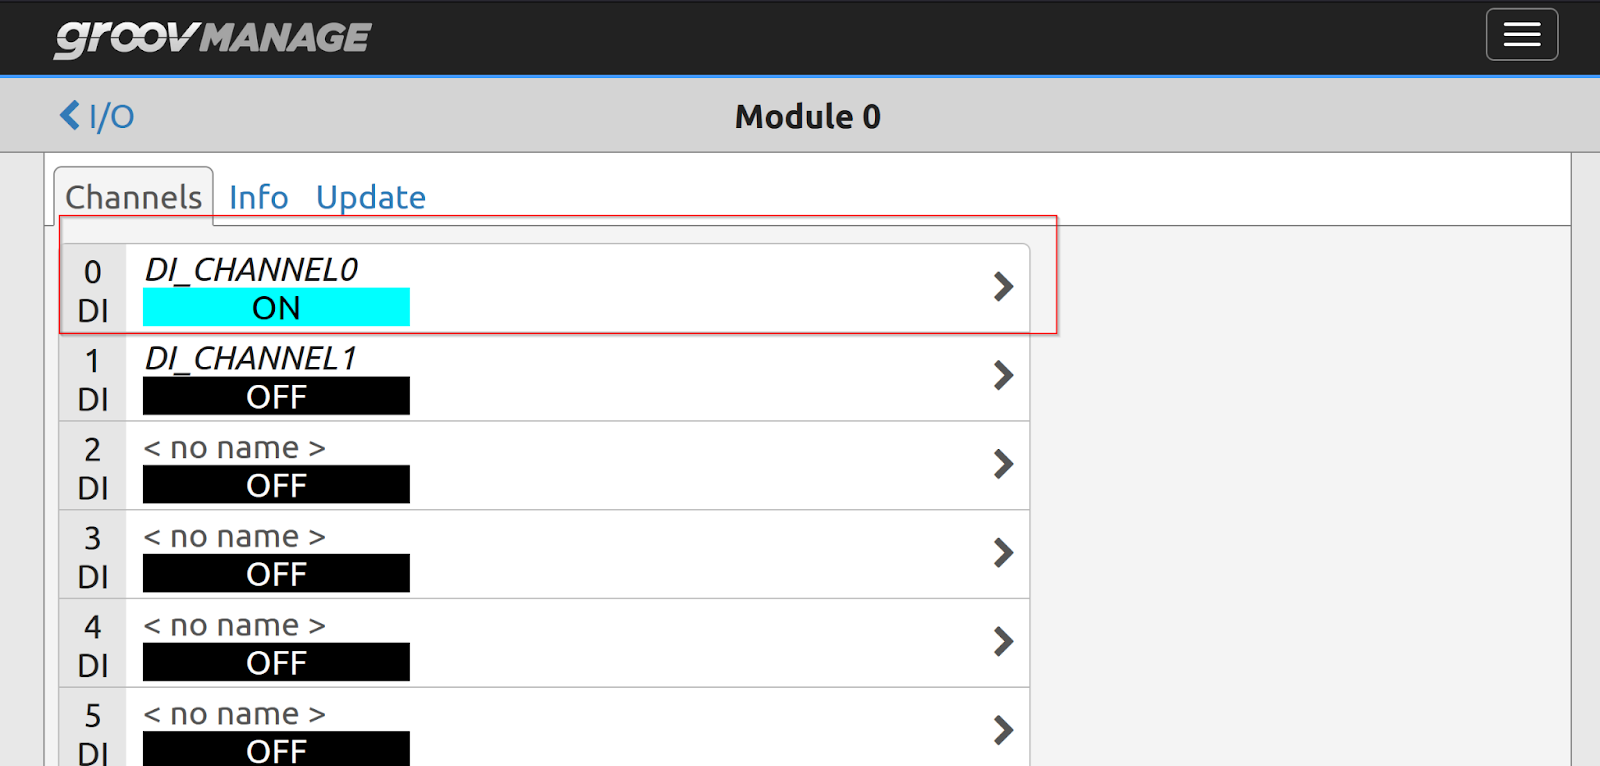
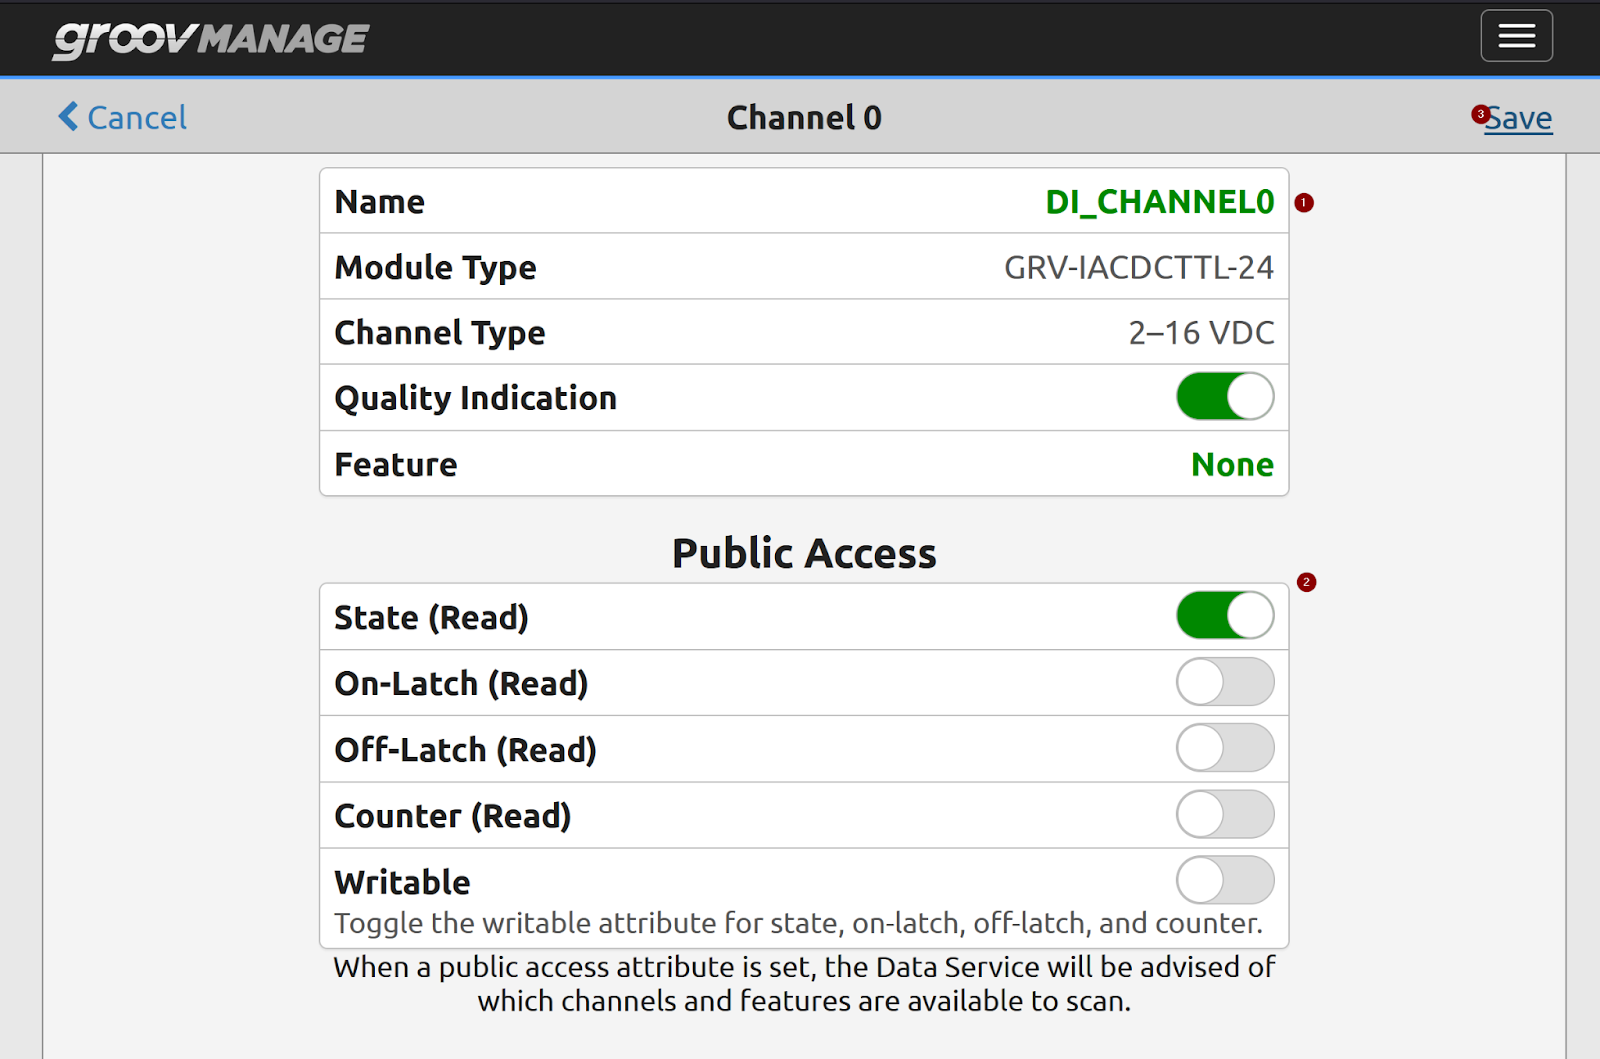
こちらはModule0、Channel0の設定画面で、Configure ボタンをクリックし細かい設定を行います。
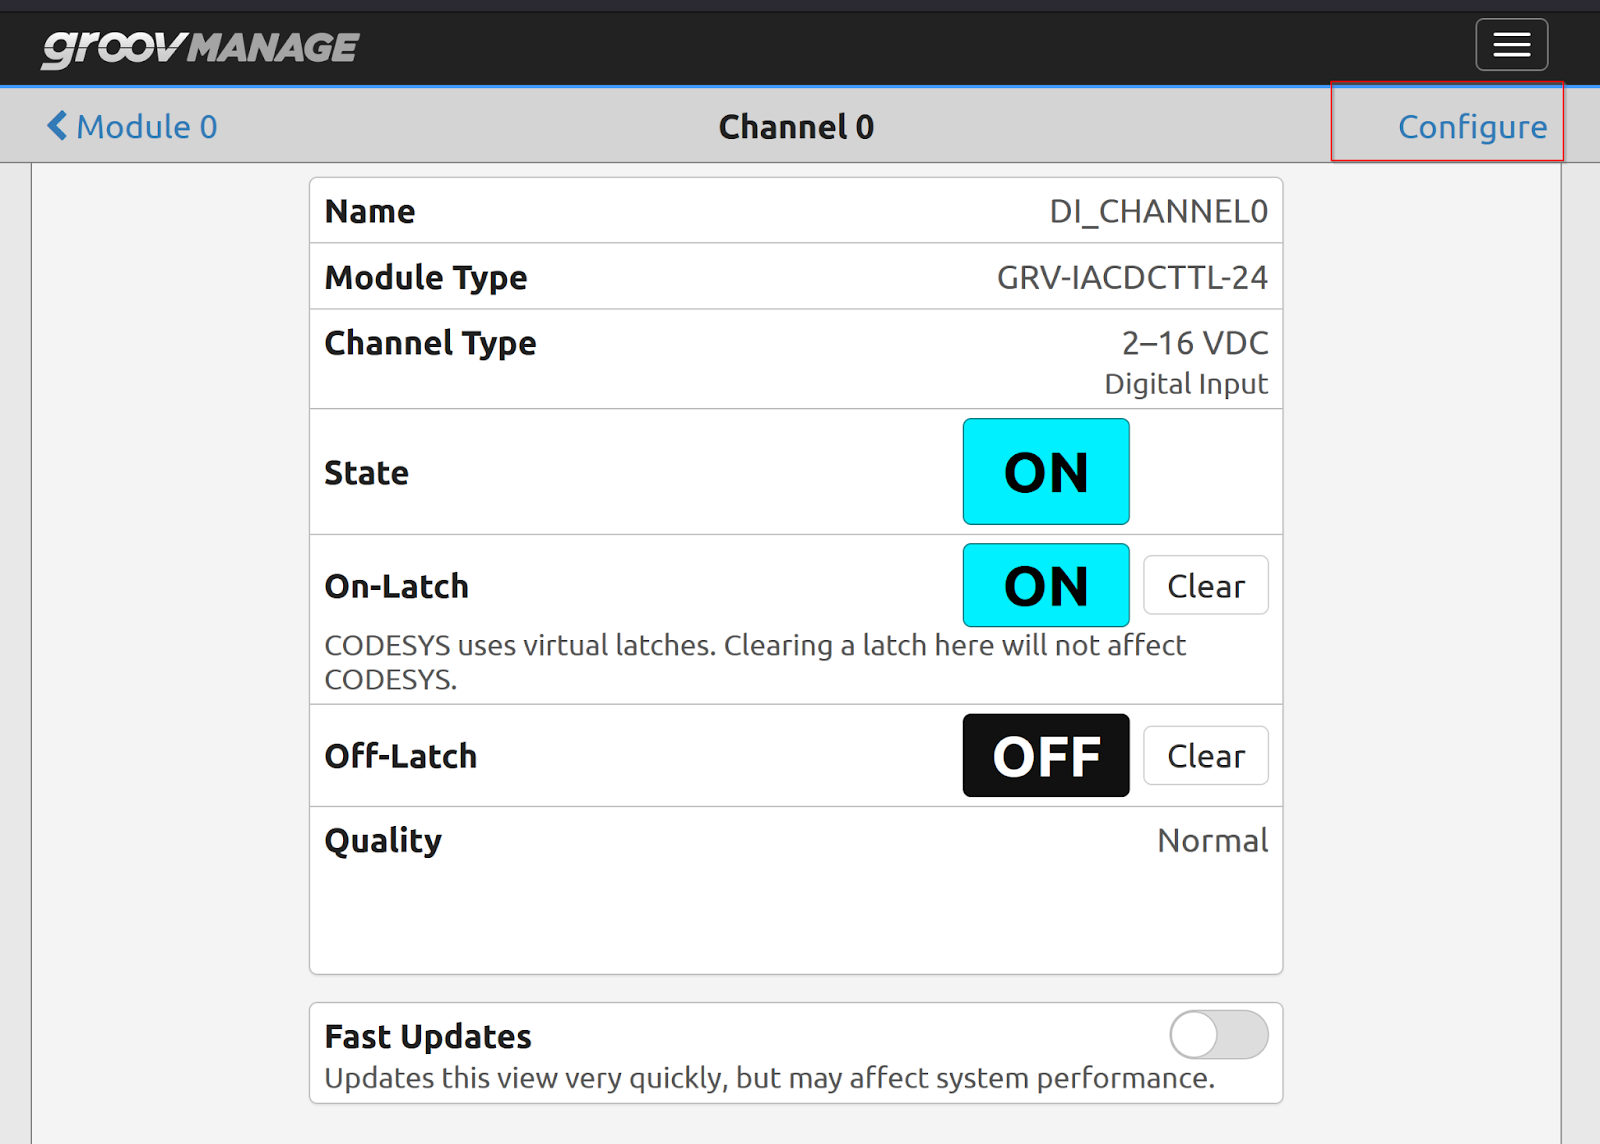
基本はNameとPubic Accessできるデータの設定のみでOKです。
ctlX Side
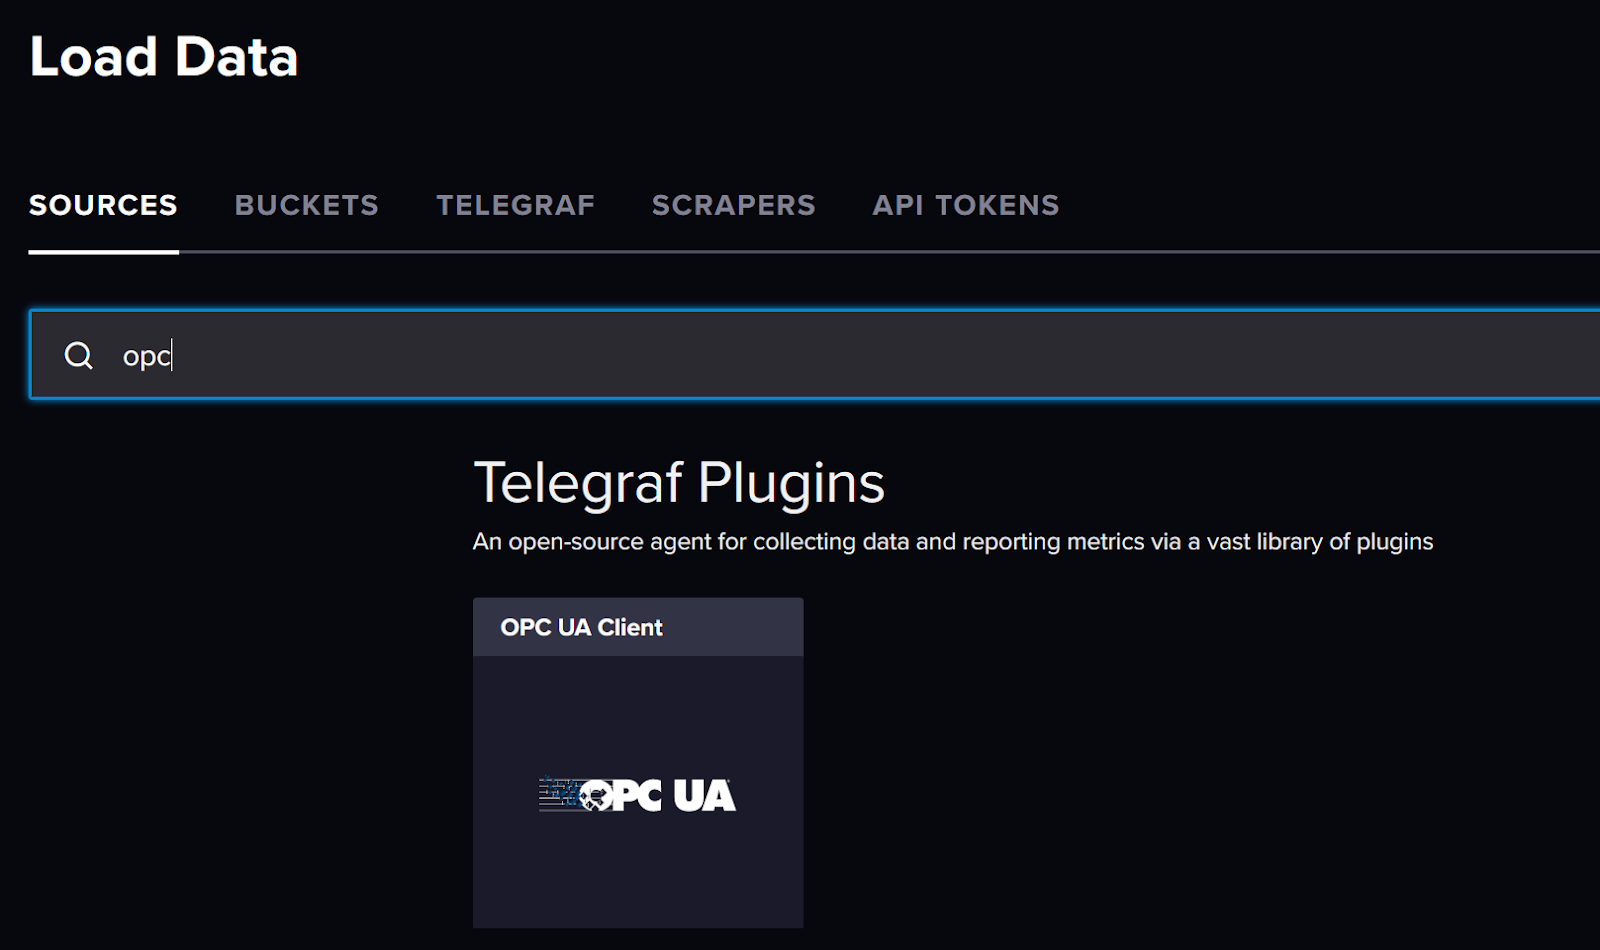
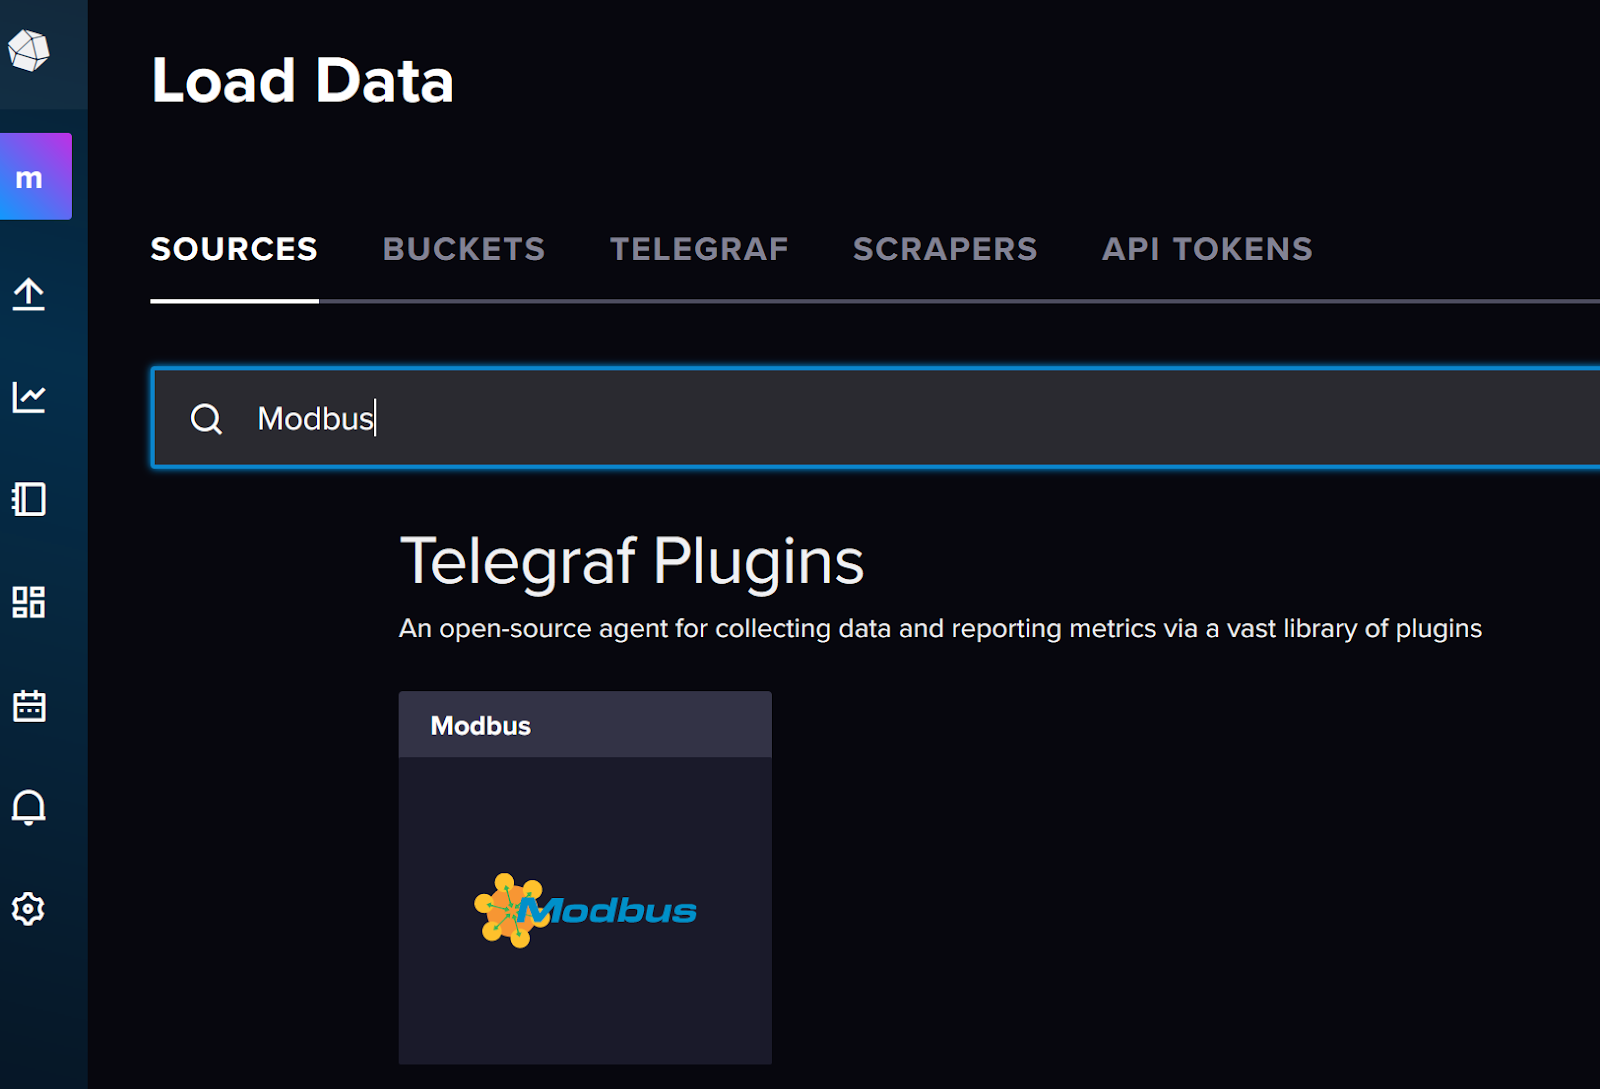
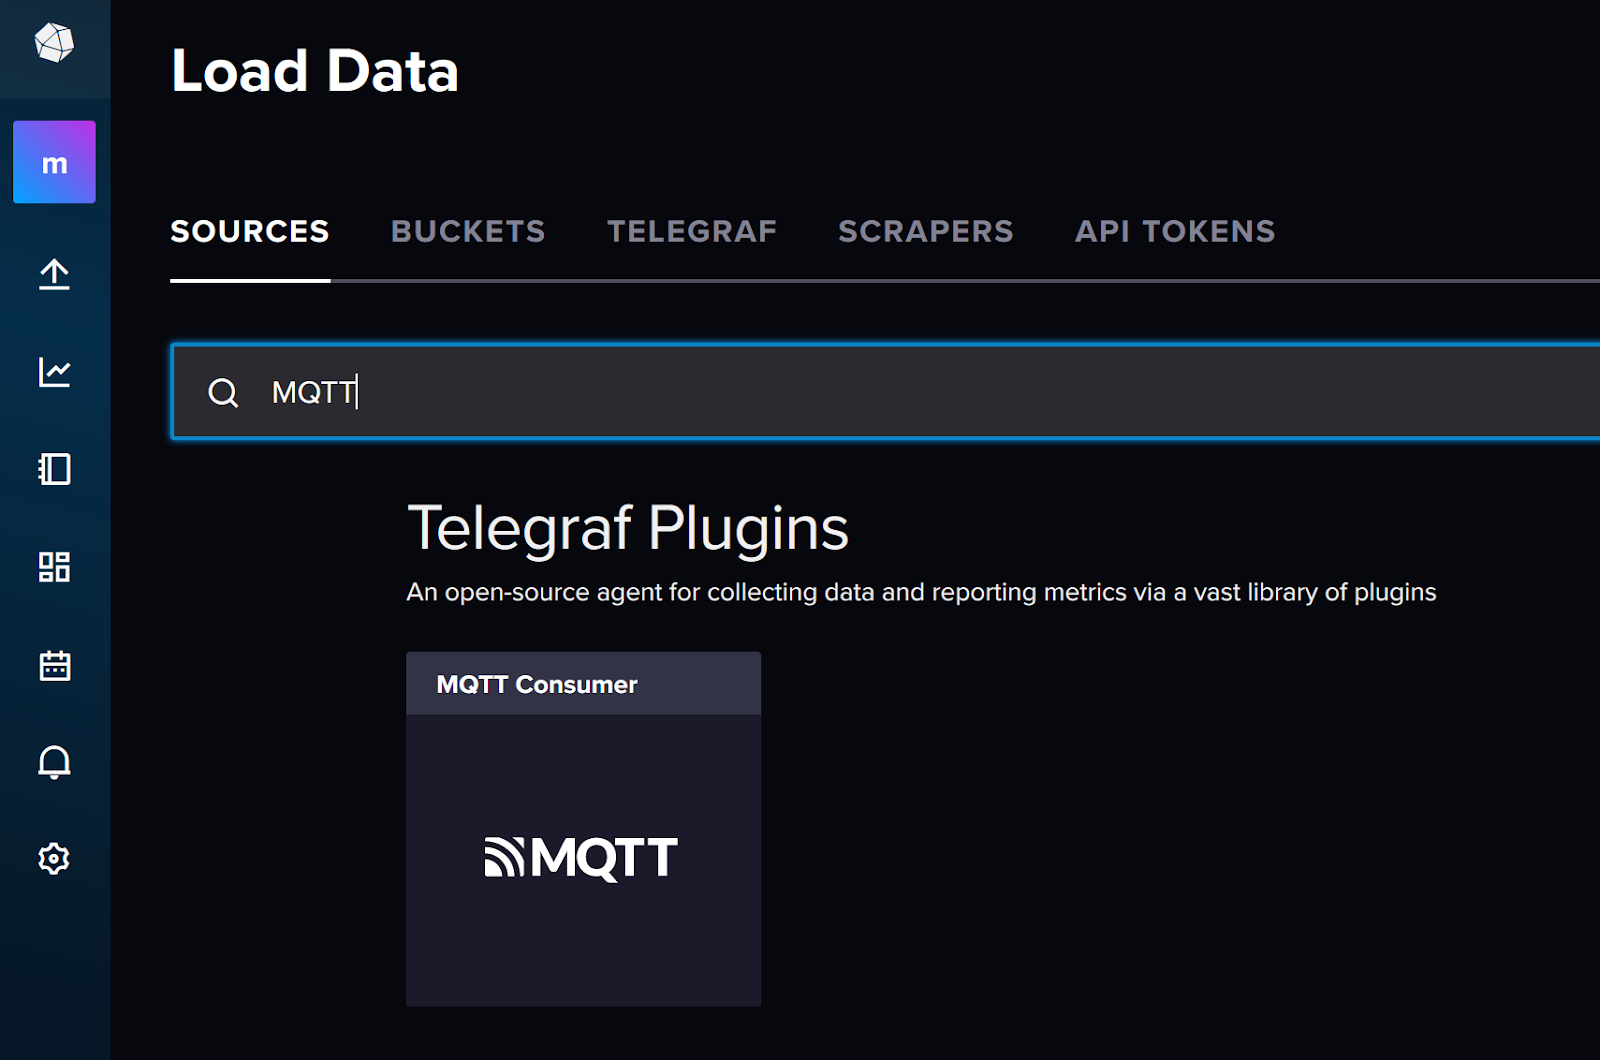
次はctrlX Sideの設定を行います。InfluxDBの中にあるSource Menuを開きます。
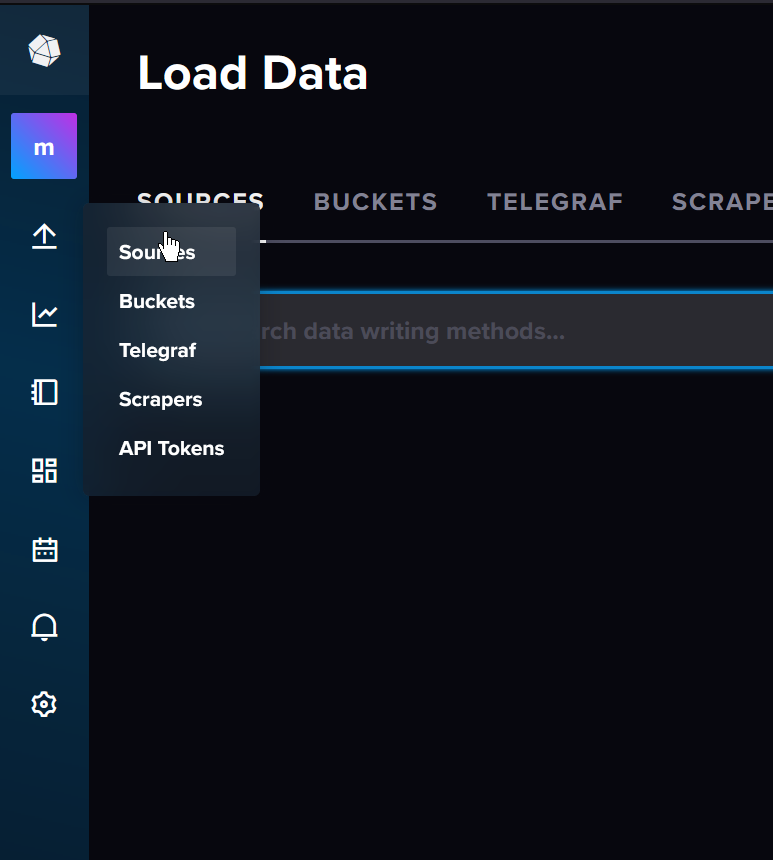
Load Data Source画面が表示されています。
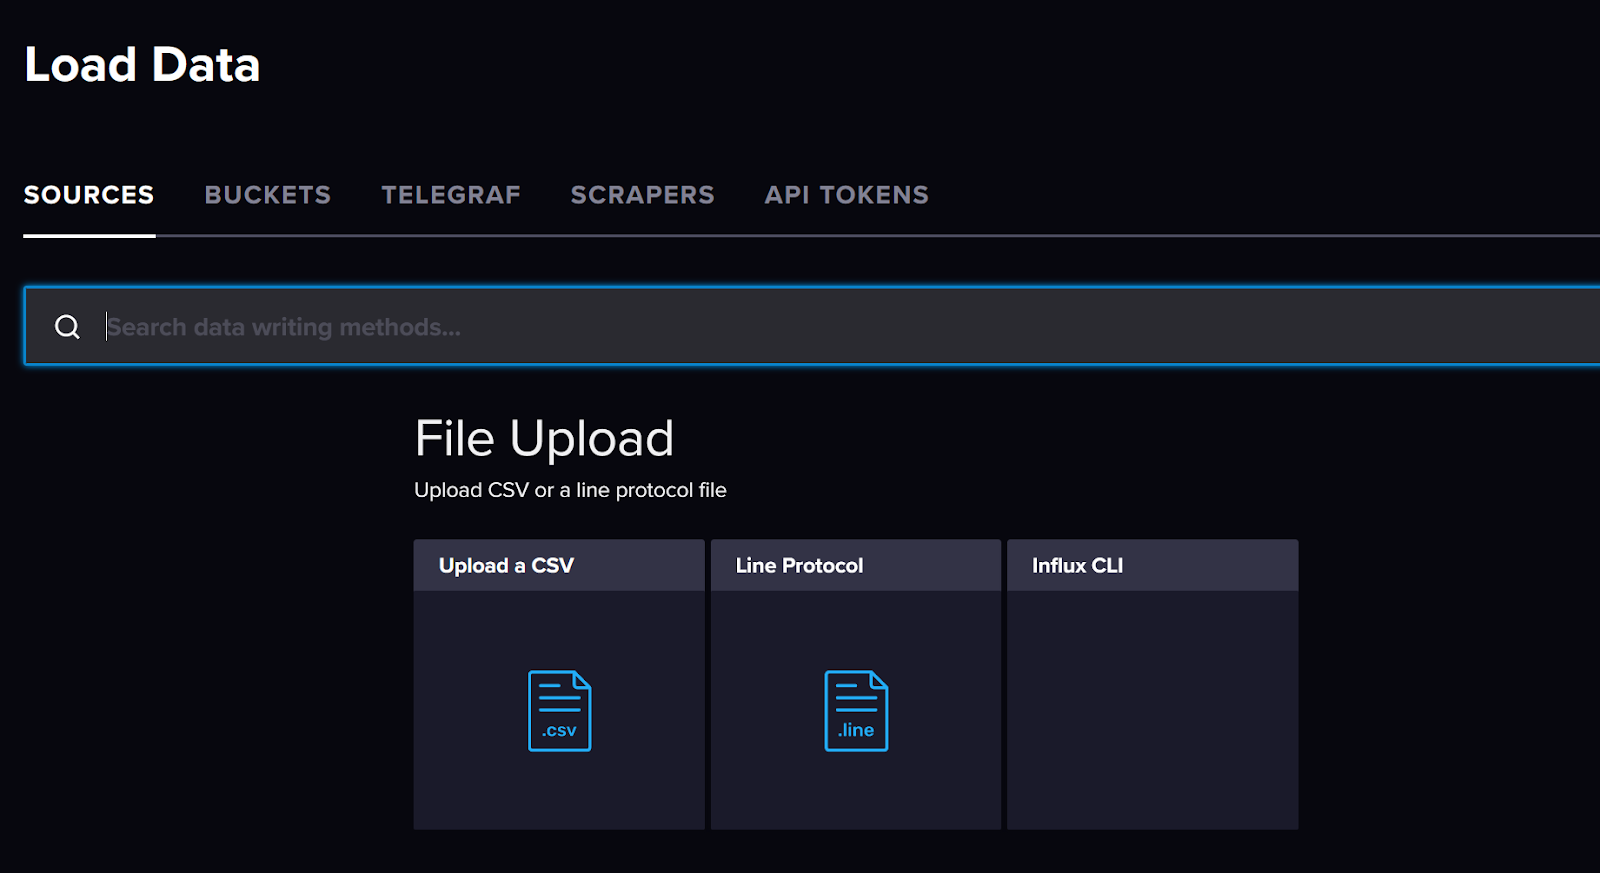
OPC UAを検索し、TelegrafのOPC UA Client Pluginをダブルクリックします。
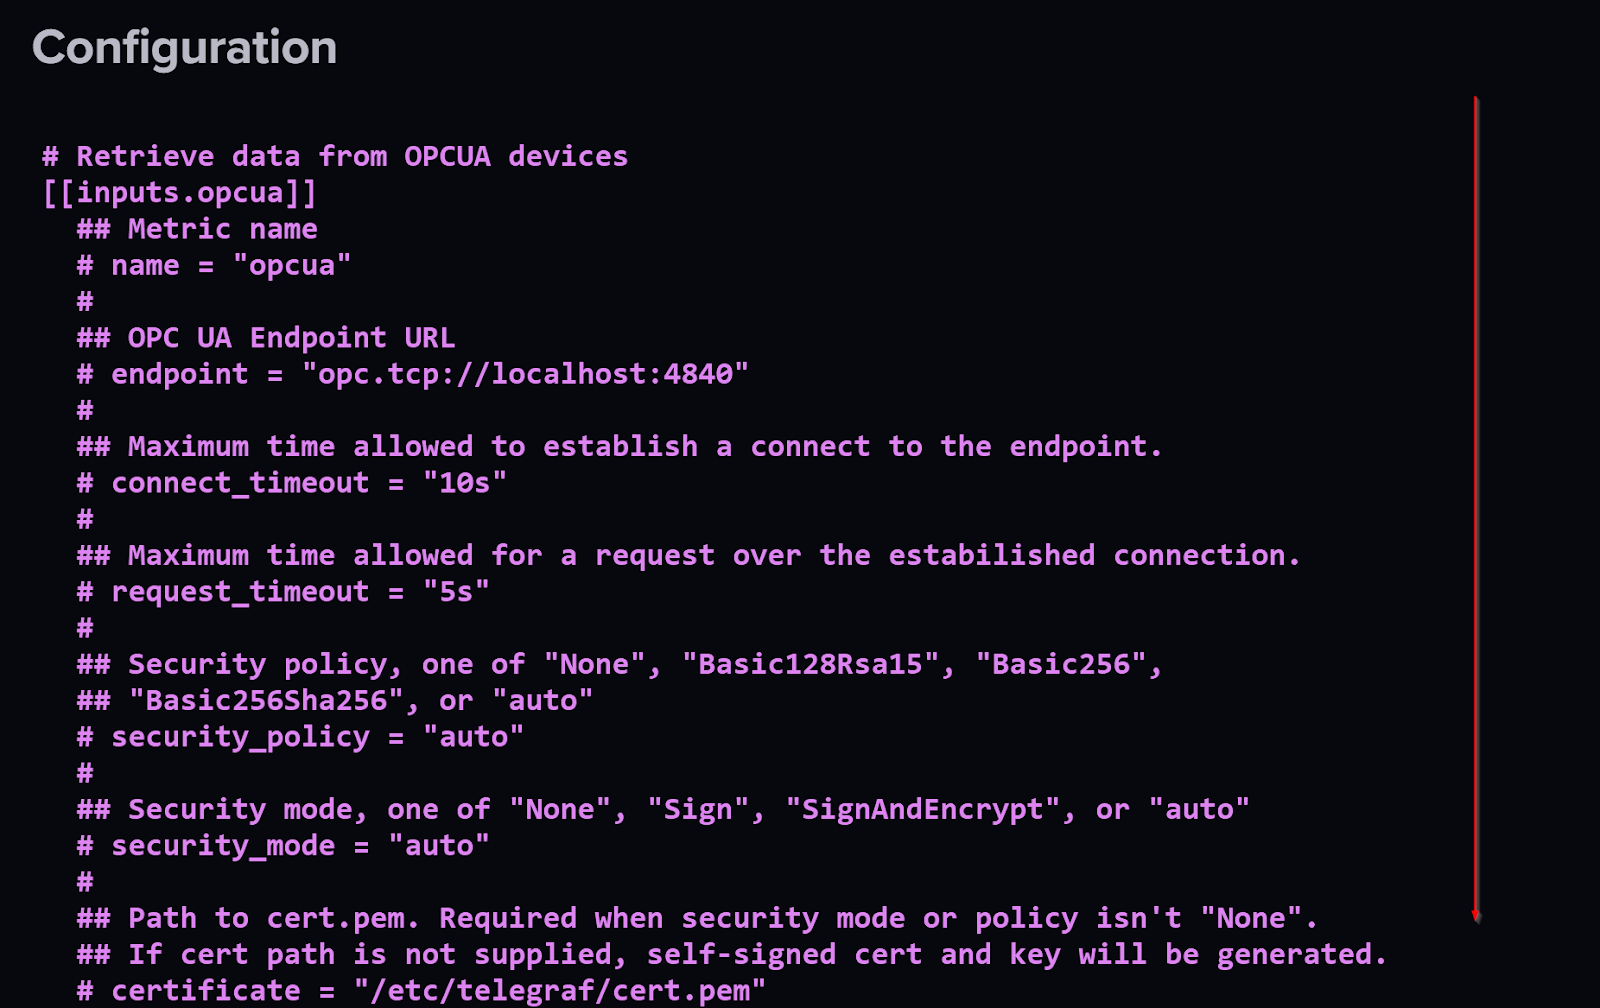
OPC UA Input Plugin画面が表示されます。
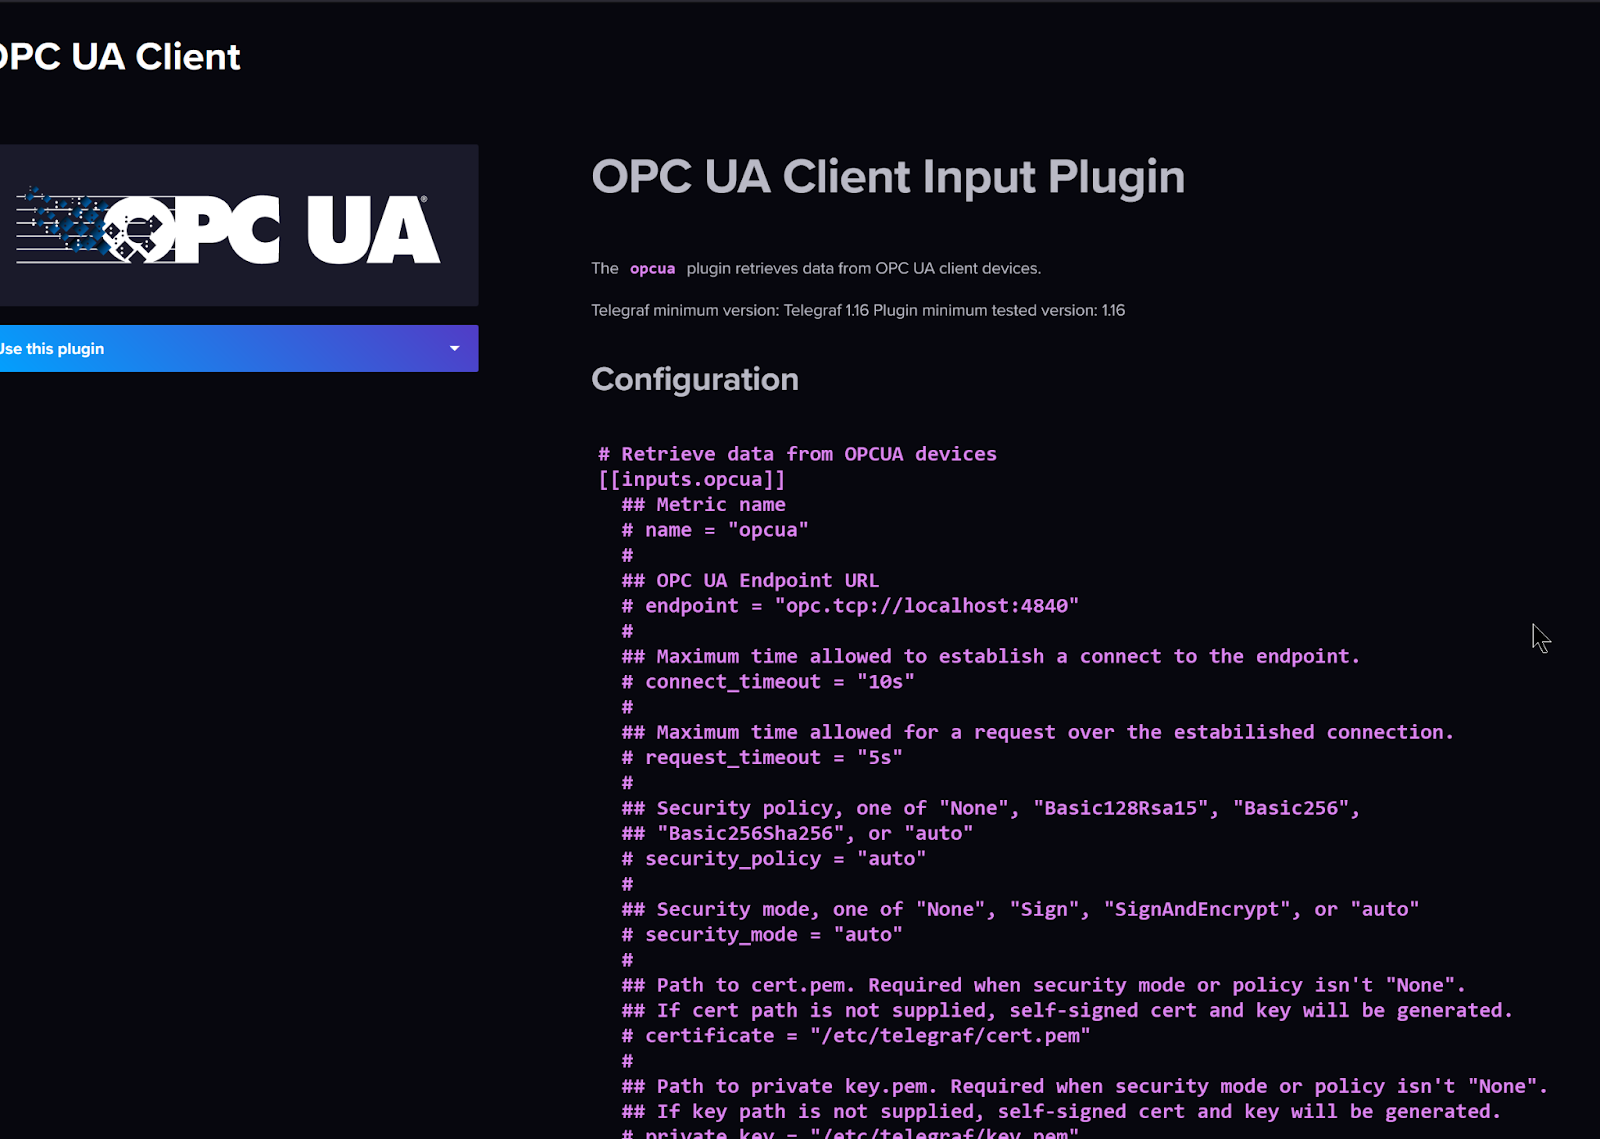
画面に表示されているConfigurationテキストをすべてCopyし、ctrlXのTelegraf Configurationに貼り付けてください。
Configuration
こちらはOPC-UA Pluginを追加したTelegraf Configurationになります。
| [agent] interval = “5s” round_interval = true flush_interval = “5s” ## Install InfluxDB at first ## Set up the InfluxDB with organization and initial bucket ## Log in the InfluxDB UI and get the token ## Configure the output plugin influxdb_v2 with these datas [[outputs.influxdb_v2]] urls = [“https://127.0.0.1/influxdb”] token = “CquPrz9Vmbx-QgvMqGJgMVdHADDkjVAKZELRcANRKqWXRr-nxKQfVEGesQz6gad5GNV1neHdSMKfkd5eb5urkA==” organization = “mana” bucket = “mainBucket” insecure_skip_verify = true ## Configure the input plugin with the username and password to ctrlX Core [[inputs.ctrlx_datalayer]] ## Hostname or IP address of the ctrlX CORE Data Layer server ## example: server = “localhost” # Telegraf is running directly on the device ## server = “192.168.1.1” # Connect to ctrlX CORE remote via IP ## server = “host.example.com” # Connect to ctrlX CORE remote via hostname ## server = “10.0.2.2:8443” # Connect to ctrlX CORE Virtual from development environment server = “192.168.5.67:8443” ## Authentication credentials username = “boschrexroth” password = “boschrexroth” ## Use TLS but skip chain & host verification insecure_skip_verify = true ## Timeout for HTTP requests. (default: “10s”) # timeout = “10s” ## Create a ctrlX Data Layer subscription. ## It is possible to define multiple subscriptions per host. Each subscription can have its own ## sampling properties and a list of nodes to subscribe to. ## All subscriptions share the same credentials. [[inputs.ctrlx_datalayer.subscription]] ## The name of the measurement. (default: “ctrlx”) measurement = “metrics” ## Configure the ctrlX Data Layer nodes which should be subscribed. ## address – node address in ctrlX Data Layer (mandatory) ## name – field name to use in the output (optional, default: base name of address) ## tags – extra node tags to be added to the output metric (optional) ## Note: ## Use either the inline notation or the bracketed notation, not both. ## The tags property is only supported in bracketed notation due to toml parser restrictions ## Examples: ## Inline notation nodes=[ {name=”cpu_usage_percent”, address=”framework/metrics/system/cpu-utilisation-percent”}, ] ## Bracketed notation # [[inputs.ctrlx_datalayer.subscription.nodes]] # name =”available” # address=”framework/metrics/system/memavailable-mb” # ## Define extra tags related to node to be added to the output metric (optional) # [inputs.ctrlx_datalayer.subscription.nodes.tags] # node_tag1=”node_tag1″ # node_tag2=”node_tag2″ # [[inputs.ctrlx_datalayer.subscription.nodes]] # name =”used” # address=”framework/metrics/system/memused-mb” ## The switch “output_json_string” enables output of the measurement as json. ## That way it can be used in in a subsequent processor plugin, e.g. “Starlark Processor Plugin”. # output_json_string = false ## Define extra tags related to subscription to be added to the output metric (optional) # [inputs.ctrlx_datalayer.subscription.tags] # subscription_tag1 = “subscription_tag1” # subscription_tag2 = “subscription_tag2” ## The interval in which messages shall be sent by the ctrlX Data Layer to this plugin. (default: 1s) ## Higher values reduce load on network by queuing samples on server side and sending as a single TCP packet. #publish_interval = “1s” ## The interval a “keepalive” message is sent if no change of data occurs. (default: 60s) ## Only used internally to detect broken network connections. # keep_alive_interval = “60s” ## The interval an “error” message is sent if an error was received from a node. (default: 10s) ## Higher values reduce load on output target and network in case of errors by limiting frequency of error messages. # error_interval = “10s” ## The interval that defines the fastest rate at which the node values should be sampled and values captured. (default: 1s) ## The sampling frequency should be adjusted to the dynamics of the signal to be sampled. ## Higher sampling frequence increases load on ctrlX Data Layer. ## The sampling frequency can be higher, than the publish interval. Captured samples are put in a queue and sent in publish interval. ## Note: The minimum sampling interval can be overruled by a global setting in the ctrlX Data Layer configuration (‘datalayer/subscriptions/settings’). #sampling_interval = “1s” ## The requested size of the node value queue. (default: 10) ## Relevant if more values are captured than can be sent. # queue_size = 10 ## The behaviour of the queue if it is full. (default: “DiscardOldest”) ## Possible values: ## – “DiscardOldest” ## The oldest value gets deleted from the queue when it is full. ## – “DiscardNewest” ## The newest value gets deleted from the queue when it is full. # queue_behaviour = “DiscardOldest” ## The filter when a new value will be sampled. (default: 0.0) ## Calculation rule: If (abs(lastCapturedValue – newValue) > dead_band_value) capture(newValue). # dead_band_value = 0.0 ## The conditions on which a sample should be captured and thus will be sent as a message. (default: “StatusValue”) ## Possible values: ## – “Status” ## Capture the value only, when the state of the node changes from or to error state. Value changes are ignored. ## – “StatusValue” ## Capture when the value changes or the node changes from or to error state. ## See also ‘dead_band_value’ for what is considered as a value change. ## – “StatusValueTimestamp”: ## Capture even if the value is the same, but the timestamp of the value is newer. ## Note: This might lead to high load on the network because every sample will be sent as a message ## even if the value of the node did not change. # value_change = “StatusValue” [[inputs.opcua]] ## Metric name name = “opcua” # ## OPC UA Endpoint URL endpoint = “opc.tcp://192.168.5.134:14840/groov” # ## Maximum time allowed to establish a connect to the endpoint. connect_timeout = “10s” # ## Maximum time allowed for a request over the estabilished connection. request_timeout = “5s” # ## Security policy, one of “None”, “Basic128Rsa15”, “Basic256”, ## “Basic256Sha256”, or “auto” security_policy = “None” # ## Security mode, one of “None”, “Sign”, “SignAndEncrypt”, or “auto” security_mode = “None” # ## Path to cert.pem. Required when security mode or policy isn’t “None”. ## If cert path is not supplied, self-signed cert and key will be generated. # certificate = “/etc/telegraf/cert.pem” # ## Path to private key.pem. Required when security mode or policy isn’t “None”. ## If key path is not supplied, self-signed cert and key will be generated. # private_key = “/etc/telegraf/key.pem” # ## Authentication Method, one of “Certificate”, “UserName”, or “Anonymous”. To ## authenticate using a specific ID, select ‘Certificate’ or ‘UserName’ # auth_method = “Anonymous” # ## Username. Required for auth_method = “UserName” # username = “” # ## Password. Required for auth_method = “UserName” # password = “” # ## Option to select the metric timestamp to use. Valid options are: ## “gather” — uses the time of receiving the data in telegraf ## “server” — uses the timestamp provided by the server ## “source” — uses the timestamp provided by the source # timestamp = “gather” # ## Node ID configuration ## name – field name to use in the output ## namespace – OPC UA namespace of the node (integer value 0 thru 3) ## identifier_type – OPC UA ID type (s=string, i=numeric, g=guid, b=opaque) ## identifier – OPC UA ID (tag as shown in opcua browser) ## tags – extra tags to be added to the output metric (optional) ## Example: ## {name=”ProductUri”, namespace=”0″, identifier_type=”i”, identifier=”2262″, tags=[[“tag1″,”value1”],[“tag2”,”value2]]} nodes = [ # {name=””, namespace=””, identifier_type=””, identifier=””}, # {name=””, namespace=””, identifier_type=””, identifier=””}, {name=”DIChannel0″,namespace=”2″,identifier_type=”s”,identifier=”Devices/[optoController]/OptoMMP/Modules/Channels/DI_CHANNEL0/State”} ,{name=”DIChannel1″,namespace=”2″,identifier_type=”s”,identifier=”Devices/[optoController]/OptoMMP/Modules/Channels/DI_CHANNEL1/State”} ,{name=”AIRotarySwitch”,namespace=”2″,identifier_type=”s”,identifier=”Devices/[optoController]/OptoMMP/Modules/Channels/AI_RotarySwitch/Value”} ,{name=”AITempature”,namespace=”2″,identifier_type=”s”,identifier=”Devices/[optoController]/OptoMMP/Modules/Channels/AI_Tempature/Value”} ] # ## Node Group ## Sets defaults for OPC UA namespace and ID type so they aren’t required in ## every node. A group can also have a metric name that overrides the main ## plugin metric name. ## ## Multiple node groups are allowed #[[inputs.opcua.group]] ## Group Metric name. Overrides the top level name. If unset, the ## top level name is used. # name = # ## Group default namespace. If a node in the group doesn’t set its ## namespace, this is used. # namespace = # ## Group default identifier type. If a node in the group doesn’t set its ## namespace, this is used. # identifier_type = # ## Node ID Configuration. Array of nodes with the same settings as above. # nodes = [ # {name=””, namespace=””, identifier_type=””, identifier=””}, # {name=””, namespace=””, identifier_type=””, identifier=””}, #] ## Enable workarounds required by some devices to work correctly # [inputs.opcua.workarounds] ## Set additional valid status codes, StatusOK (0x0) is always considered valid # additional_valid_status_codes = [“0xC0”] # Retrieve data from MODBUS slave devices |
[[inputs.opcua]]
基本的にはこちらの設定をOPC UA Serverの設定と合わせる必要があります。
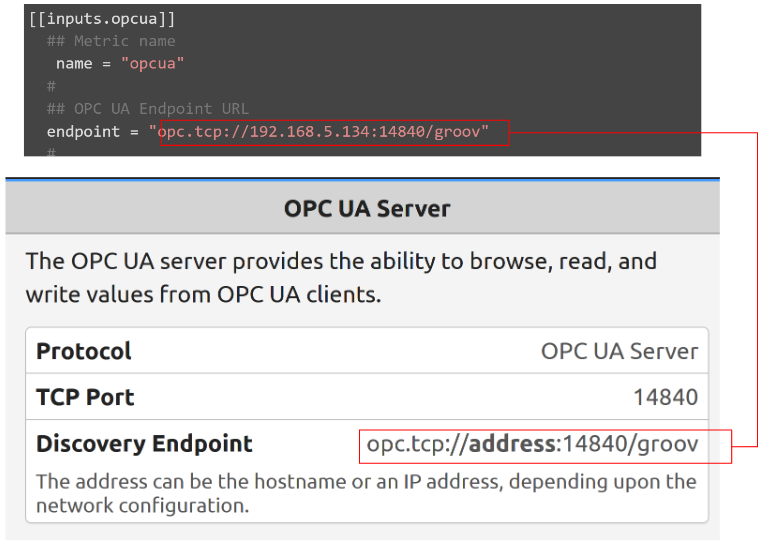
endpoint
endpointはOPC UA ServerのアクセスEndpointになります。
security_policy security_mode
こちらはOPC UA Serverをアクセスするときのセキュリティモードになります。
| ## Security policy, one of “None”, “Basic128Rsa15”, “Basic256”, ## “Basic256Sha256”, or “auto” security_policy = “None” # ## Security mode, one of “None”, “Sign”, “SignAndEncrypt”, or “auto” security_mode = “None” # |
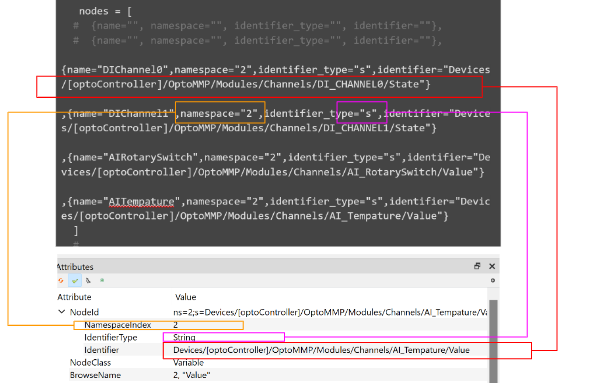
Nodes
Nodesは実際アプリケーション上でアクセスしたいOPC UA ServerのNodesになります。
Result
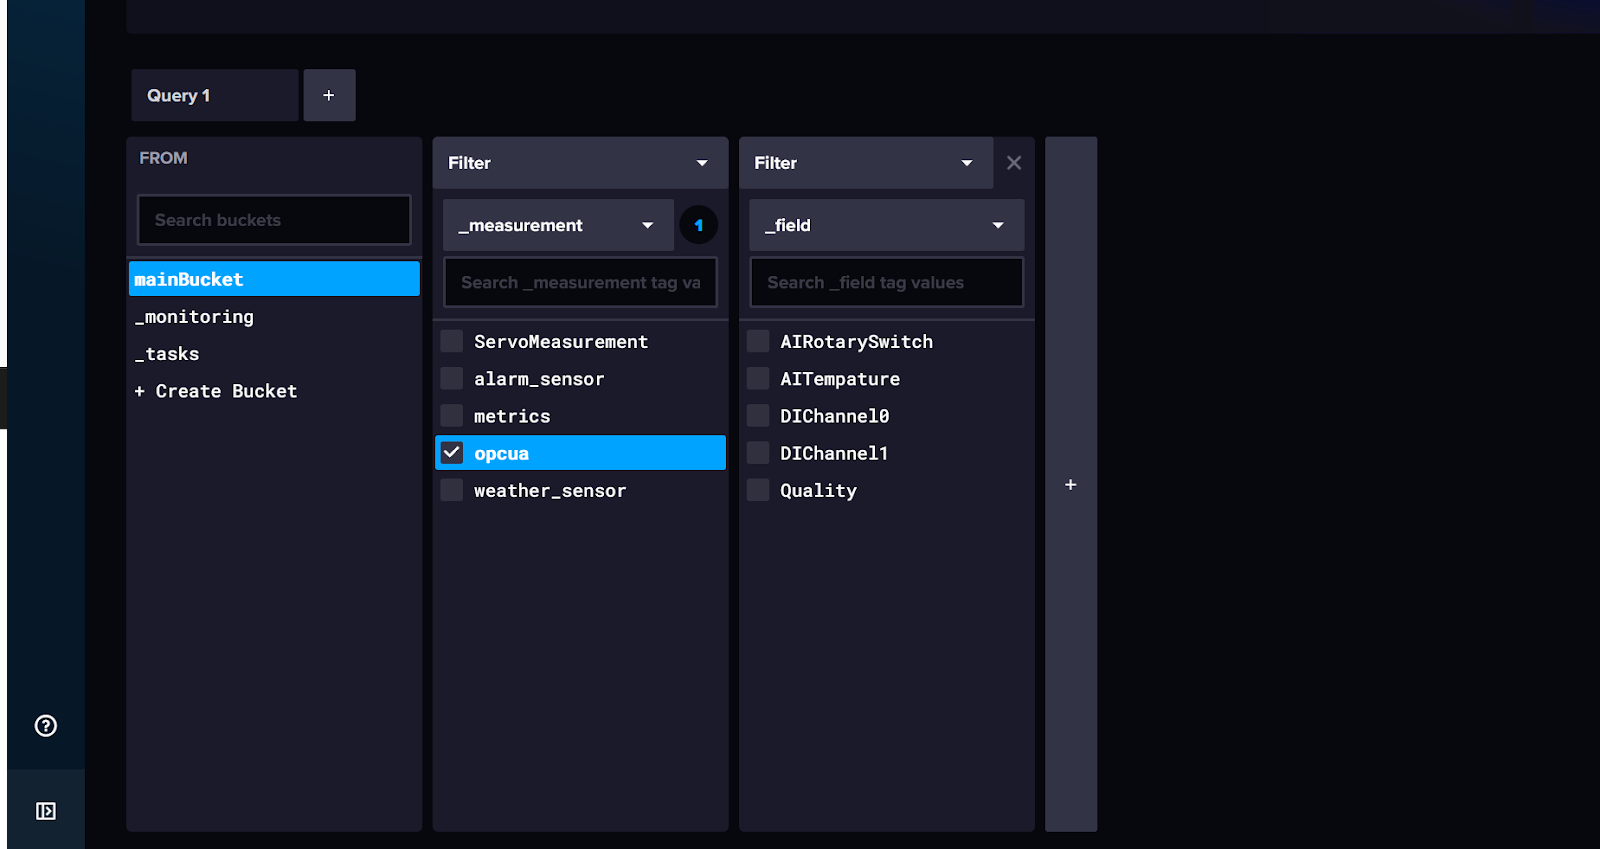
Done!_measurementに”opcua”が増え、_fieldにはOPC UA ServerのNodeデータもありました。
Implementation3 Modbus
今回はTelegraf APPのConfigurationにModbus Plginを追加し、groov EPIC CPUのModbus TCP Serverにアクセスし、データをInfluxDBに保存します。

Reference Link
Opto22 Side
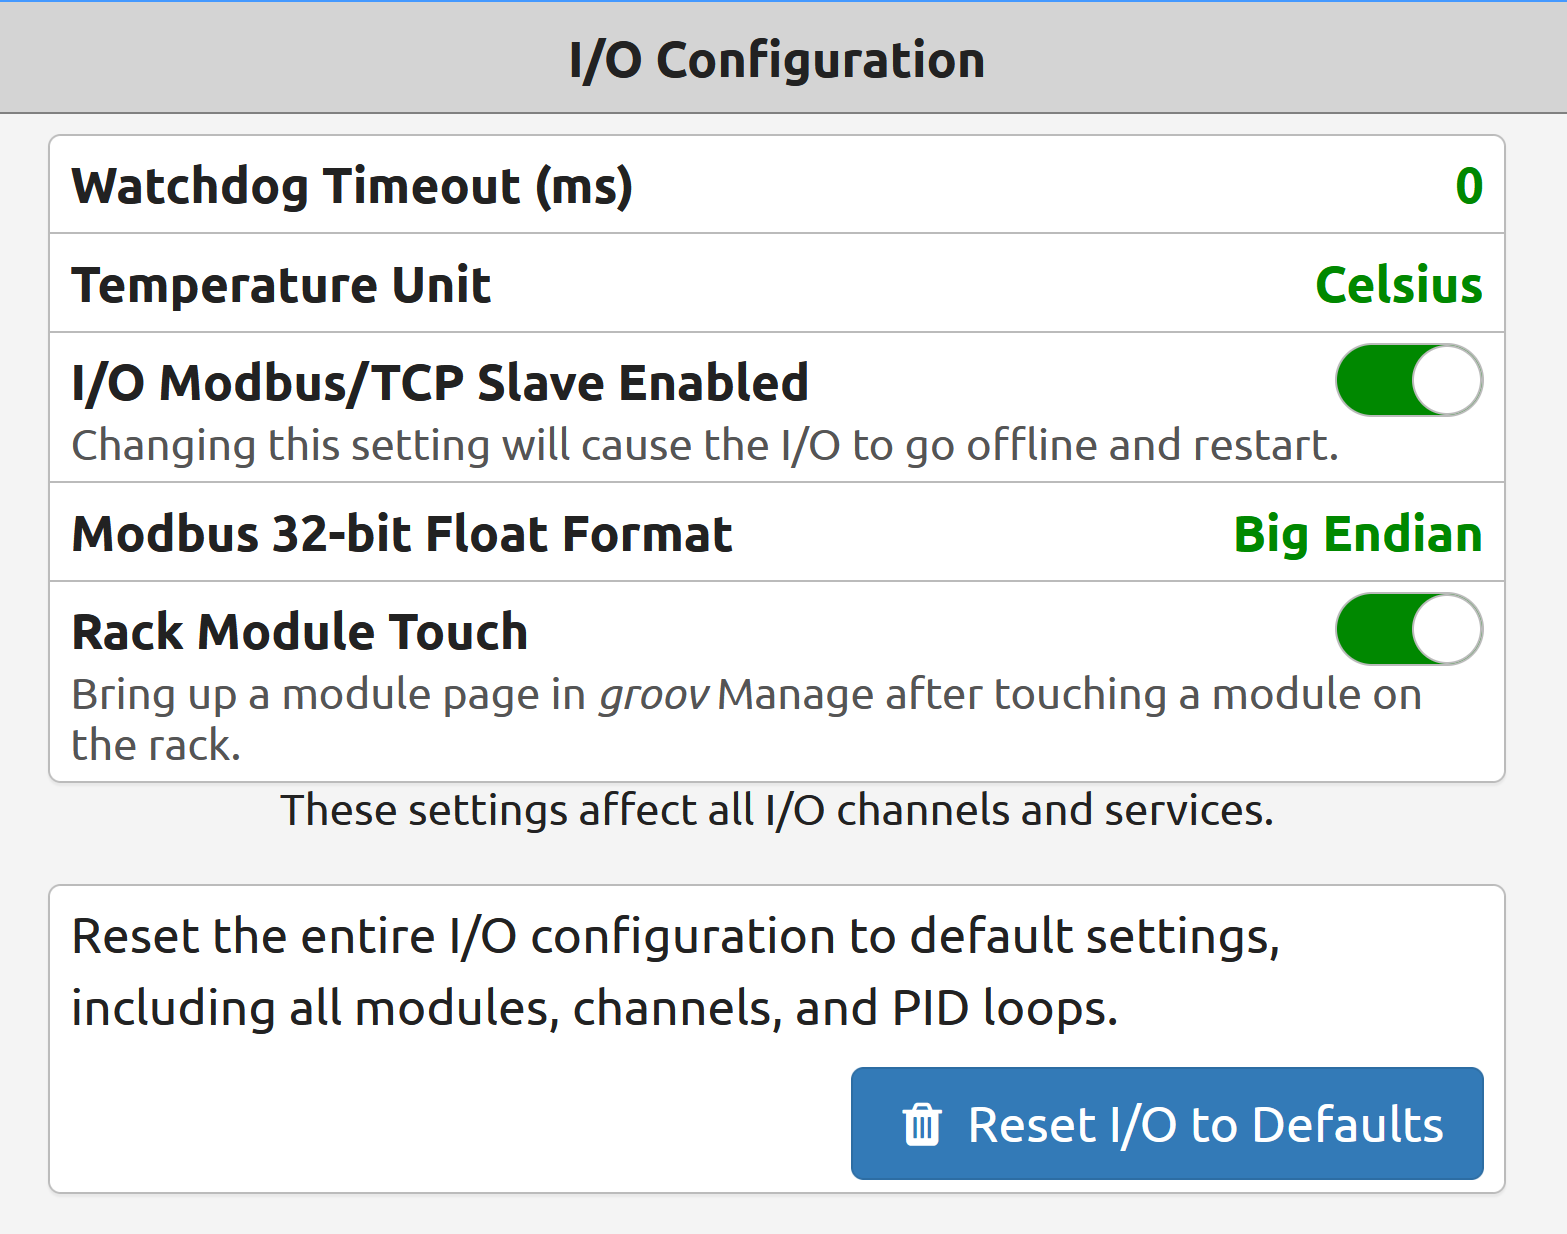
先ほどのReference Linkからも詳しい説明がありますが、今回の記事でも簡単な設定紹介だけさせていただきます。I/O Configuration画面の中でModbus 機能を有効にしてることを確認してください。
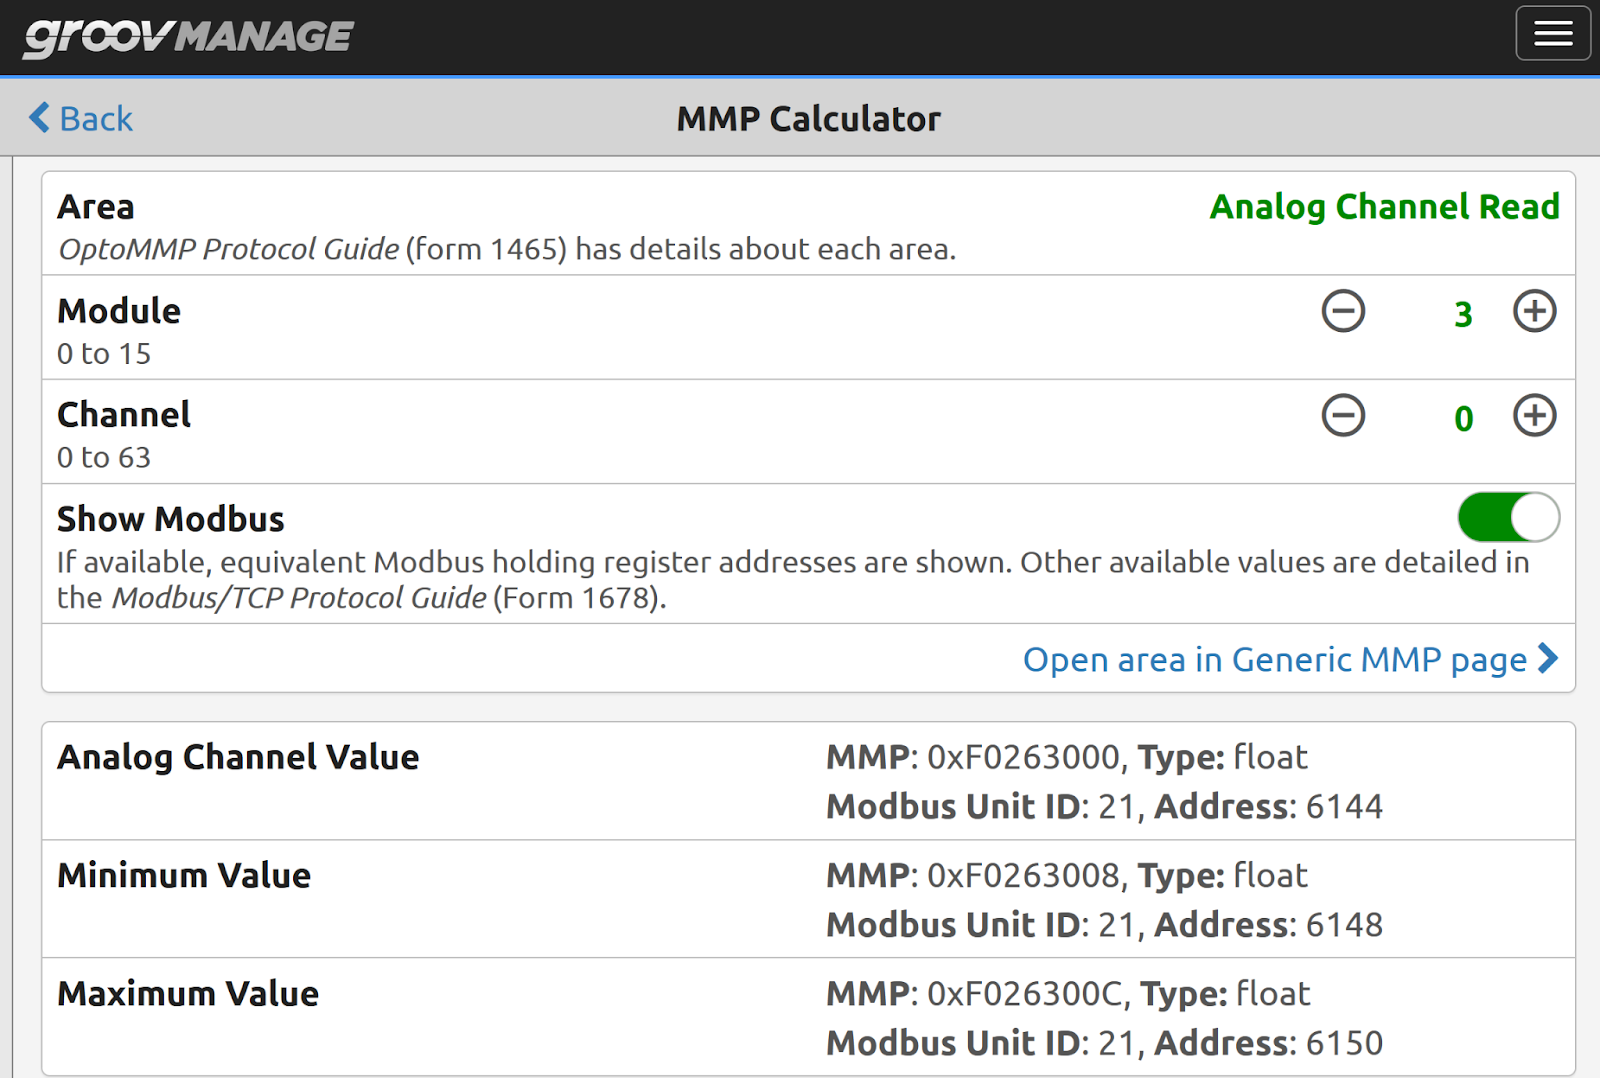
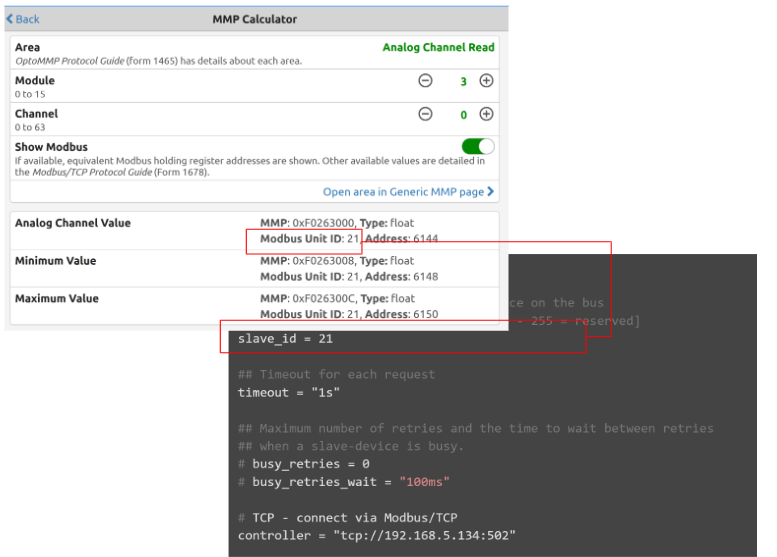
次はOpto22 ControllerのModbus アドレスを確認します。例えば下図では、Module3、Channel0のModbus アドレスはUnit ID=21、6144と6145になります。
ctrlX Side
今度はTelegraf のModbus Pluginsを追加します。こちらのPluginではRTUもTCPも対応しています。
Configuration
こちらはModbus Pluginを追加したTelegraf Configurationになります。
| [agent] interval = “5s” round_interval = true flush_interval = “5s” ## Install InfluxDB at first ## Set up the InfluxDB with organization and initial bucket ## Log in the InfluxDB UI and get the token ## Configure the output plugin influxdb_v2 with these datas [[outputs.influxdb_v2]] urls = [“https://127.0.0.1/influxdb”] token = “CquPrz9Vmbx-QgvMqGJgMVdHADDkjVAKZELRcANRKqWXRr-nxKQfVEGesQz6gad5GNV1neHdSMKfkd5eb5urkA==” organization = “mana” bucket = “mainBucket2” insecure_skip_verify = true ## Configure the input plugin with the username and password to ctrlX Core [[inputs.ctrlx_datalayer]] ## Hostname or IP address of the ctrlX CORE Data Layer server ## example: server = “localhost” # Telegraf is running directly on the device ## server = “192.168.1.1” # Connect to ctrlX CORE remote via IP ## server = “host.example.com” # Connect to ctrlX CORE remote via hostname ## server = “10.0.2.2:8443” # Connect to ctrlX CORE Virtual from development environment server = “192.168.5.67:8443” ## Authentication credentials username = “boschrexroth” password = “boschrexroth” ## Use TLS but skip chain & host verification insecure_skip_verify = true ## Timeout for HTTP requests. (default: “10s”) # timeout = “10s” ## Create a ctrlX Data Layer subscription. ## It is possible to define multiple subscriptions per host. Each subscription can have its own ## sampling properties and a list of nodes to subscribe to. ## All subscriptions share the same credentials. [[inputs.ctrlx_datalayer.subscription]] ## The name of the measurement. (default: “ctrlx”) measurement = “metrics” ## Configure the ctrlX Data Layer nodes which should be subscribed. ## address – node address in ctrlX Data Layer (mandatory) ## name – field name to use in the output (optional, default: base name of address) ## tags – extra node tags to be added to the output metric (optional) ## Note: ## Use either the inline notation or the bracketed notation, not both. ## The tags property is only supported in bracketed notation due to toml parser restrictions ## Examples: ## Inline notation nodes=[ {name=”cpu_usage_percent”, address=”framework/metrics/system/cpu-utilisation-percent”}, ] ## Bracketed notation # [[inputs.ctrlx_datalayer.subscription.nodes]] # name =”available” # address=”framework/metrics/system/memavailable-mb” # ## Define extra tags related to node to be added to the output metric (optional) # [inputs.ctrlx_datalayer.subscription.nodes.tags] # node_tag1=”node_tag1″ # node_tag2=”node_tag2″ # [[inputs.ctrlx_datalayer.subscription.nodes]] # name =”used” # address=”framework/metrics/system/memused-mb” ## The switch “output_json_string” enables output of the measurement as json. ## That way it can be used in in a subsequent processor plugin, e.g. “Starlark Processor Plugin”. # output_json_string = false ## Define extra tags related to subscription to be added to the output metric (optional) # [inputs.ctrlx_datalayer.subscription.tags] # subscription_tag1 = “subscription_tag1” # subscription_tag2 = “subscription_tag2” ## The interval in which messages shall be sent by the ctrlX Data Layer to this plugin. (default: 1s) ## Higher values reduce load on network by queuing samples on server side and sending as a single TCP packet. #publish_interval = “1s” ## The interval a “keepalive” message is sent if no change of data occurs. (default: 60s) ## Only used internally to detect broken network connections. # keep_alive_interval = “60s” ## The interval an “error” message is sent if an error was received from a node. (default: 10s) ## Higher values reduce load on output target and network in case of errors by limiting frequency of error messages. # error_interval = “10s” ## The interval that defines the fastest rate at which the node values should be sampled and values captured. (default: 1s) ## The sampling frequency should be adjusted to the dynamics of the signal to be sampled. ## Higher sampling frequence increases load on ctrlX Data Layer. ## The sampling frequency can be higher, than the publish interval. Captured samples are put in a queue and sent in publish interval. ## Note: The minimum sampling interval can be overruled by a global setting in the ctrlX Data Layer configuration (‘datalayer/subscriptions/settings’). #sampling_interval = “1s” ## The requested size of the node value queue. (default: 10) ## Relevant if more values are captured than can be sent. # queue_size = 10 ## The behaviour of the queue if it is full. (default: “DiscardOldest”) ## Possible values: ## – “DiscardOldest” ## The oldest value gets deleted from the queue when it is full. ## – “DiscardNewest” ## The newest value gets deleted from the queue when it is full. # queue_behaviour = “DiscardOldest” ## The filter when a new value will be sampled. (default: 0.0) ## Calculation rule: If (abs(lastCapturedValue – newValue) > dead_band_value) capture(newValue). # dead_band_value = 0.0 ## The conditions on which a sample should be captured and thus will be sent as a message. (default: “StatusValue”) ## Possible values: ## – “Status” ## Capture the value only, when the state of the node changes from or to error state. Value changes are ignored. ## – “StatusValue” ## Capture when the value changes or the node changes from or to error state. ## See also ‘dead_band_value’ for what is considered as a value change. ## – “StatusValueTimestamp”: ## Capture even if the value is the same, but the timestamp of the value is newer. ## Note: This might lead to high load on the network because every sample will be sent as a message ## even if the value of the node did not change. # value_change = “StatusValue” [[inputs.opcua]] ## Metric name name = “opcua” # ## OPC UA Endpoint URL endpoint = “opc.tcp://192.168.5.134:14840/groov” # ## Maximum time allowed to establish a connect to the endpoint. connect_timeout = “10s” # ## Maximum time allowed for a request over the estabilished connection. request_timeout = “5s” # ## Security policy, one of “None”, “Basic128Rsa15”, “Basic256”, ## “Basic256Sha256”, or “auto” security_policy = “None” # ## Security mode, one of “None”, “Sign”, “SignAndEncrypt”, or “auto” security_mode = “None” # ## Path to cert.pem. Required when security mode or policy isn’t “None”. ## If cert path is not supplied, self-signed cert and key will be generated. # certificate = “/etc/telegraf/cert.pem” # ## Path to private key.pem. Required when security mode or policy isn’t “None”. ## If key path is not supplied, self-signed cert and key will be generated. # private_key = “/etc/telegraf/key.pem” # ## Authentication Method, one of “Certificate”, “UserName”, or “Anonymous”. To ## authenticate using a specific ID, select ‘Certificate’ or ‘UserName’ # auth_method = “Anonymous” # ## Username. Required for auth_method = “UserName” # username = “” # ## Password. Required for auth_method = “UserName” # password = “” # ## Option to select the metric timestamp to use. Valid options are: ## “gather” — uses the time of receiving the data in telegraf ## “server” — uses the timestamp provided by the server ## “source” — uses the timestamp provided by the source # timestamp = “gather” # ## Node ID configuration ## name – field name to use in the output ## namespace – OPC UA namespace of the node (integer value 0 thru 3) ## identifier_type – OPC UA ID type (s=string, i=numeric, g=guid, b=opaque) ## identifier – OPC UA ID (tag as shown in opcua browser) ## tags – extra tags to be added to the output metric (optional) ## Example: ## {name=”ProductUri”, namespace=”0″, identifier_type=”i”, identifier=”2262″, tags=[[“tag1″,”value1”],[“tag2”,”value2]]} nodes = [ # {name=””, namespace=””, identifier_type=””, identifier=””}, # {name=””, namespace=””, identifier_type=””, identifier=””}, {name=”DIChannel0″,namespace=”2″,identifier_type=”s”,identifier=”Devices/[optoController]/OptoMMP/Modules/Channels/DI_CHANNEL0/State”} ,{name=”DIChannel1″,namespace=”2″,identifier_type=”s”,identifier=”Devices/[optoController]/OptoMMP/Modules/Channels/DI_CHANNEL1/State”} ,{name=”AIRotarySwitch”,namespace=”2″,identifier_type=”s”,identifier=”Devices/[optoController]/OptoMMP/Modules/Channels/AI_RotarySwitch/Value”} ,{name=”AITempature”,namespace=”2″,identifier_type=”s”,identifier=”Devices/[optoController]/OptoMMP/Modules/Channels/AI_Tempature/Value”} ] # ## Node Group ## Sets defaults for OPC UA namespace and ID type so they aren’t required in ## every node. A group can also have a metric name that overrides the main ## plugin metric name. ## ## Multiple node groups are allowed #[[inputs.opcua.group]] ## Group Metric name. Overrides the top level name. If unset, the ## top level name is used. # name = # ## Group default namespace. If a node in the group doesn’t set its ## namespace, this is used. # namespace = # ## Group default identifier type. If a node in the group doesn’t set its ## namespace, this is used. # identifier_type = # ## Node ID Configuration. Array of nodes with the same settings as above. # nodes = [ # {name=””, namespace=””, identifier_type=””, identifier=””}, # {name=””, namespace=””, identifier_type=””, identifier=””}, #] ## Enable workarounds required by some devices to work correctly # [inputs.opcua.workarounds] ## Set additional valid status codes, StatusOK (0x0) is always considered valid # additional_valid_status_codes = [“0xC0”] # Retrieve data from MODBUS slave devices [[inputs.modbus]] ## Connection Configuration ## ## The plugin supports connections to PLCs via MODBUS/TCP, RTU over TCP, ASCII over TCP or ## via serial line communication in binary (RTU) or readable (ASCII) encoding ## ## Device name name = “ModbusDriverOpto22” ## Slave ID – addresses a MODBUS device on the bus ## Range: 0 – 255 [0 = broadcast; 248 – 255 = reserved] slave_id = 21 ## Timeout for each request timeout = “1s” ## Maximum number of retries and the time to wait between retries ## when a slave-device is busy. # busy_retries = 0 # busy_retries_wait = “100ms” # TCP – connect via Modbus/TCP controller = “tcp://192.168.5.134:502” ## Serial (RS485; RS232) # controller = “file:///dev/ttyUSB0” # baud_rate = 9600 # data_bits = 8 # parity = “N” # stop_bits = 1 ## For Modbus over TCP you can choose between “TCP”, “RTUoverTCP” and “ASCIIoverTCP” ## default behaviour is “TCP” if the controller is TCP ## For Serial you can choose between “RTU” and “ASCII” # transmission_mode = “RTU” ## Trace the connection to the modbus device as debug messages ## Note: You have to enable telegraf’s debug mode to see those messages! # debug_connection = false ## Define the configuration schema ## |—register — define fields per register type in the original style (only supports one slave ID) ## |—request — define fields on a requests base configuration_type = “register” ## — “register” configuration style — ## Measurements ## ## Digital Variables, Discrete Inputs and Coils ## measurement – the (optional) measurement name, defaults to “modbus” ## name – the variable name ## address – variable address #discrete_inputs = [ # { name = “start”, address = [0]}, # { name = “stop”, address = [1]}, # { name = “reset”, address = [2]}, # { name = “emergency_stop”, address = [3]}, #] #coils = [ # { name = “motor1_run”, address = [0]}, # { name = “motor1_jog”, address = [1]}, # { name = “motor1_stop”, address = [2]}, #] ## Analog Variables, Input Registers and Holding Registers ## measurement – the (optional) measurement name, defaults to “modbus” ## name – the variable name ## byte_order – the ordering of bytes ## |—AB, ABCD – Big Endian ## |—BA, DCBA – Little Endian ## |—BADC – Mid-Big Endian ## |—CDAB – Mid-Little Endian ## data_type – INT16, UINT16, INT32, UINT32, INT64, UINT64, ## FLOAT32-IEEE, FLOAT64-IEEE (the IEEE 754 binary representation) ## FLOAT32, FIXED, UFIXED (fixed-point representation on input) ## scale – the final numeric variable representation ## address – variable address holding_registers = [ { name = “RotarySwitch”, byte_order = “ABCD”, data_type = “FLOAT32-IEEE”, scale=1.0 ,address = [6144,6145]} , { name = “RotarySwitch_MinLimit”, byte_order = “ABCD”, data_type = “FLOAT32-IEEE”, scale=1.0, address = [6148,6149]} , { name = “RotarySwitch_MaxLimit”, byte_order = “ABCD”, data_type = “FLOAT32-IEEE”, scale=1.0, address = [6150,6151]} # { name = “voltage”, byte_order = “AB”, data_type = “FIXED”, scale=0.1, address = [0]}, # { name = “energy”, byte_order = “ABCD”, data_type = “FIXED”, scale=0.001, address = [5,6]}, # { name = “current”, byte_order = “ABCD”, data_type = “FIXED”, scale=0.001, address = [1,2]}, # { name = “frequency”, byte_order = “AB”, data_type = “UFIXED”, scale=0.1, address = [7]}, # { name = “power”, byte_order = “ABCD”, data_type = “UFIXED”, scale=0.1, address = [3,4]}, ] # input_registers = [ # { name = “tank_level”, byte_order = “AB”, data_type = “INT16”, scale=1.0, address = [0]}, # { name = “tank_ph”, byte_order = “AB”, data_type = “INT16”, scale=1.0, address = [1]}, # { name = “pump1_speed”, byte_order = “ABCD”, data_type = “INT32”, scale=1.0, address = [3,4]}, # ] ## Enable workarounds required by some devices to work correctly # [inputs.modbus.workarounds] ## Pause between read requests sent to the device. This might be necessary for (slow) serial devices. # pause_between_requests = “0ms” ## Close the connection after every gather cycle. Usually the plugin closes the connection after a certain ## idle-timeout, however, if you query a device with limited simultaneous connectivity (e.g. serial devices) ## from multiple instances you might want to only stay connected during gather and disconnect afterwards. # close_connection_after_gather = false |
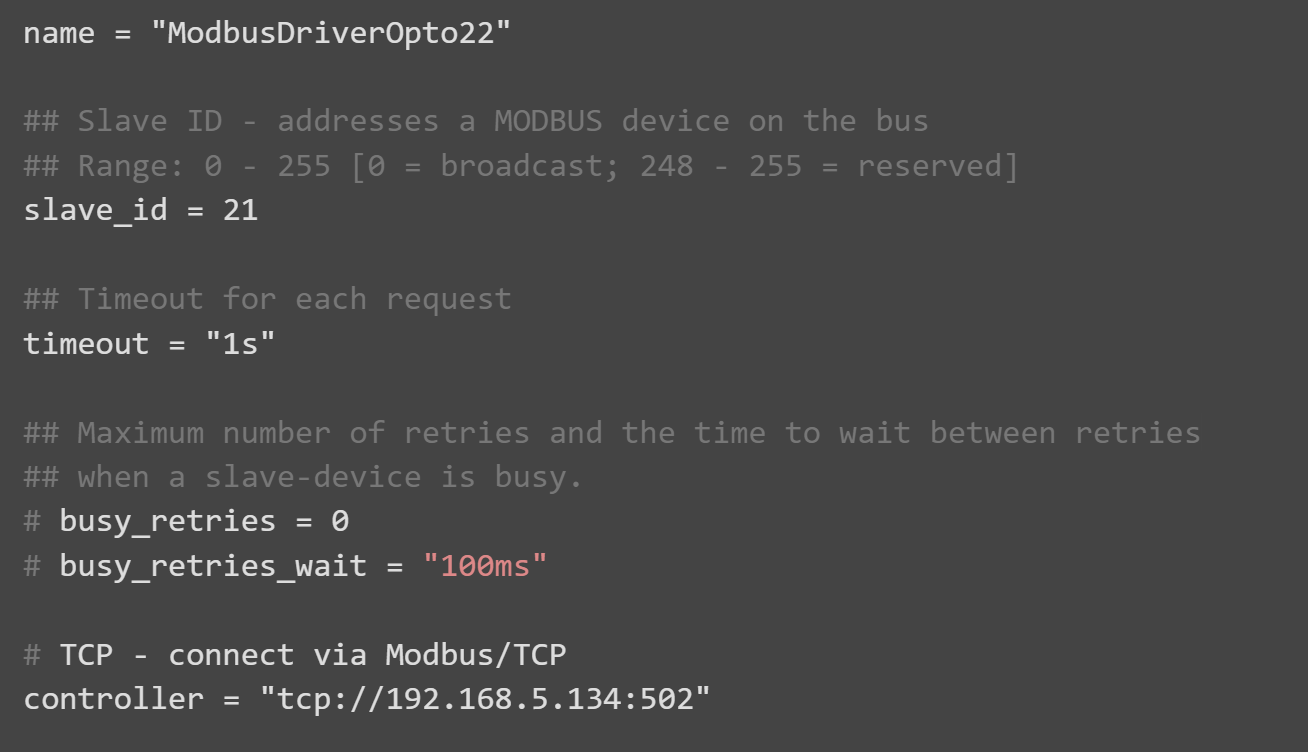
[[inputs.modbus]]
基本的にはこちらの設定をModbus TCP Serverの設定と合わせる必要があります。
ControllerはModbus TCP ServerのIPアドレスになります。
Slave id
Slave idはServer側に合わせて設定してください。
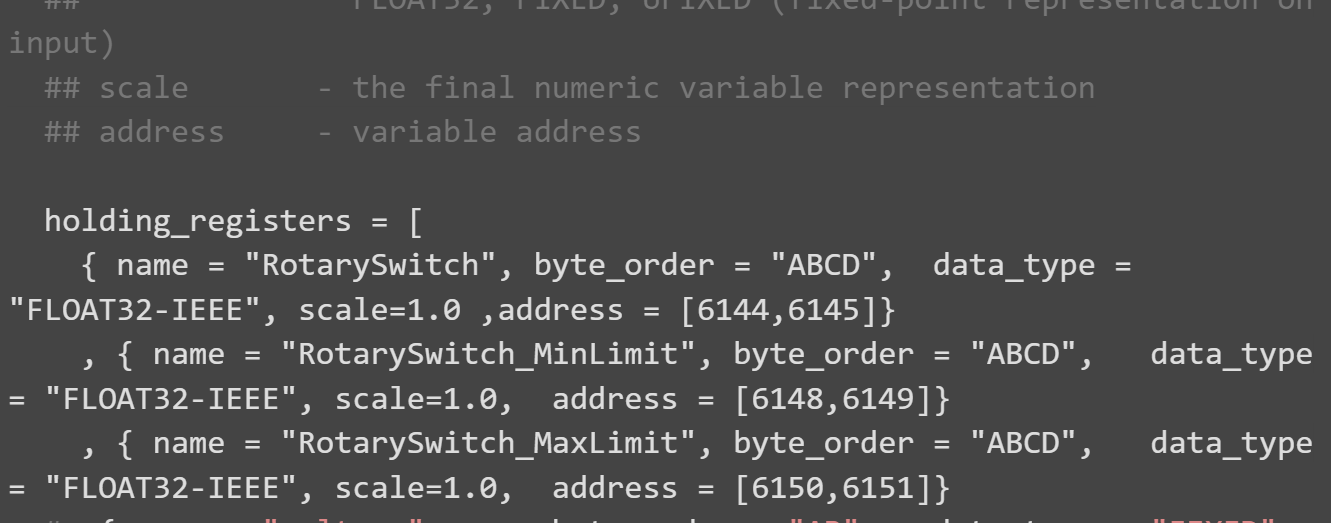
Register
Registerは実際にアプリケーション上でアクセスしたいRegisterを設定しましょう。
Result
Done!_measurementに”modbus”が増え、_fieldにはModus TCP ServerrのRegisterデータもありました。
Implementation 4MQTT
最後はTelegraf APPのConfigurationにMQTT Plginを追加し、groov EPIC CPUのMessageをSubscribeし、データをInfluxDBに保存します。

Reference Link
Opto22 Side
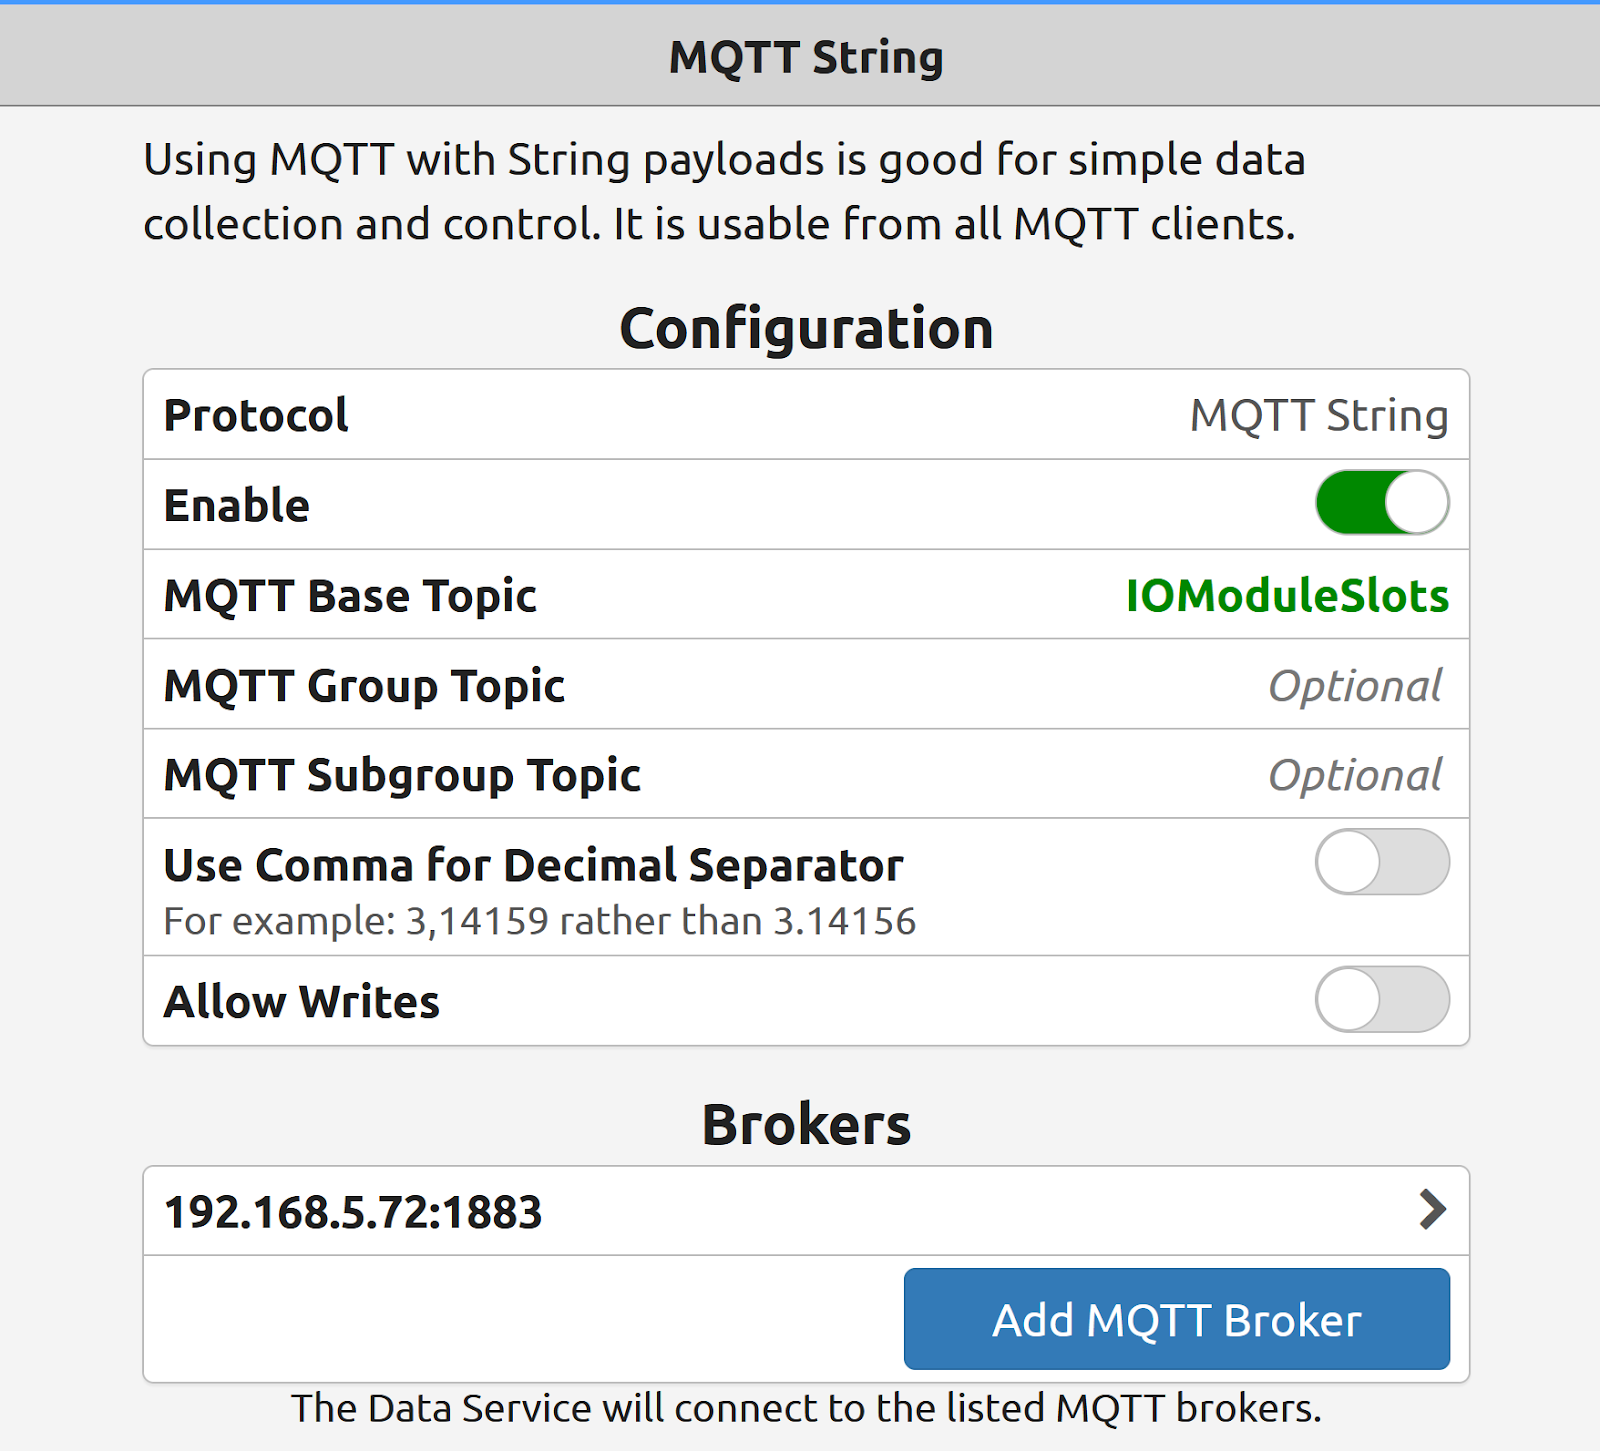
先ほどのReference Linkからも詳しい説明がありますが、今回の記事でも簡単な設定紹介だけさせていただきます。MQTT StringにMQTTを有効し、アクセスするMQTT Brokerなどを設定してください。
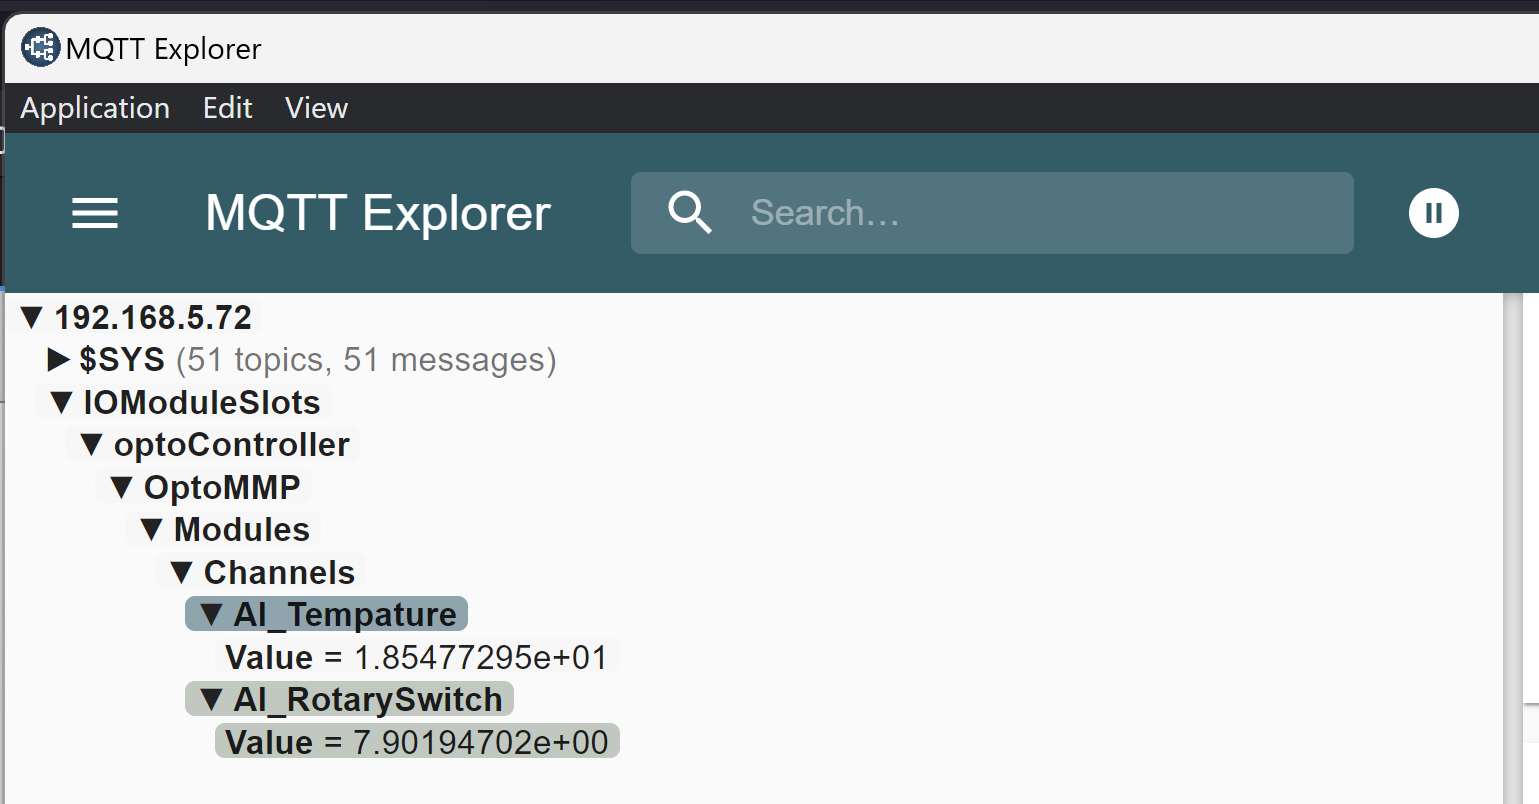
よし、OPTO22がPublishしたTopicが見えました。
ctrlX Side
Telegraf のMQTTPluginsを追加します。
Configuration
こちらはMQTT Pluginを追加したTelegraf Configurationになります。
| [agent] interval = “5s” round_interval = true flush_interval = “5s” ## Install InfluxDB at first ## Set up the InfluxDB with organization and initial bucket ## Log in the InfluxDB UI and get the token ## Configure the output plugin influxdb_v2 with these datas [[outputs.influxdb_v2]] urls = [“https://127.0.0.1/influxdb”] token = “CquPrz9Vmbx-QgvMqGJgMVdHADDkjVAKZELRcANRKqWXRr-nxKQfVEGesQz6gad5GNV1neHdSMKfkd5eb5urkA==” organization = “mana” bucket = “mainBucket2” insecure_skip_verify = true ## Configure the input plugin with the username and password to ctrlX Core [[inputs.ctrlx_datalayer]] ## Hostname or IP address of the ctrlX CORE Data Layer server ## example: server = “localhost” # Telegraf is running directly on the device ## server = “192.168.1.1” # Connect to ctrlX CORE remote via IP ## server = “host.example.com” # Connect to ctrlX CORE remote via hostname ## server = “10.0.2.2:8443” # Connect to ctrlX CORE Virtual from development environment server = “192.168.5.67:8443” ## Authentication credentials username = “boschrexroth” password = “boschrexroth” ## Use TLS but skip chain & host verification insecure_skip_verify = true ## Timeout for HTTP requests. (default: “10s”) # timeout = “10s” ## Create a ctrlX Data Layer subscription. ## It is possible to define multiple subscriptions per host. Each subscription can have its own ## sampling properties and a list of nodes to subscribe to. ## All subscriptions share the same credentials. [[inputs.ctrlx_datalayer.subscription]] ## The name of the measurement. (default: “ctrlx”) measurement = “metrics” ## Configure the ctrlX Data Layer nodes which should be subscribed. ## address – node address in ctrlX Data Layer (mandatory) ## name – field name to use in the output (optional, default: base name of address) ## tags – extra node tags to be added to the output metric (optional) ## Note: ## Use either the inline notation or the bracketed notation, not both. ## The tags property is only supported in bracketed notation due to toml parser restrictions ## Examples: ## Inline notation nodes=[ {name=”cpu_usage_percent”, address=”framework/metrics/system/cpu-utilisation-percent”}, ] ## Bracketed notation # [[inputs.ctrlx_datalayer.subscription.nodes]] # name =”available” # address=”framework/metrics/system/memavailable-mb” # ## Define extra tags related to node to be added to the output metric (optional) # [inputs.ctrlx_datalayer.subscription.nodes.tags] # node_tag1=”node_tag1″ # node_tag2=”node_tag2″ # [[inputs.ctrlx_datalayer.subscription.nodes]] # name =”used” # address=”framework/metrics/system/memused-mb” ## The switch “output_json_string” enables output of the measurement as json. ## That way it can be used in in a subsequent processor plugin, e.g. “Starlark Processor Plugin”. # output_json_string = false ## Define extra tags related to subscription to be added to the output metric (optional) # [inputs.ctrlx_datalayer.subscription.tags] # subscription_tag1 = “subscription_tag1” # subscription_tag2 = “subscription_tag2” ## The interval in which messages shall be sent by the ctrlX Data Layer to this plugin. (default: 1s) ## Higher values reduce load on network by queuing samples on server side and sending as a single TCP packet. #publish_interval = “1s” ## The interval a “keepalive” message is sent if no change of data occurs. (default: 60s) ## Only used internally to detect broken network connections. # keep_alive_interval = “60s” ## The interval an “error” message is sent if an error was received from a node. (default: 10s) ## Higher values reduce load on output target and network in case of errors by limiting frequency of error messages. # error_interval = “10s” ## The interval that defines the fastest rate at which the node values should be sampled and values captured. (default: 1s) ## The sampling frequency should be adjusted to the dynamics of the signal to be sampled. ## Higher sampling frequence increases load on ctrlX Data Layer. ## The sampling frequency can be higher, than the publish interval. Captured samples are put in a queue and sent in publish interval. ## Note: The minimum sampling interval can be overruled by a global setting in the ctrlX Data Layer configuration (‘datalayer/subscriptions/settings’). #sampling_interval = “1s” ## The requested size of the node value queue. (default: 10) ## Relevant if more values are captured than can be sent. # queue_size = 10 ## The behaviour of the queue if it is full. (default: “DiscardOldest”) ## Possible values: ## – “DiscardOldest” ## The oldest value gets deleted from the queue when it is full. ## – “DiscardNewest” ## The newest value gets deleted from the queue when it is full. # queue_behaviour = “DiscardOldest” ## The filter when a new value will be sampled. (default: 0.0) ## Calculation rule: If (abs(lastCapturedValue – newValue) > dead_band_value) capture(newValue). # dead_band_value = 0.0 ## The conditions on which a sample should be captured and thus will be sent as a message. (default: “StatusValue”) ## Possible values: ## – “Status” ## Capture the value only, when the state of the node changes from or to error state. Value changes are ignored. ## – “StatusValue” ## Capture when the value changes or the node changes from or to error state. ## See also ‘dead_band_value’ for what is considered as a value change. ## – “StatusValueTimestamp”: ## Capture even if the value is the same, but the timestamp of the value is newer. ## Note: This might lead to high load on the network because every sample will be sent as a message ## even if the value of the node did not change. # value_change = “StatusValue” [[inputs.opcua]] ## Metric name name = “opcua” # ## OPC UA Endpoint URL endpoint = “opc.tcp://192.168.5.134:14840/groov” # ## Maximum time allowed to establish a connect to the endpoint. connect_timeout = “10s” # ## Maximum time allowed for a request over the estabilished connection. request_timeout = “5s” # ## Security policy, one of “None”, “Basic128Rsa15”, “Basic256”, ## “Basic256Sha256”, or “auto” security_policy = “None” # ## Security mode, one of “None”, “Sign”, “SignAndEncrypt”, or “auto” security_mode = “None” # ## Path to cert.pem. Required when security mode or policy isn’t “None”. ## If cert path is not supplied, self-signed cert and key will be generated. # certificate = “/etc/telegraf/cert.pem” # ## Path to private key.pem. Required when security mode or policy isn’t “None”. ## If key path is not supplied, self-signed cert and key will be generated. # private_key = “/etc/telegraf/key.pem” # ## Authentication Method, one of “Certificate”, “UserName”, or “Anonymous”. To ## authenticate using a specific ID, select ‘Certificate’ or ‘UserName’ # auth_method = “Anonymous” # ## Username. Required for auth_method = “UserName” # username = “” # ## Password. Required for auth_method = “UserName” # password = “” # ## Option to select the metric timestamp to use. Valid options are: ## “gather” — uses the time of receiving the data in telegraf ## “server” — uses the timestamp provided by the server ## “source” — uses the timestamp provided by the source # timestamp = “gather” # ## Node ID configuration ## name – field name to use in the output ## namespace – OPC UA namespace of the node (integer value 0 thru 3) ## identifier_type – OPC UA ID type (s=string, i=numeric, g=guid, b=opaque) ## identifier – OPC UA ID (tag as shown in opcua browser) ## tags – extra tags to be added to the output metric (optional) ## Example: ## {name=”ProductUri”, namespace=”0″, identifier_type=”i”, identifier=”2262″, tags=[[“tag1″,”value1”],[“tag2”,”value2]]} nodes = [ # {name=””, namespace=””, identifier_type=””, identifier=””}, # {name=””, namespace=””, identifier_type=””, identifier=””}, {name=”DIChannel0″,namespace=”2″,identifier_type=”s”,identifier=”Devices/[optoController]/OptoMMP/Modules/Channels/DI_CHANNEL0/State”} ,{name=”DIChannel1″,namespace=”2″,identifier_type=”s”,identifier=”Devices/[optoController]/OptoMMP/Modules/Channels/DI_CHANNEL1/State”} ,{name=”AIRotarySwitch”,namespace=”2″,identifier_type=”s”,identifier=”Devices/[optoController]/OptoMMP/Modules/Channels/AI_RotarySwitch/Value”} ,{name=”AITempature”,namespace=”2″,identifier_type=”s”,identifier=”Devices/[optoController]/OptoMMP/Modules/Channels/AI_Tempature/Value”} ] # ## Node Group ## Sets defaults for OPC UA namespace and ID type so they aren’t required in ## every node. A group can also have a metric name that overrides the main ## plugin metric name. ## ## Multiple node groups are allowed #[[inputs.opcua.group]] ## Group Metric name. Overrides the top level name. If unset, the ## top level name is used. # name = # ## Group default namespace. If a node in the group doesn’t set its ## namespace, this is used. # namespace = # ## Group default identifier type. If a node in the group doesn’t set its ## namespace, this is used. # identifier_type = # ## Node ID Configuration. Array of nodes with the same settings as above. # nodes = [ # {name=””, namespace=””, identifier_type=””, identifier=””}, # {name=””, namespace=””, identifier_type=””, identifier=””}, #] ## Enable workarounds required by some devices to work correctly # [inputs.opcua.workarounds] ## Set additional valid status codes, StatusOK (0x0) is always considered valid # additional_valid_status_codes = [“0xC0”] # Retrieve data from MODBUS slave devices [[inputs.modbus]] ## Connection Configuration ## ## The plugin supports connections to PLCs via MODBUS/TCP, RTU over TCP, ASCII over TCP or ## via serial line communication in binary (RTU) or readable (ASCII) encoding ## ## Device name name = “ModbusDriverOpto22” ## Slave ID – addresses a MODBUS device on the bus ## Range: 0 – 255 [0 = broadcast; 248 – 255 = reserved] slave_id = 21 ## Timeout for each request timeout = “1s” ## Maximum number of retries and the time to wait between retries ## when a slave-device is busy. # busy_retries = 0 # busy_retries_wait = “100ms” # TCP – connect via Modbus/TCP controller = “tcp://192.168.5.134:502” ## Serial (RS485; RS232) # controller = “file:///dev/ttyUSB0” # baud_rate = 9600 # data_bits = 8 # parity = “N” # stop_bits = 1 ## For Modbus over TCP you can choose between “TCP”, “RTUoverTCP” and “ASCIIoverTCP” ## default behaviour is “TCP” if the controller is TCP ## For Serial you can choose between “RTU” and “ASCII” # transmission_mode = “RTU” ## Trace the connection to the modbus device as debug messages ## Note: You have to enable telegraf’s debug mode to see those messages! # debug_connection = false ## Define the configuration schema ## |—register — define fields per register type in the original style (only supports one slave ID) ## |—request — define fields on a requests base configuration_type = “register” ## — “register” configuration style — ## Measurements ## ## Digital Variables, Discrete Inputs and Coils ## measurement – the (optional) measurement name, defaults to “modbus” ## name – the variable name ## address – variable address #discrete_inputs = [ # { name = “start”, address = [0]}, # { name = “stop”, address = [1]}, # { name = “reset”, address = [2]}, # { name = “emergency_stop”, address = [3]}, #] #coils = [ # { name = “motor1_run”, address = [0]}, # { name = “motor1_jog”, address = [1]}, # { name = “motor1_stop”, address = [2]}, #] ## Analog Variables, Input Registers and Holding Registers ## measurement – the (optional) measurement name, defaults to “modbus” ## name – the variable name ## byte_order – the ordering of bytes ## |—AB, ABCD – Big Endian ## |—BA, DCBA – Little Endian ## |—BADC – Mid-Big Endian ## |—CDAB – Mid-Little Endian ## data_type – INT16, UINT16, INT32, UINT32, INT64, UINT64, ## FLOAT32-IEEE, FLOAT64-IEEE (the IEEE 754 binary representation) ## FLOAT32, FIXED, UFIXED (fixed-point representation on input) ## scale – the final numeric variable representation ## address – variable address holding_registers = [ { name = “RotarySwitch”, byte_order = “ABCD”, data_type = “FLOAT32-IEEE”, scale=1.0 ,address = [6144,6145]} , { name = “RotarySwitch_MinLimit”, byte_order = “ABCD”, data_type = “FLOAT32-IEEE”, scale=1.0, address = [6148,6149]} , { name = “RotarySwitch_MaxLimit”, byte_order = “ABCD”, data_type = “FLOAT32-IEEE”, scale=1.0, address = [6150,6151]} # { name = “voltage”, byte_order = “AB”, data_type = “FIXED”, scale=0.1, address = [0]}, # { name = “energy”, byte_order = “ABCD”, data_type = “FIXED”, scale=0.001, address = [5,6]}, # { name = “current”, byte_order = “ABCD”, data_type = “FIXED”, scale=0.001, address = [1,2]}, # { name = “frequency”, byte_order = “AB”, data_type = “UFIXED”, scale=0.1, address = [7]}, # { name = “power”, byte_order = “ABCD”, data_type = “UFIXED”, scale=0.1, address = [3,4]}, ] # input_registers = [ # { name = “tank_level”, byte_order = “AB”, data_type = “INT16”, scale=1.0, address = [0]}, # { name = “tank_ph”, byte_order = “AB”, data_type = “INT16”, scale=1.0, address = [1]}, # { name = “pump1_speed”, byte_order = “ABCD”, data_type = “INT32”, scale=1.0, address = [3,4]}, # ] ## Enable workarounds required by some devices to work correctly # [inputs.modbus.workarounds] ## Pause between read requests sent to the device. This might be necessary for (slow) serial devices. # pause_between_requests = “0ms” ## Close the connection after every gather cycle. Usually the plugin closes the connection after a certain ## idle-timeout, however, if you query a device with limited simultaneous connectivity (e.g. serial devices) ## from multiple instances you might want to only stay connected during gather and disconnect afterwards. # close_connection_after_gather = false # Read metrics from MQTT topic(s) [[inputs.mqtt_consumer]] ## Broker URLs for the MQTT server or cluster. To connect to multiple ## clusters or standalone servers, use a separate plugin instance. ## example: servers = [“tcp://localhost:1883”] ## servers = [“ssl://localhost:1883”] ## servers = [“ws://localhost:1883”] servers = [“tcp://192.168.5.72:1883”] ## Topics that will be subscribed to. topics = [ “IOModuleSlots/optoController/OptoMMP/Modules/Channels/DI_CHANNEL0/State”, “IOModuleSlots/optoController/OptoMMP/Modules/Channels/AI_Tempature/Value”, “IOModuleSlots/optoController/OptoMMP/Modules/Channels/AI_RotarySwitch/Value”, “IOModuleSlots/optoController/Device Properties/Firmware Version”, “IOModuleSlots/optoController/Device Properties/Part Number” ] ## The message topic will be stored in a tag specified by this value. If set ## to the empty string no topic tag will be created. topic_tag = “topic” ## QoS policy for messages ## 0 = at most once ## 1 = at least once ## 2 = exactly once ## ## When using a QoS of 1 or 2, you should enable persistent_session to allow ## resuming unacknowledged messages. # qos = 0 ## Connection timeout for initial connection in seconds # connection_timeout = “30s” ## Maximum messages to read from the broker that have not been written by an ## output. For best throughput set based on the number of metrics within ## each message and the size of the output’s metric_batch_size. ## ## For example, if each message from the queue contains 10 metrics and the ## output metric_batch_size is 1000, setting this to 100 will ensure that a ## full batch is collected and the write is triggered immediately without ## waiting until the next flush_interval. # max_undelivered_messages = 1000 ## Persistent session disables clearing of the client session on connection. ## In order for this option to work you must also set client_id to identify ## the client. To receive messages that arrived while the client is offline, ## also set the qos option to 1 or 2 and don’t forget to also set the QoS when ## publishing. # persistent_session = false ## If unset, a random client ID will be generated. # client_id = “” ## Username and password to connect MQTT server. # username = “telegraf” # password = “metricsmetricsmetricsmetrics” ## Optional TLS Config # tls_ca = “/etc/telegraf/ca.pem” # tls_cert = “/etc/telegraf/cert.pem” # tls_key = “/etc/telegraf/key.pem” ## Use TLS but skip chain & host verification # insecure_skip_verify = false ## Data format to consume. ## Each data format has its own unique set of configuration options, read ## more about them here: ## https://github.com/influxdata/telegraf/blob/master/docs/DATA_FORMATS_INPUT.md data_format = “value” data_type = “float” |
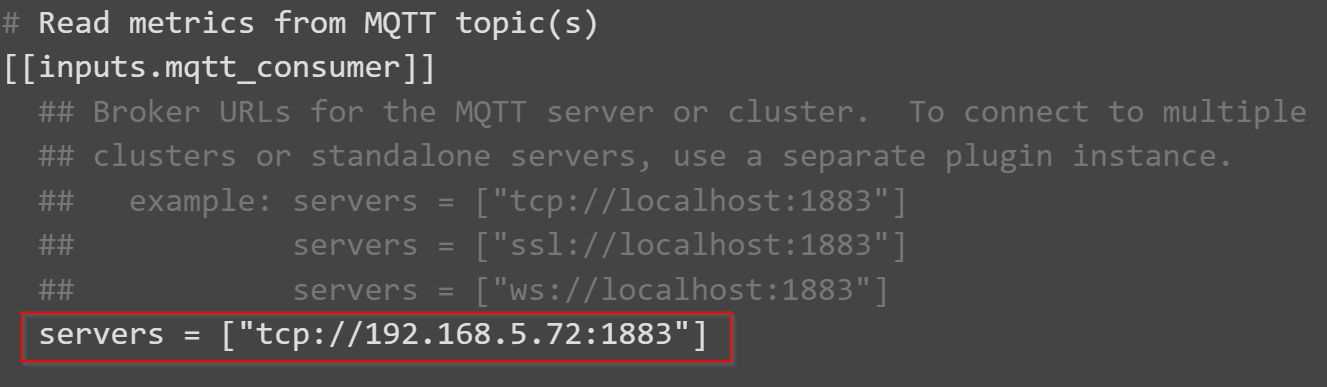
[[inputs.mqtt_consumer]]
MQTTの設定はBrokerやSubscribeしたいTopicに合わせて設定しましょう。
Servers
ServersはBrokerのIPアドレスとPortに設定します。
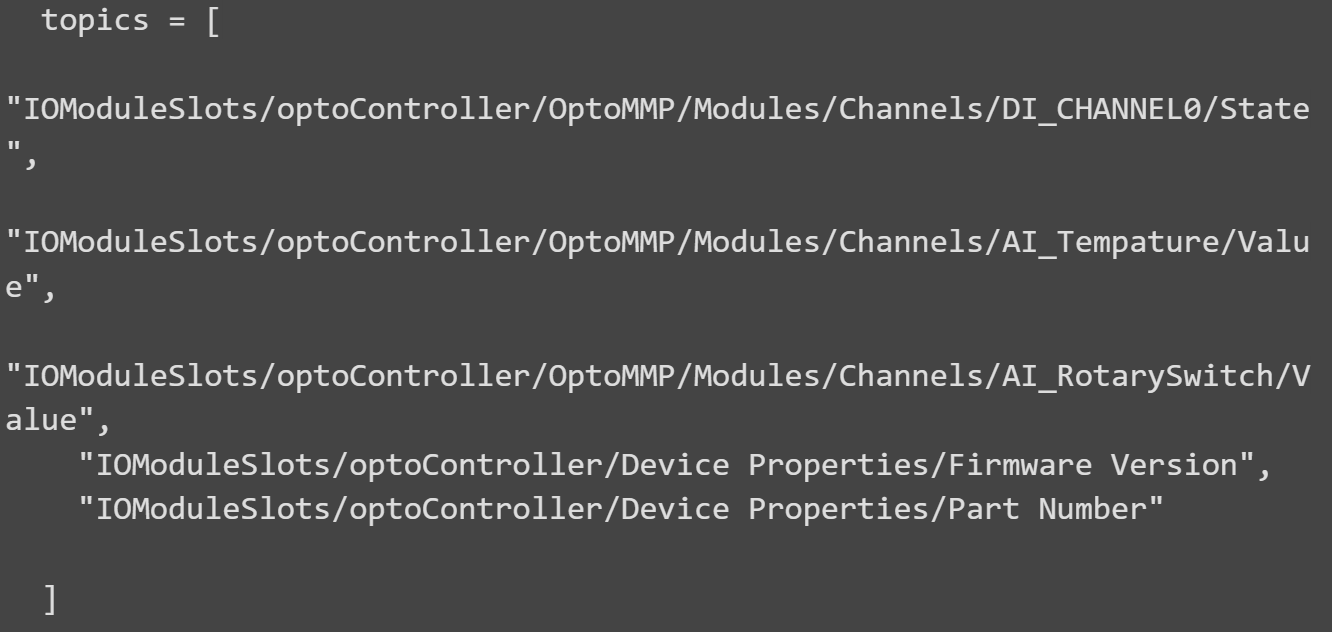
topics
TopicはSubscribeしたいものに合わせればよいです。
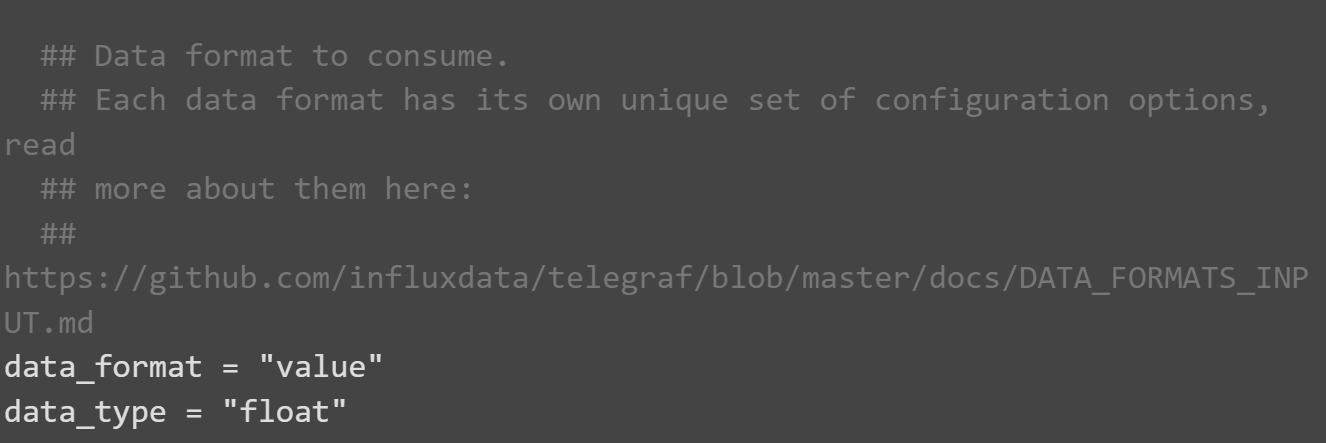
Data Format
Data Formatは今回は実数になります。
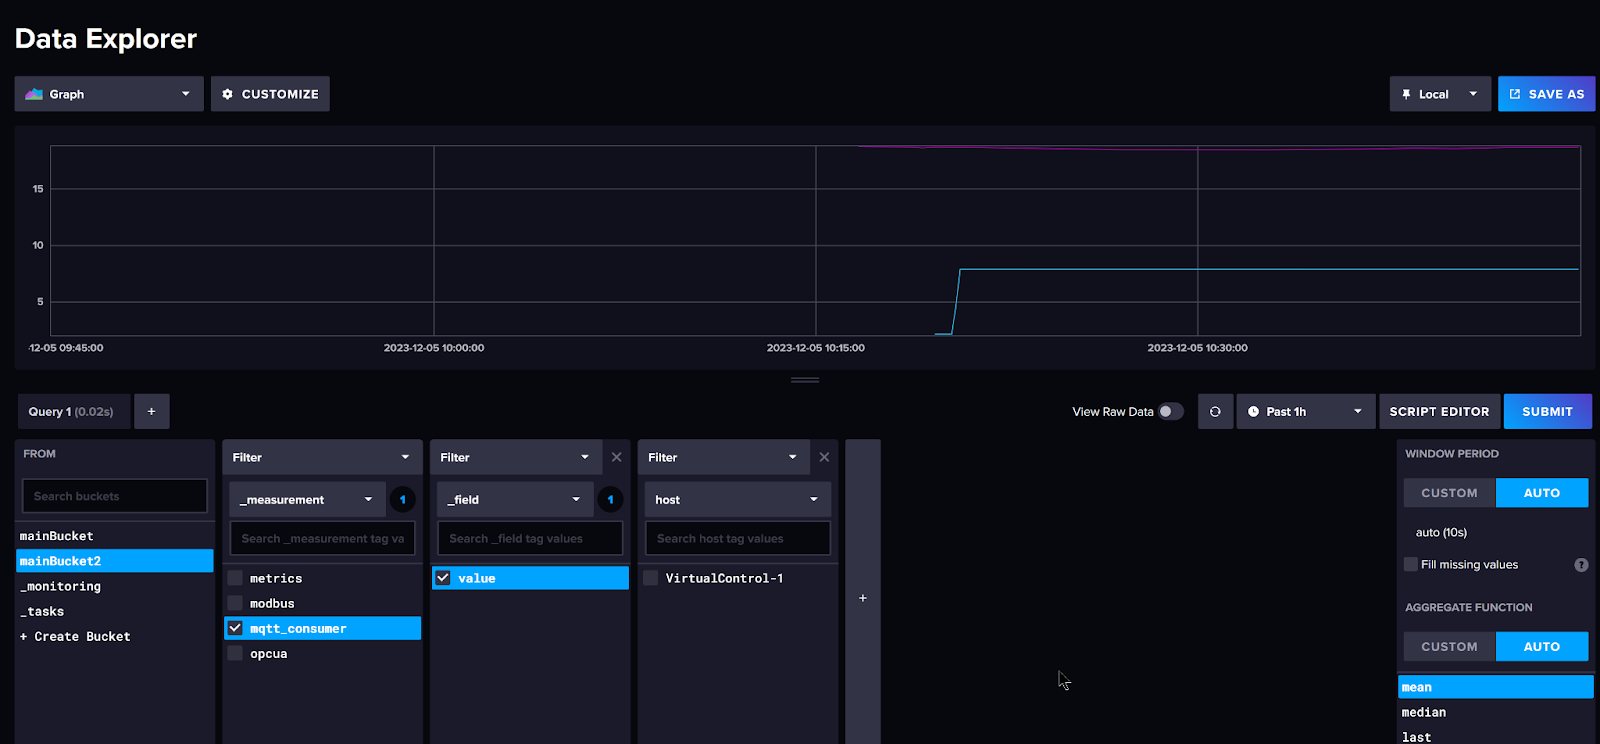
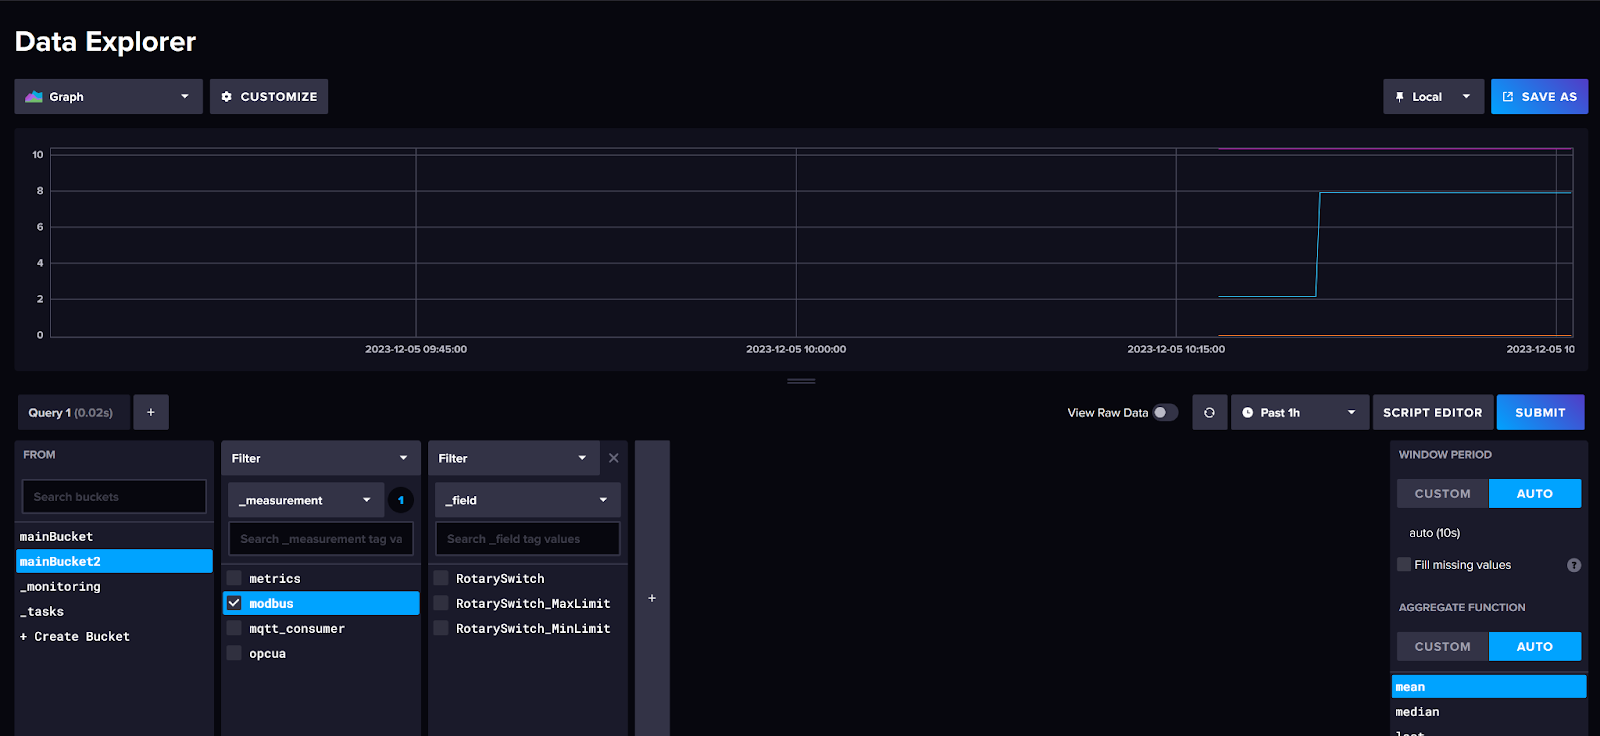
Result
Done!_measurementに”mqtt_consumer”が増え、_fieldにはSubscribeしたデータもありました。