This is the first episode of InfluxDB. First, we introduce basic InfluxDB concepts, install InfluxDB from Ubnutu’s Docker, operate the database from the command line, and try out InfluxDB and Node-red with the built-in EPC1522.
Let’s started!
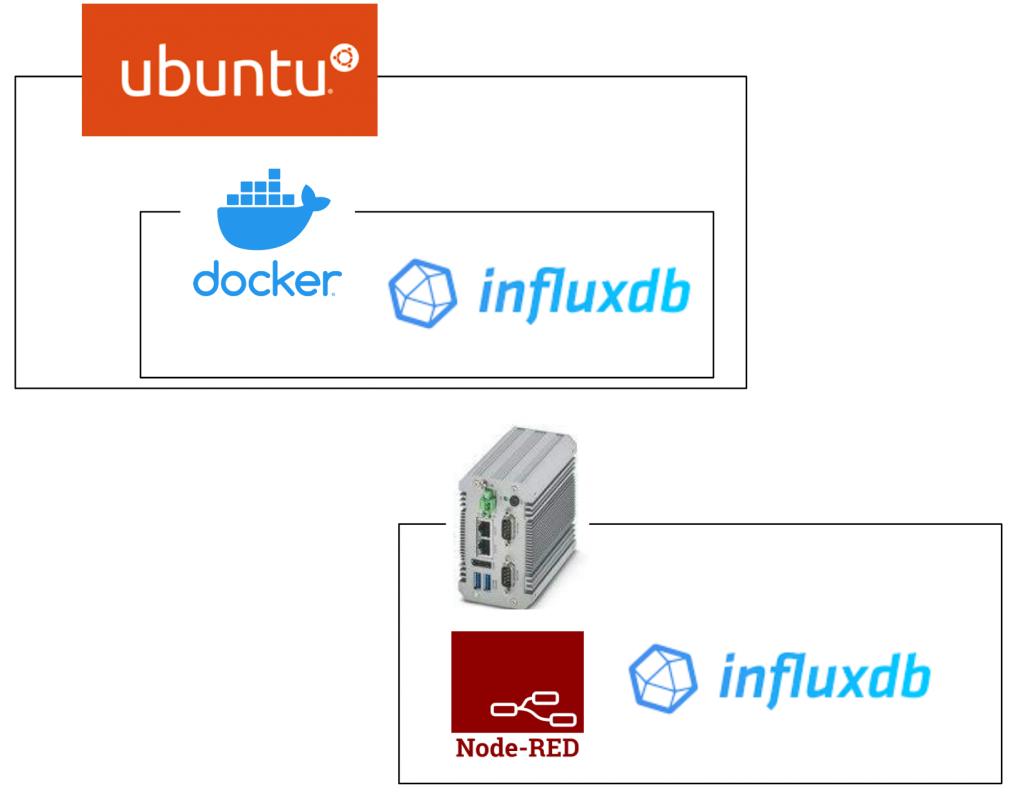
Thanks!
The EPC1522 Edge PC used in this article was loaned to us by Phoenix Contact Japan. Thank you very much.
Founded in Germany in 1923, Phoenix Contact is a global company with 20,300 employees at 55 locations worldwide.
With the concept “All Electric Society”, the company is committed to providing comprehensive electrification, networking and automation solutions in all industrial sectors. Phoenix Contact products are used in a variety of applications in industrial production facilities, infrastructure, energy and electronics connectivity.
Phoenix Contact Japan was established in Yokohama in December 1987 as the first local subsidiary in Asia, and currently operates from 10 sales offices in Japan.
HP.
https://www.phoenixcontact.com/ja-jp/
What is InfluxDB?
InfluxDB is an Open Source time series database. In a conventional Relational database, there are many tables in the database ,and each table is related to the image. On the other hand, InfluxDB is one of the time series databases that handles data with time information as the main key.
Time-series databases are often used in the IT world, for example, to monitor system memory, CPU utilization, disk capacity, and network tracking. In addition, it is convenient to handle sensor information over time with an IOT system, and it is easy to link with data visualization tools such as Grafana.
Elements
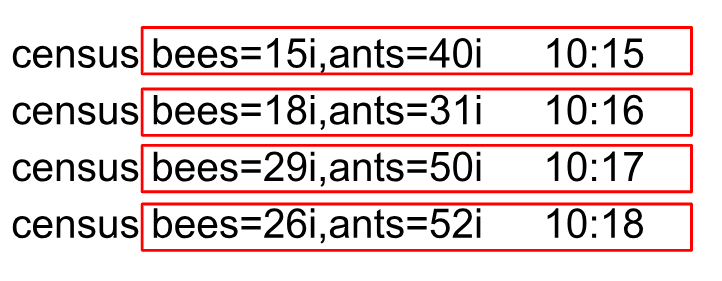
InfluxDB has various parts, but this article will only introduce some important parts. Let’s say we have time series data like this.
| _time | _measurement | localtion | station | _field | _value |
| 10:15 | census | TOKYO | T-1 | bees | 15 |
| 10:15 | census | OSAKA | O-1 | ants | 40 |
| 10:16 | census | TOKYO | T-1 | bees | 18 |
| 10:16 | census | OSAKA | O-1 | ants | 31 |
| 10:17 | census | TOKYO | T-1 | bees | 29 |
| 10:17 | census | OSAKA | O-1 | ants | 50 |
| 10:18 | census | TOKYO | T-1 | bees | 26 |
| 10:18 | census | OSAKA | O-1 | ants | 52 |
_time
It is the Timestamp. InfluxDB is a time-series database, so it’s natural to have a Timestamp. All data stored in InfluxDB has a _time, which stores the Timestamp when the data was written.
_measurement
The _measurement stored in String Format is census.
_field
A Field has a Field Key(_field)/Field Value(_value), and the combination of that Field Key x Field Value x Timestmap is a Field Set.
Field Key
Field Key is a string, in this example Field Key are bees and ants.
Field Value
Field Value will be the given value that represents the corresponding Field Key. Field Values can also be Strings, Floats, Integers and Bool. In this example the Field Values of Field Key bees are 15,18,29,26 and the Field Values of Field Key ants are 40,31,50,52.
Field Set
A field set is a field key-value combination that is further linked to a TimeStamp.
Tags
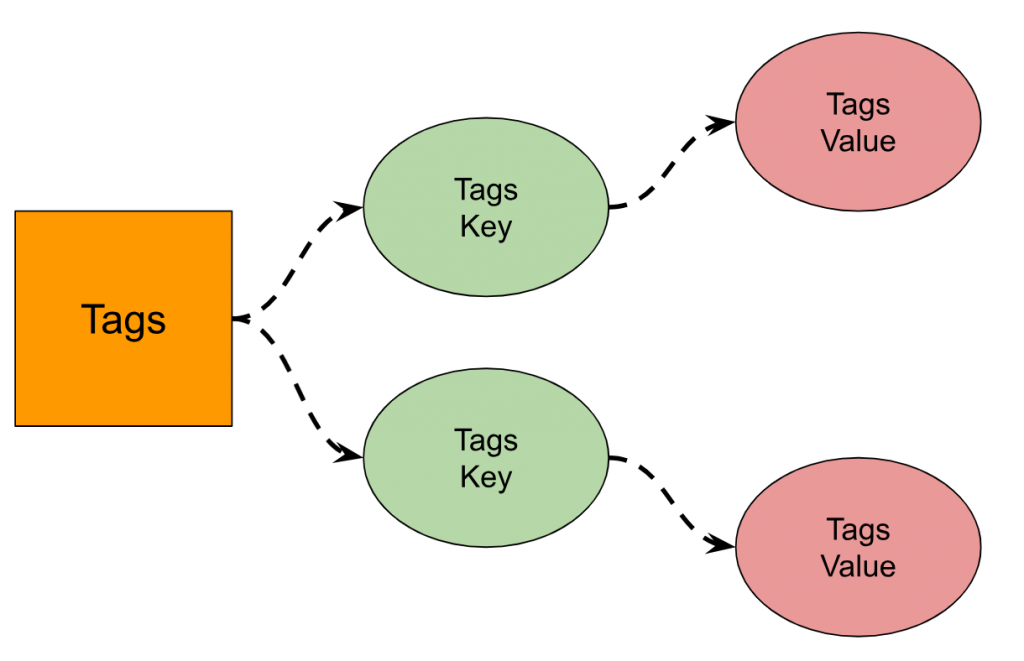
In the example data, location and station are “Tags”. Tags contain string Tag Keys and Tag Values.
Tags Key
The Tags Key is Station and Location, and there are two Tags Keys.
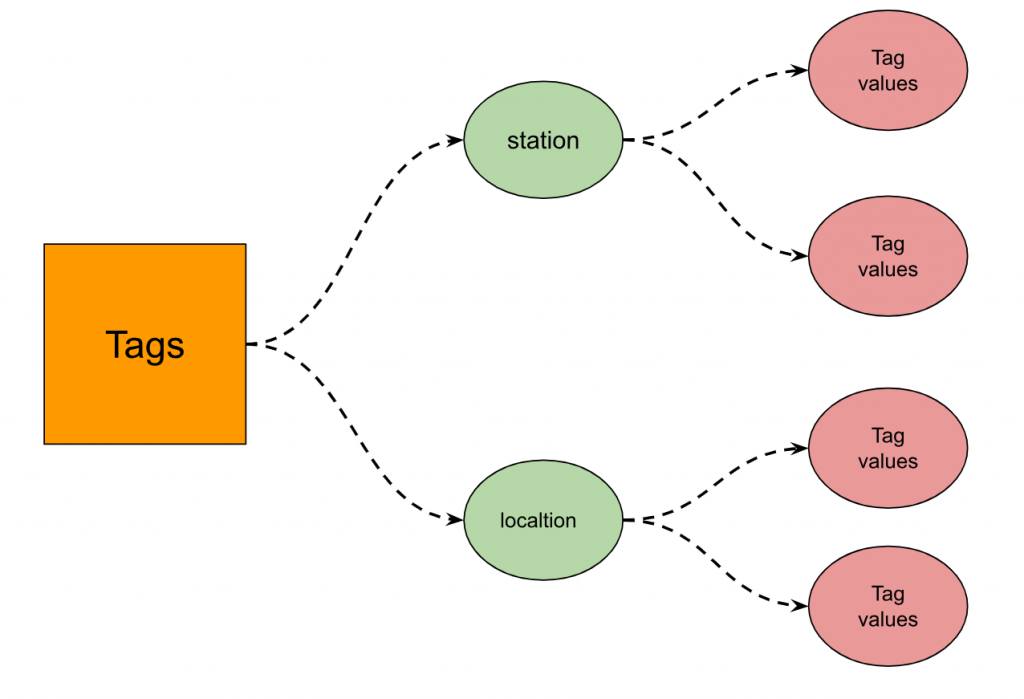
Tag Values
Station Tag Keys have Tag Values of T-1 and O-1, and location Tag Keys are Tag Values of TOKYO and OSAKA.
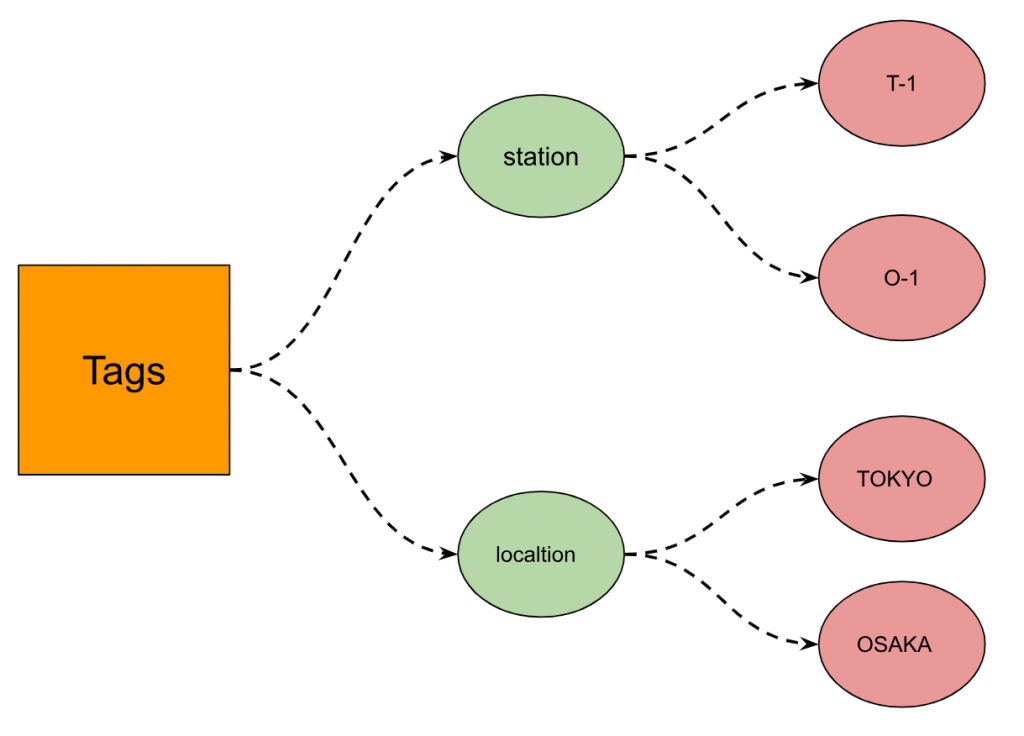
Tag sets
Tag sets are Tag key-value pairs. we have the following Tag sets:
| location=TOKYO,station=T-1 location=OSAKA,station=O-1 location=TOKYO,station=O-1 location=OSAKA,station=T-1 |
Organization
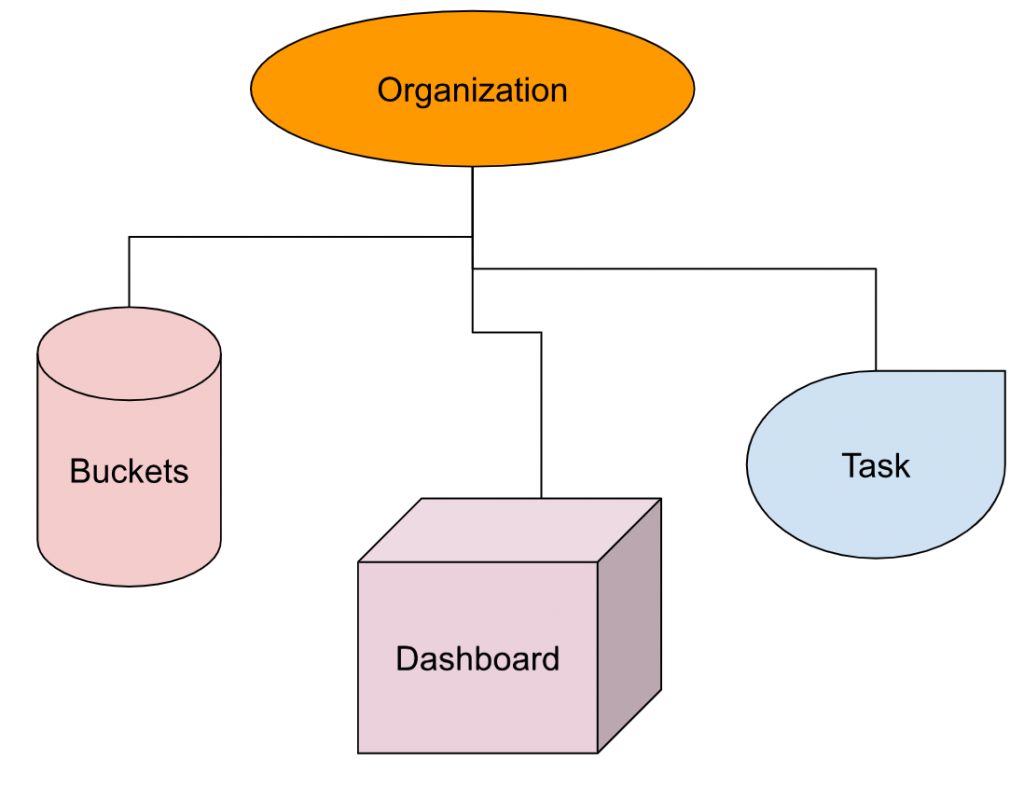
InfluxDB’s Organization is the User group’s Workspace. Organizations manage not only buckets, but also dashboards, tasks, etc. ,all these functions are managed by the organization.
Buckets
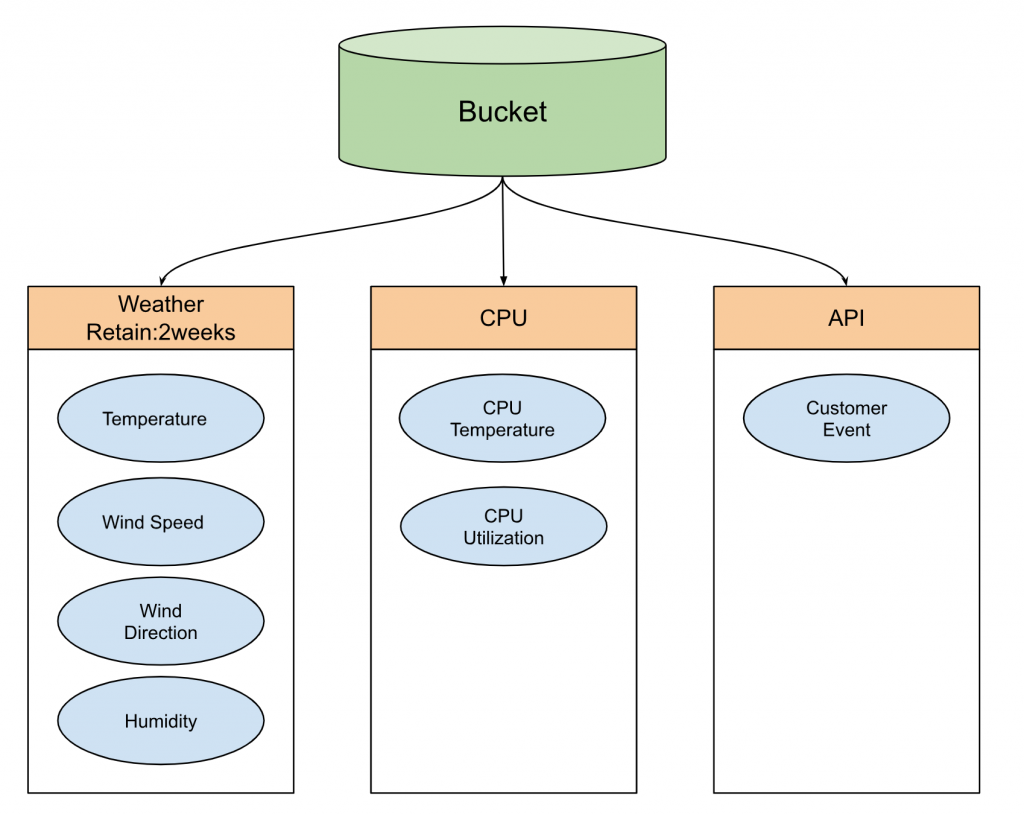
All InfluxDB data is stored in Buckets. The data stored in the Buckets will be saved forever until the set period. Let me give you another example. I am currently collecting weather data for some sites in the last 2 weeks, the information of my cpu will be saved inside the Bucket forever, and some API data is triggered by Customer.
Play with Docker First!
Ubuntu Version
Here is my Ubuntu Version and 220.04 LTS is used.
Docker Installation
Please follow this link to install Docker.
Install InfluxDB Docker
Use this command to install influxdb Docker.
| sudo docker pull influxdb |
Start the InfluxDB Server
Launch InfluxDB Docker by this command.
Port is 8086,USERNAME=my-user,PASSWORD=my-password.
| sudo docker run -p 8086:8086 \ -v influxdb:/var/lib/influxdb \ -v influxdb2:/var/lib/influxdb2 \ -e DOCKER_INFLUXDB_INIT_MODE=upgrade \ -e DOCKER_INFLUXDB_INIT_USERNAME=my-user \ -e DOCKER_INFLUXDB_INIT_PASSWORD=my-password \ -e DOCKER_INFLUXDB_INIT_ORG=my-org \ -e DOCKER_INFLUXDB_INIT_BUCKET=my-bucket \ influxdb |
Please access this link from chrome.
username=my-user,password=my-password
Check the Condition
Use this Command to the status of Docker.
| sudo docker ps |
COTANIER IDとIMAGEはinfluxdbが見えるはずです。
Exectute
Start the InfluxDB command line.
| sudo docker exec –it 35e2597700b4 /bin/bash |
35e2597700b4 is the same as the CONTAINER ID identified earlier.
Check Version
Check the InfluxDB Version. The InfluxDB Image Version is now 2.4.0.
| root@35e2597700b4:/# influx version Influx CLI 2.4.0 (git: 5c7c34f) build_date: 2022-08-18T19:26:48Z |
Check Configuration
InfluxDB URL, Check if it is enabled.
| root@35e2597700b4:/# influx config Active Name URL Org * default http://localhost:8086 |
Create Organization
First try creating an Organisation.
The Server returns a 401 error and says that access without authentication is not allowed.
| root@35e2597700b4:/# influx org create -n soup01 Error: failed to create org “soup01”: 401 Unauthorized: unauthorized access |
Authentication
Do the authentication first. Access the InfluxDB Server Dashboard as described earlier.
Click on my-user’s Token.
You have a Token.” Copy the Token using the “COPY TO CLIPBOARD” button.
The following command defines the INFLUX_TOKEN variable and pastes the Token of the destination.
| root@35e2597700b4:/# export INFLUX_TOKEN=Zknskd0l6yGlcu-WlkTfMWBBIdsqR7V7RpznIB3Aal03bs0BIr5Cnnnm-h1_NbzS-EjxsOU-nYcvOgiR801QbQ== |
Create Organization Again
You can create an Organisation by running it again with the same command as before and adding -t $INFLUX_TOKEN as the last parameter.
| root@35e2597700b4:/# influx org create -n soup01 -t $INFLUX_TOKEN ID Name 39f953d4a69e707e soup01 |
Check again in the Dashboard – click on Switch Organisations.
A popup is displayed and a new Organisation for soup01 has been created!
Check Organization List
The same can also be found on the command line.
| root@35e2597700b4:/# influx org list ID Name 39f953d4a69e707e soup01 64eeccdac1a33dcd my-org |
If a duplicate Organisation name is created, an error 422 is returned.
| root@35e2597700b4:/# influx org create -n soup01 Error: failed to create org “soup01”: 422 Unprocessable Entity: organization with name soup01 already exists |
Create the Buckets
Create new Buckets.
| root@35e2597700b4:/# influx bucket create -n soup01 -o my-org -t $INFLUX_TOKEN |
Create Data
We can create the data by this command.
- Organization my-org、Buckets ST2、myHostでtestField=”testData”
- Organization my-org、Buckets ST2、myHostでtestField=”testData2”
- Organization my-org、Buckets ST2、myHostでtempature=30.5
- Organization my-org、Buckets ST2、myHostでtempature=30.7
| root@5e024f1d1590:/# influx write -b ST2 -o my-org -p s -t $INFLUX_TOKEN ‘myMeasurement,host=myHost testField=”testData”‘ root@5e024f1d1590:/# influx write -b ST2 -o my-org -p s -t $INFLUX_TOKEN ‘myMeasurement,host=myHost testField=”testData2″‘ root@5e024f1d1590:/# influx write -b ST2 -o my-org -p s -t $INFLUX_TOKEN ‘myMeasurement,host=myHost temperature=30.5’ root@5e024f1d1590:/# influx write -b ST2 -o my-org -p s -t $INFLUX_TOKEN ‘myMeasurement,host=myHost temperature=30.7’ |
Check Query
Create a Query and retrieve data.
Retrieve data from bucket ST2 in Organisation my-org for the last hour!
| root@5e024f1d1590:/# influx query -o my-org ‘from (bucket:”ST2″) |> range(start:-1h)’ Result: _result Table: keys: [_start, _stop, _field, _measurement, host] _start:time _stop:time _field:string _measurement:string host:string _time:time _value:float —————————— —————————— ———————- ———————- ———————- —————————— —————————- 2022-10-02T13:19:46.301108942Z 2022-10-02T14:19:46.301108942Z temperature myMeasurement myHost 2022-10-02T14:07:04.000000000Z 30.5 2022-10-02T13:19:46.301108942Z 2022-10-02T14:19:46.301108942Z temperature myMeasurement myHost 2022-10-02T14:17:18.000000000Z 30.7 Table: keys: [_start, _stop, _field, _measurement, host] _start:time _stop:time _field:string _measurement:string host:string _time:time _value:string —————————— —————————— ———————- ———————- ———————- —————————— ———————- 2022-10-02T13:19:46.301108942Z 2022-10-02T14:19:46.301108942Z testField myMeasurement myHost 2022-10-02T14:00:32.000000000Z testData 2022-10-02T13:19:46.301108942Z 2022-10-02T14:19:46.301108942Z testField myMeasurement myHost 2022-10-02T14:06:08.000000000Z testData2 root@5e024f1d1590:/# |
Check in dashboard
It can also be checked via Checkbox.
ST2>myMeasurement>testField>choose testField>testField, select Medium last” >click SUBMIT and issue QUERY.
ST2>myMeasurement>testField>temperature, select Medium>click SUBMIT and issue QUERY.
Play with EPC1522!
Next, try it from InfluxDB and NodeRed, which are built into Phoenix Contact.
Check Status
First, check whether InfluxDB is Running from Edge>Dashboard.
Configuration
Access the https://yourip:8086 from Chrome.
Get Started starts the configuration.
The initial USER screen is displayed.
Enter the USER information and Continue.
Done!
Quick Start completes the process.
Node-red
Access Node-Red via the following Link.
This time, the Plug-in is used to interact with InfluxDB.
Create Data
Put the data on InfluxDB Buckets. Add the Influx batch Node on the left to the Flow screen.
The Influx batch Node is added and double-clicked.
Set the Sever to be accessed.
Server
Click on the pen ICON in the Server’s Field.
Name is the Node name to be displayed in Node-Red and does not have to be entered.
Version
Set the Version of the relevant Server in the Version Field. In this case, set it to V2.0.
URL
For the URL Field enter Https://yourIP:8086.
Token
Enter Token.
To check the Token Key, go to the InfluxDB Dashboard and double-click on Data>Tokens>User name.
Copy the Token and paste it into the previous Token Field.
Organization
You also need to access the InfluxDB Dashboard to check the Organisation.
Under User>User name is the Organisation.
Bucket
The next step is to set up the Bucket.
Dashboard>Explorer lists the Buckets that are now managed in the Organisation.
The buckets used in this case are called Station1.
Function
Add Function Nodes to Flow with Node-Red.
Open Function Node.
Paste this Code.
| msg.payload = [ { measurement: “weather_sensor”, fields: { temp: 5.5, light: 481, humidity: 51 }, tags:{ location:”garden” }, timestamp: new Date() }, { measurement: “alarm_sensor”, fields: { proximity: 1003, temp: 19.5 }, tags:{ location:”home” }, timestamp: new Date() } ]; return msg; |
Concepts
The previous Message actually sends such a message to InfluxDB.
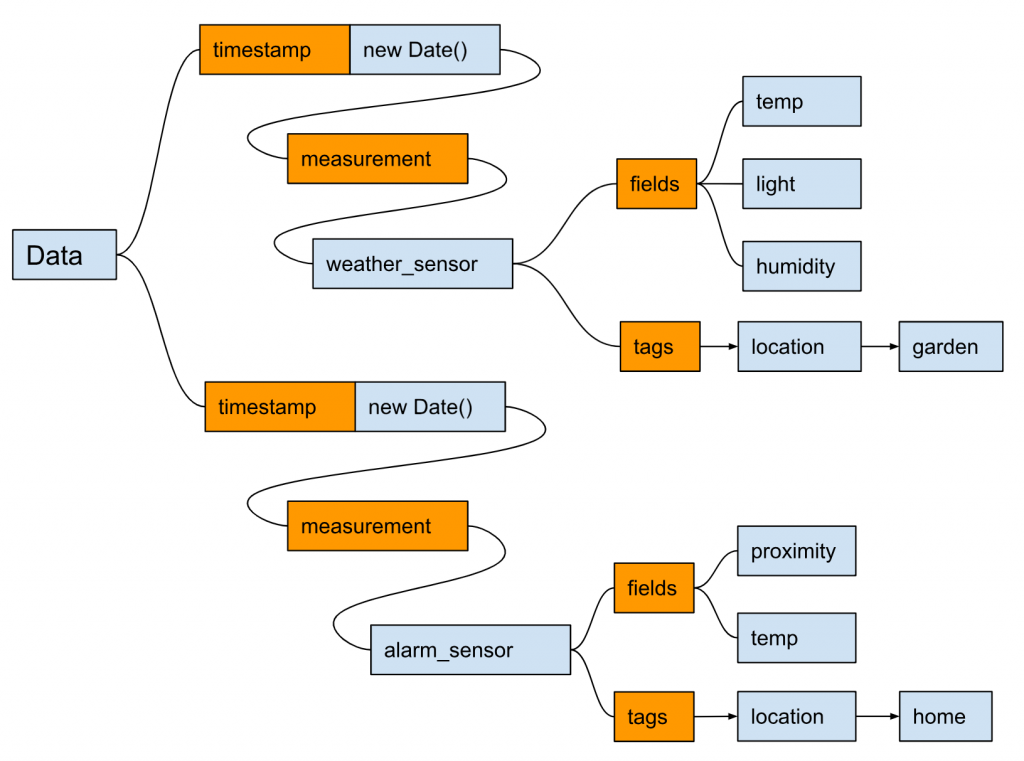
Inject
Add an inject Node to create a Trigger for sending data to InfluxDB.
Set Delay of activation to Inject once after x seconds.
Select Interval for Repeat and set >Cycle time to 1s, i.e. it will be triggered every 1s.
Connect the three Nodes.
Deploy
Download the Flow using the Deloy bodan in the top right-hand corner.
Check it
Check the data from Explore>Data Explorer.
Create a Query. Think of that Query as a request to retrieve data. Select all of the _field and _measurement.
Data is now displayed in Graph above when the Submit button is clicked!
Query Data
The next step is to create a Query request from Node-Red.
Add the Node of influxdb into Flow.
Flow
The Flow is not much different from the previous one.
Function
Paste the following Code into the Function’s Node.
Extract 1 hour of data in the temp field of weather_sensor of _measurement from bucket name “Station1”.
| msg.query = ` from(bucket: “Station1”) |> range(start: -1h, stop: now()) |> filter(fn: (r) => r._measurement == “weather_sensor”) |> filter(fn: (r) => r._field == “temp”) ` return msg; |
debug
Add a debug Node from the Common Node, as you want to see the results.
Test it
Finally, click Inject to confirm the reply.
You have received a reply from the Server with the data you requested!