This article explains how to set up the Corvina Cloud cloud services with EXOR panel from the beginning from the EXOR panel to the Platform.
Let’s start!
Corvina Cloud?
Corvina Cloud is a VPN solution that allows remote management of a wide variety of remote devices connected to Corvina’s servers via a gateway.Corvina Cloud is a VPN solution that allows users and machines through a global network like the Internet. It is a software platform designed for connecting users and machines through a global network like the Internet, and includes everything needed for central monitoring of factories and machines.
Solution Architecture
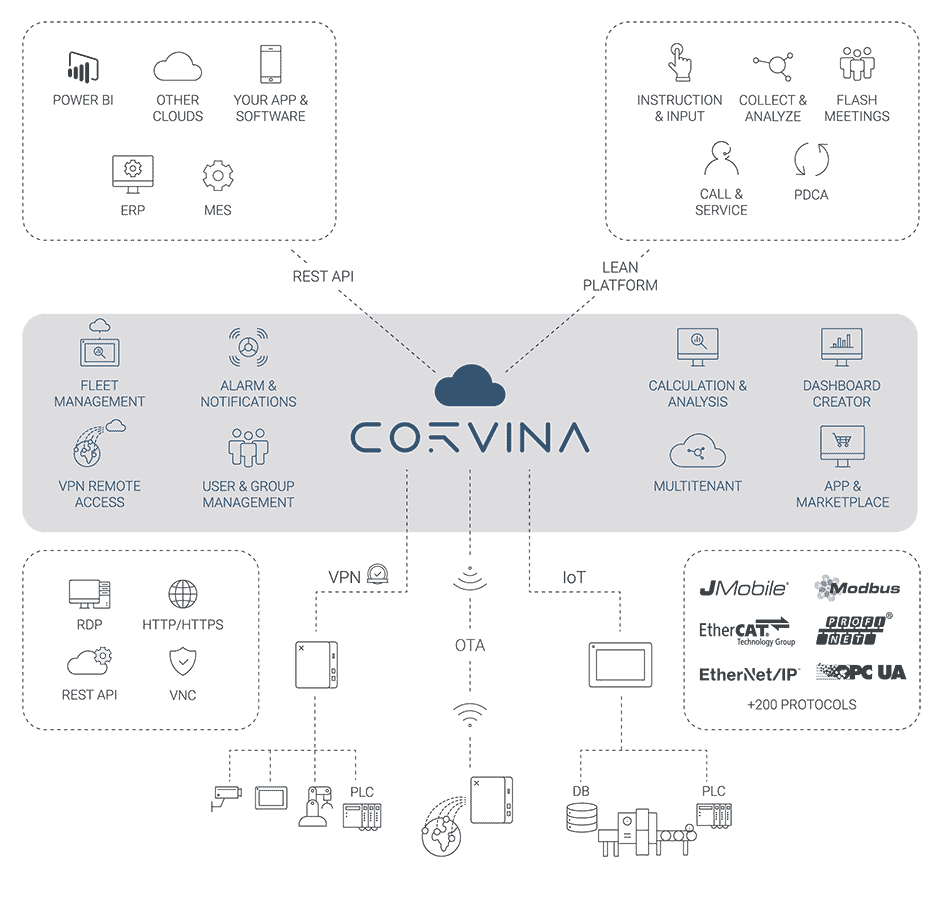
CORVINA is a cloud-based, all-in-one data management platform and management shell for distributed edge systems. Within it, it integrates data collection, monitoring and control, configuration management, integrated web tools, and programming environments to support machines and applications throughout their lifecycle.
It connects products, factories, systems, and machines, new and old, to process and analyze data generated by the IoT in a simple and intuitive way.
Architecture Overview
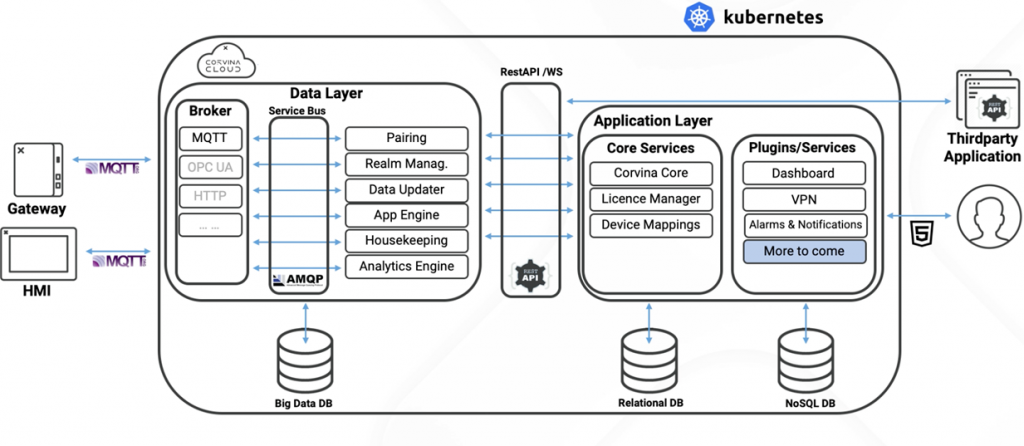
CORVINA is based on Kubernetes and devices connect to the cloud using MQTT through software called EXOR JMobile. This data moves to the application layer, where services such as device user management, dashboards, VPNs, and additional plug-in services are available. The Rest API is also available to connect Corvina to third-party services and applications.
In fact, the Corvina SDK allows the User to create their own widgets and data analysis tailored to their applications. using the Rest API, Corvina can access information collected in the cloud and connect to software, apps, private databases software, apps, and connections to private databases.
Main services
REMOTE ACCESS
Remote Access VPN allows you to easily and securely connect to devices and the machines to which they are connected.
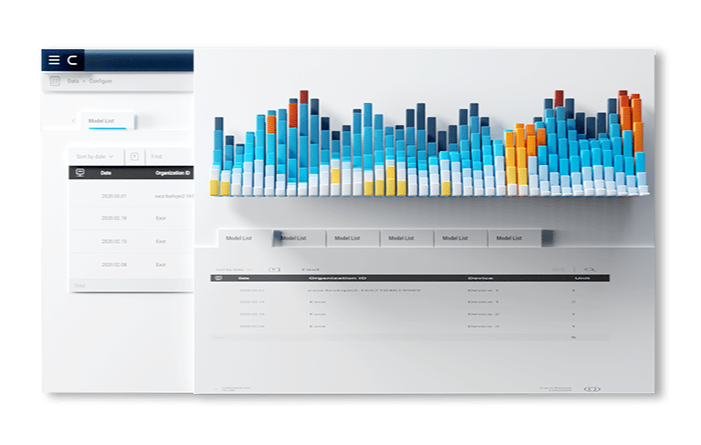
IoT DATA COLLECTION & ANALISYS
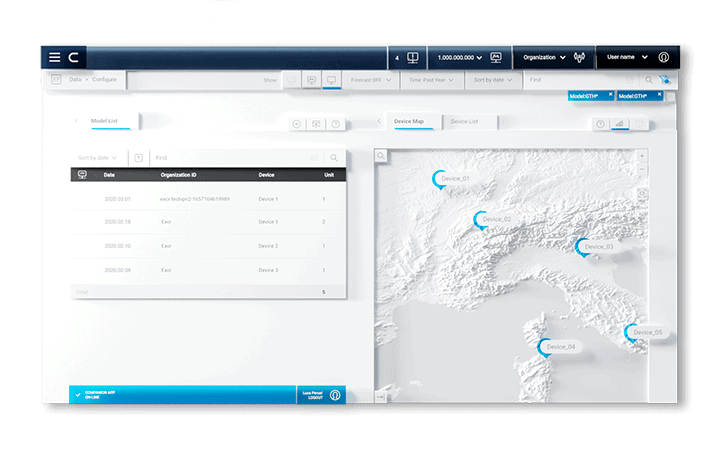
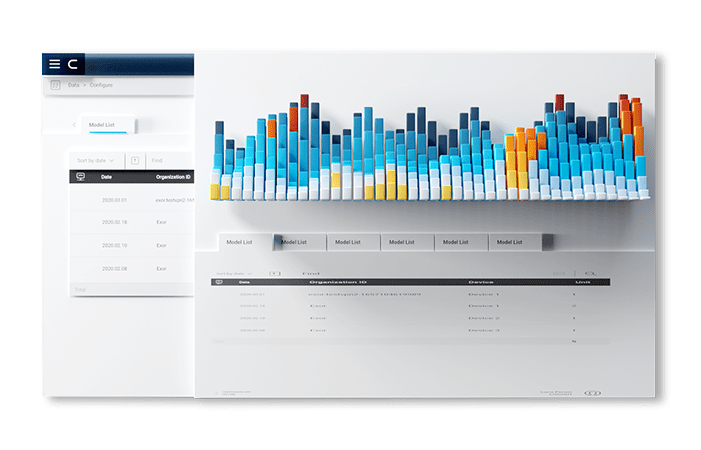
Data is sent from the device to the cloud, stored, and visualized in a web-based dashboard. Dashboards can be easily created and edited by users through a drag-and-drop interface, and no programming knowledge is required.
Reference Link
Get Activation code
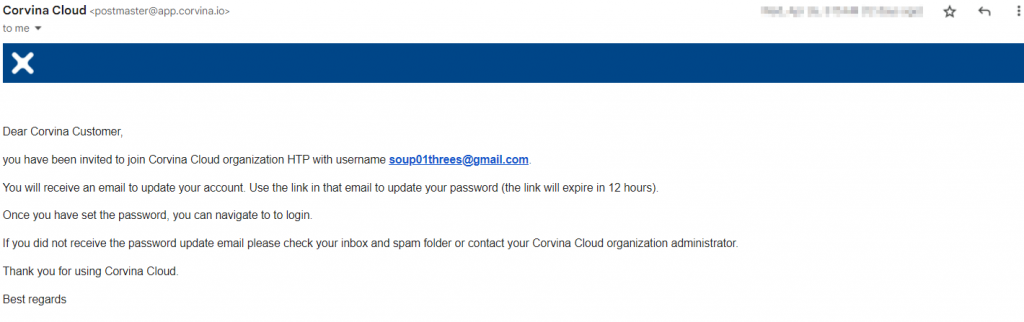
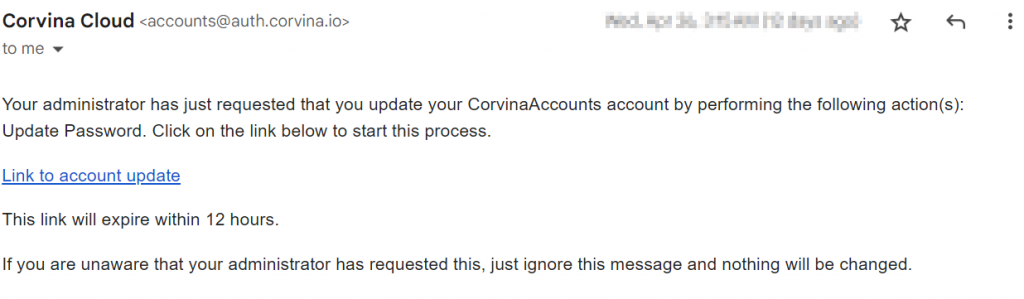
To use Corvina, first request an Activation Code from EXOR.
You will receive an email from EXOR Corvina, and you will need to “Link to account update” to set up your account.
Configuration
Before using Corvina, the EXOR panel requires some configuration.
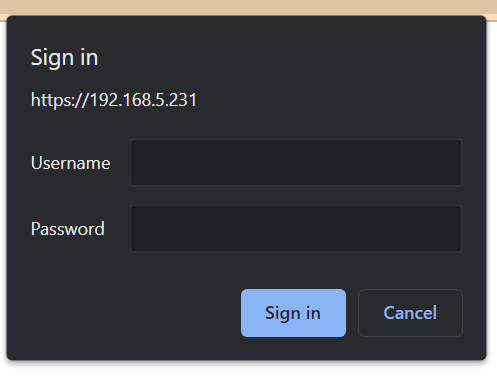
Go to the following link to configure the EXOR panel settings.
https://192.168.5.231/machine_config/
Wireless
First, we need to configure the wireless setup:In my tutorial, LAN Interface is connected to Fieldbus, and Wireless is connected to the Internet.
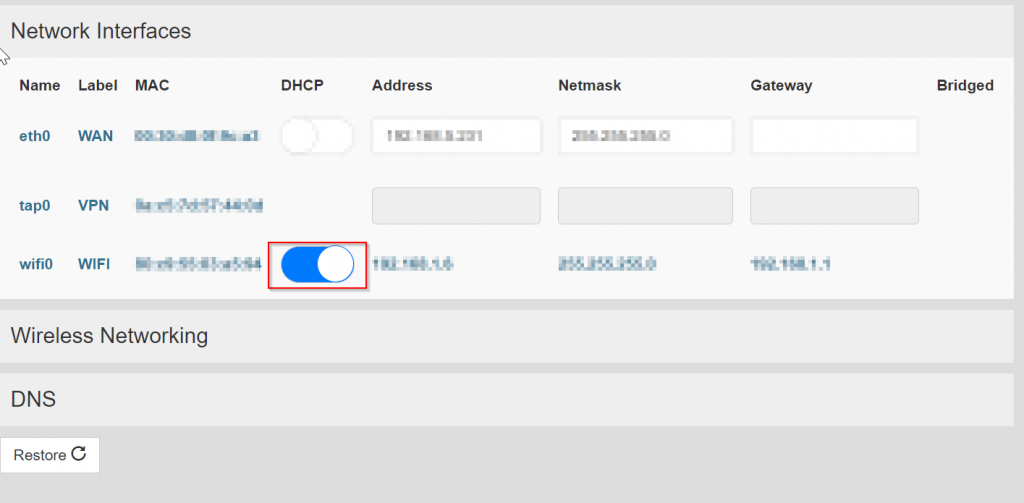
There is wifi0 in Networks>Network Interface.
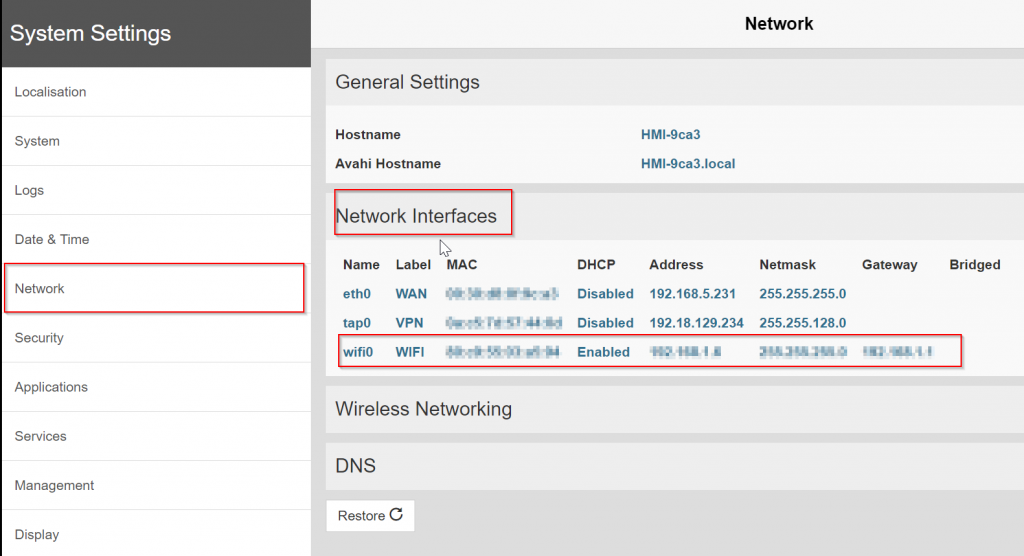
Click EDIT to change settings.
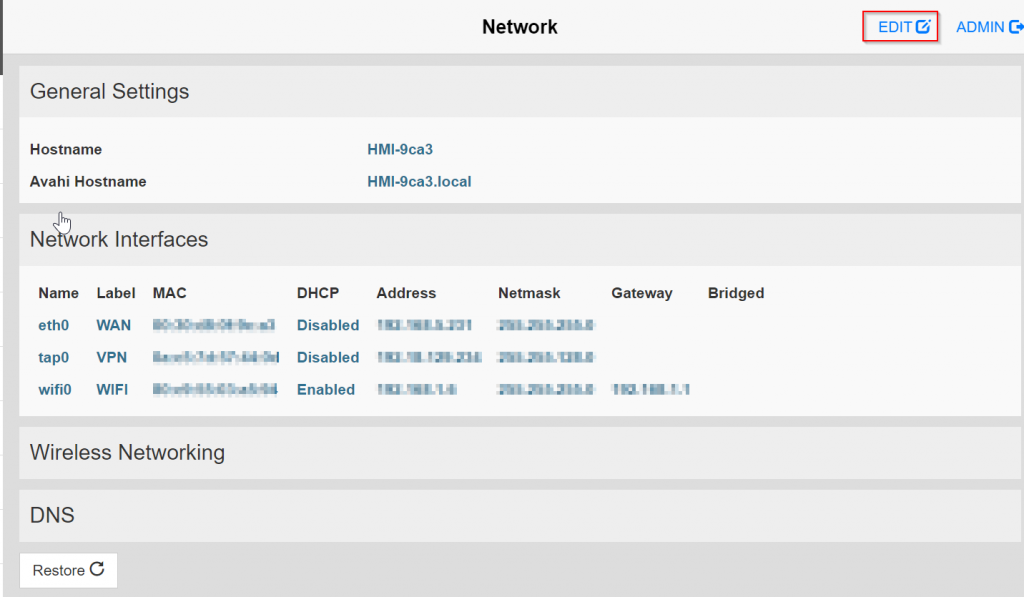
Enable DHCP functionality for wifi0.
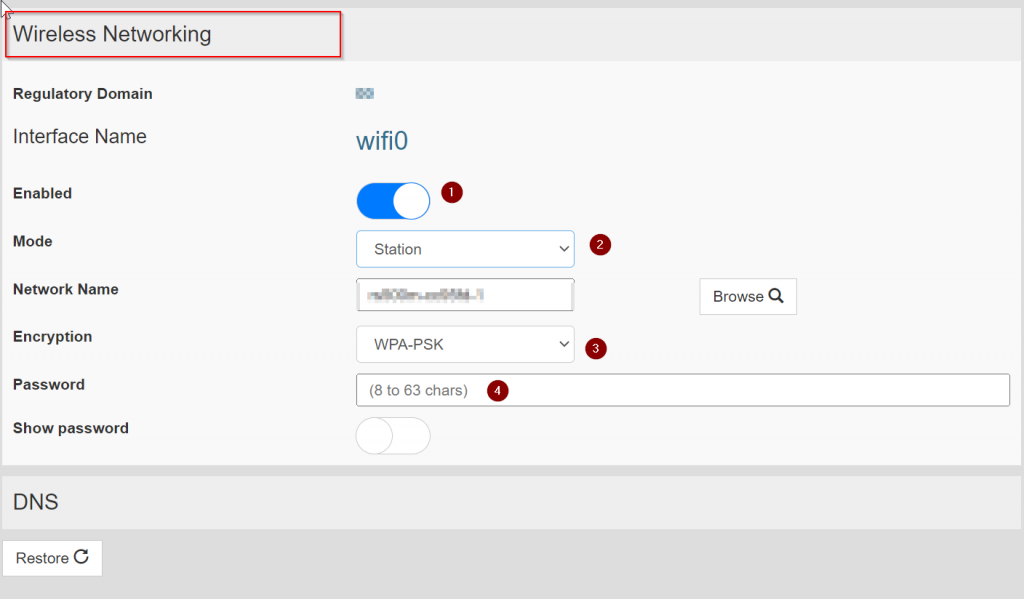
Next, open the Field of Wireless Networking.
- Enable the Wireless Interface.
- Set Mode to Station.
- Network Name is the SSID of the Access Point to which the network is connected.
- Leave WPA-PSK as it is for Encryption.
- Password is the Access Point’s password.
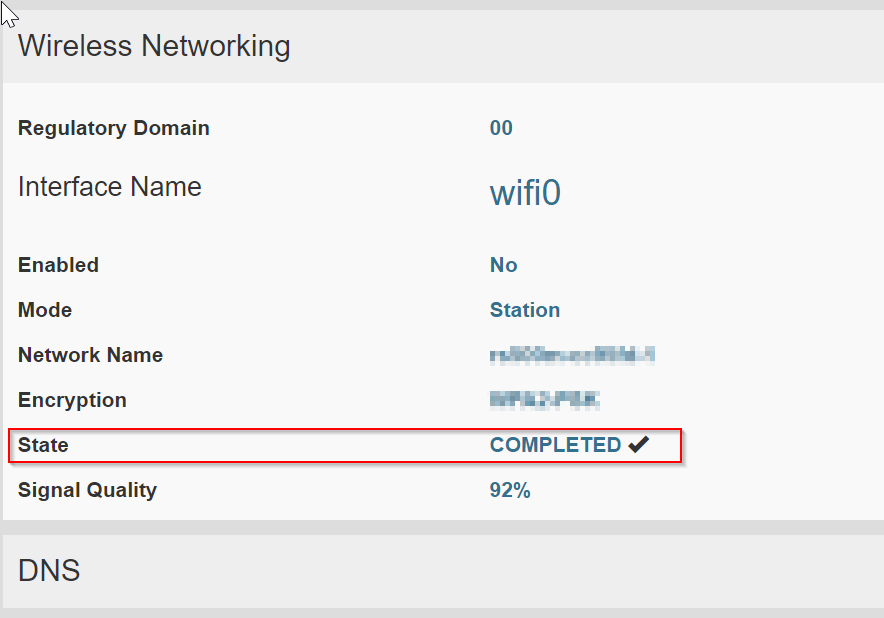
State is OK if COMPLETED is displayed.
Enable Cloud
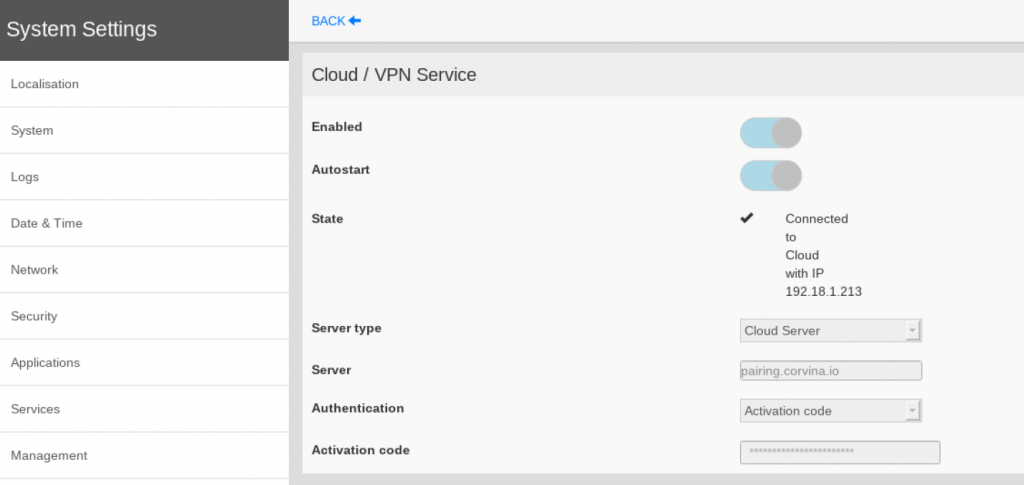
Then we can enable Cloud Services in the EXOR panel by Open Services>Cloud/VPN Services.
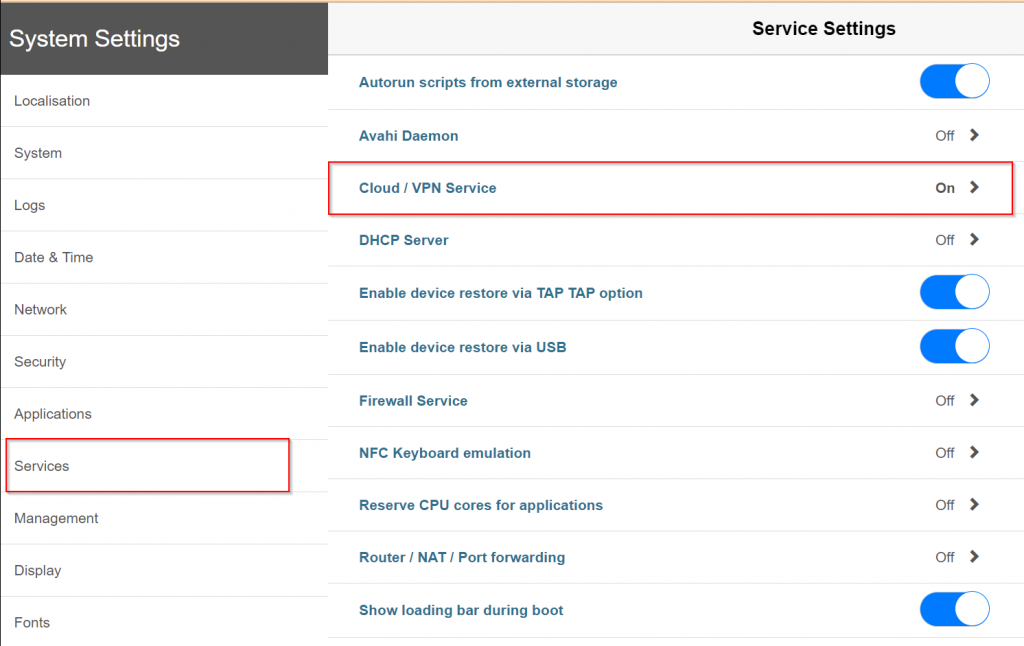
Change Cloud/VPN Services settings by clicking the EDIT button..
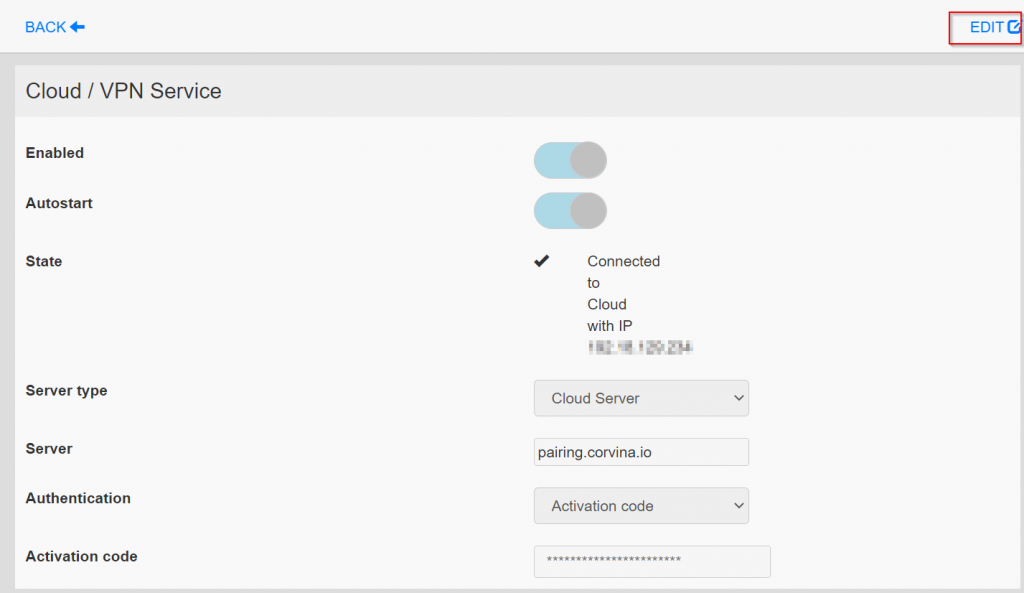
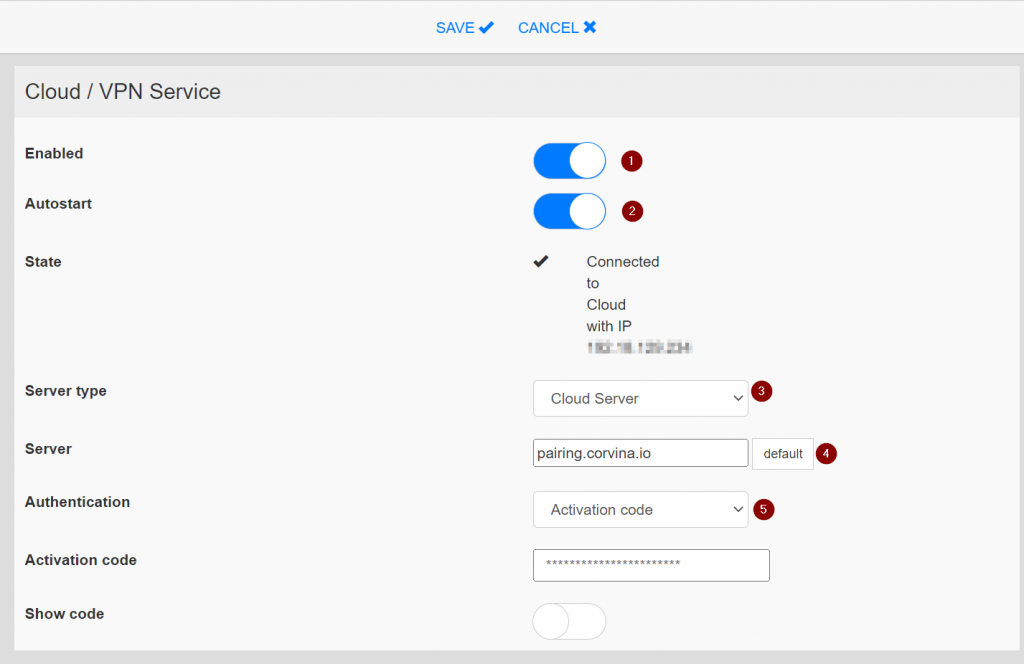
Enable Cloud/VPN Services like this.
- Turn on Enabled and Autostart.
- Select Cloud Server for Service type.
- Set Server to pairing.corvina.io.
- Select Activation code for Authentication option.
- For Activation code, enter the code that you just received in the email.
JMOBILE SIDE
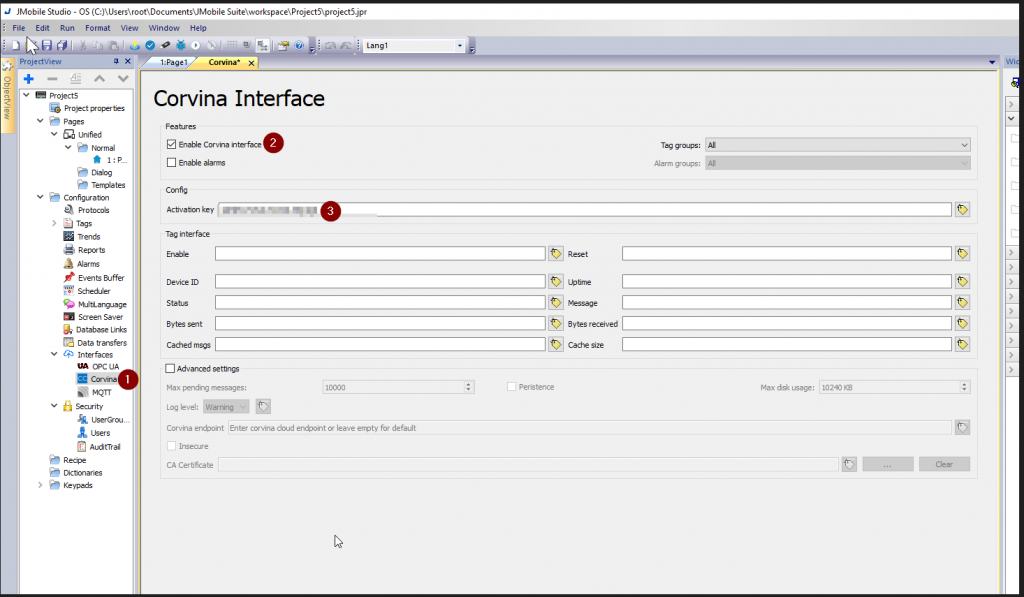
Enable Corvina Interface
Open Configuration>interface>Corvina and check the Enable Corvina Interface check box, and enter the activation key in the same way as the activation code entered for Cloud/VPN.
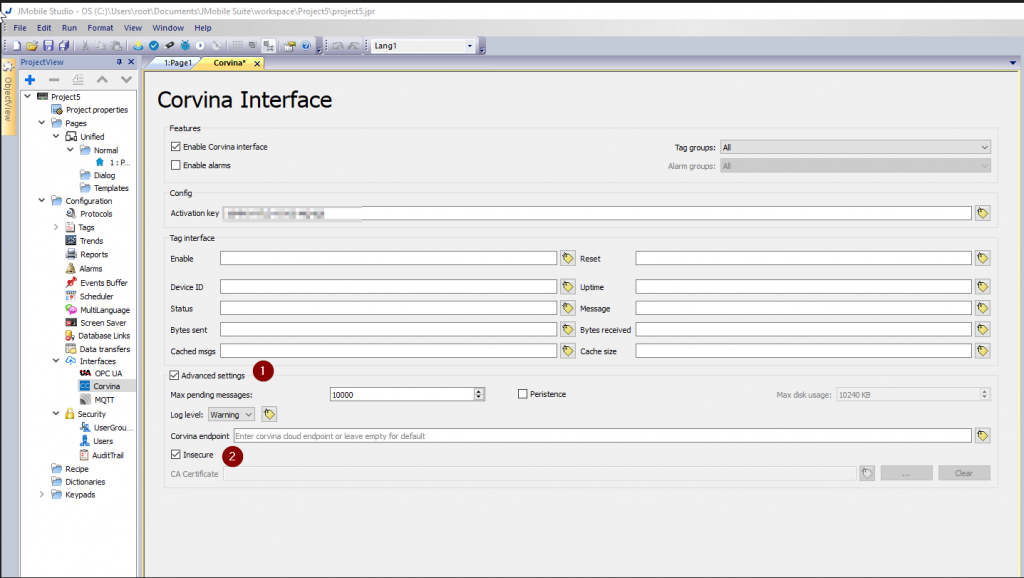
Also activate the Checkbox in Advanced settings and Check the “Insecure” Option.
Update the runtime
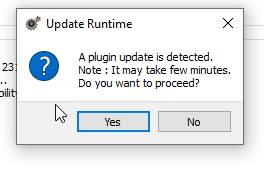
Next, update Runtime in the EXOR panel.
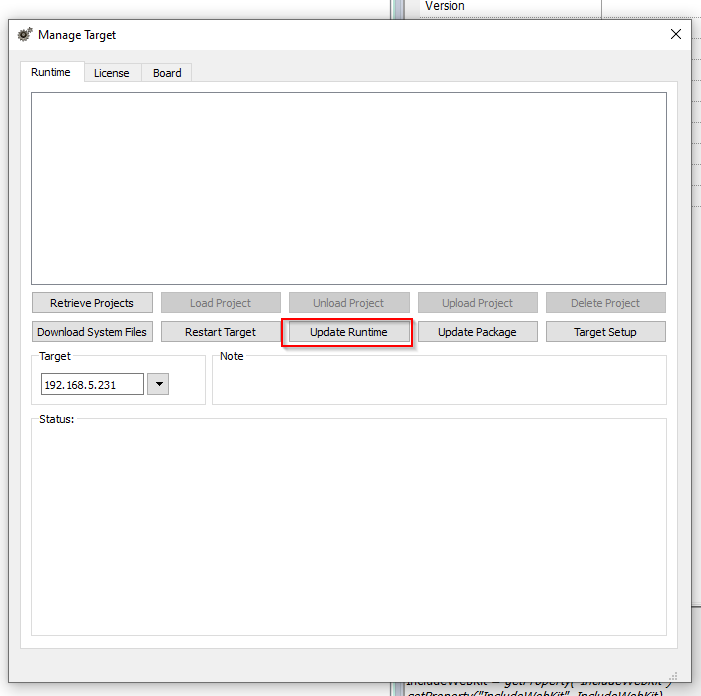
Add the Plugin with Yes.
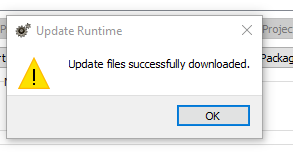
Done!
Configure
Active
Go to the following link to Activate the EXOR panel.
Click on the ICON in the red frame.
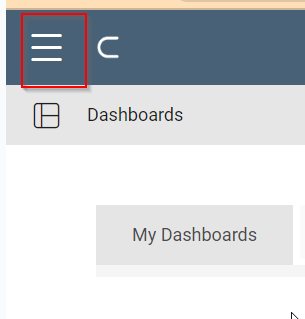
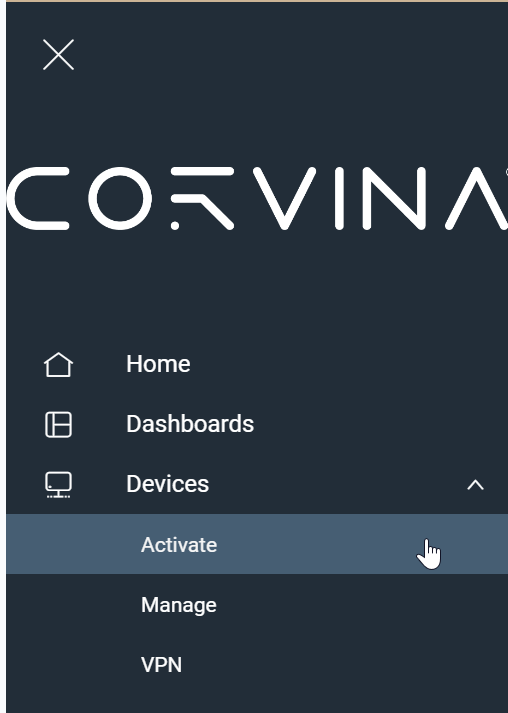
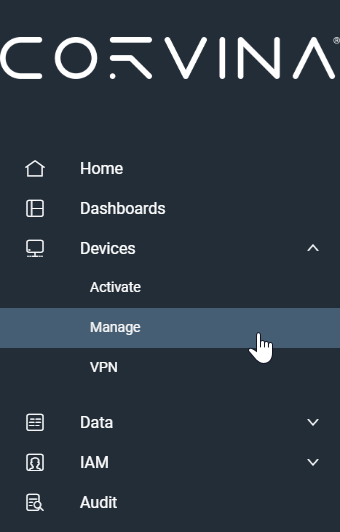
The Side Menu appears.
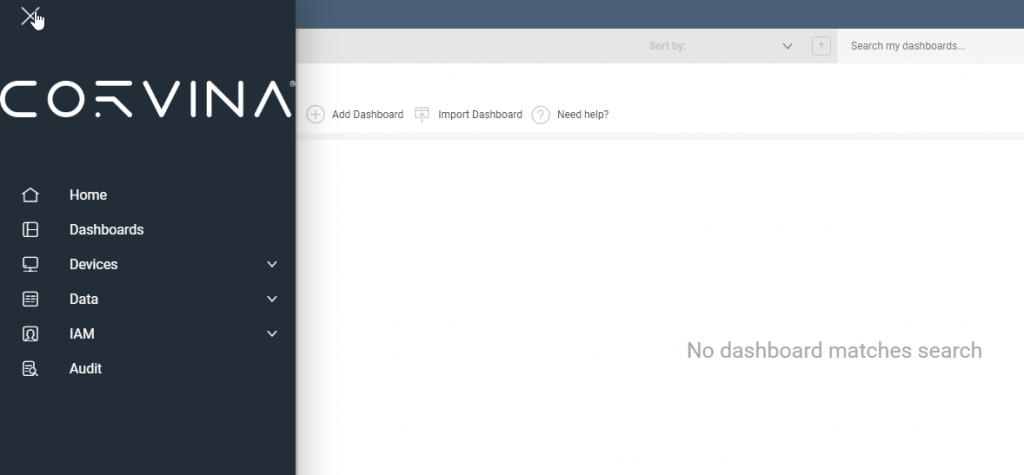
Go to Device>Activate.
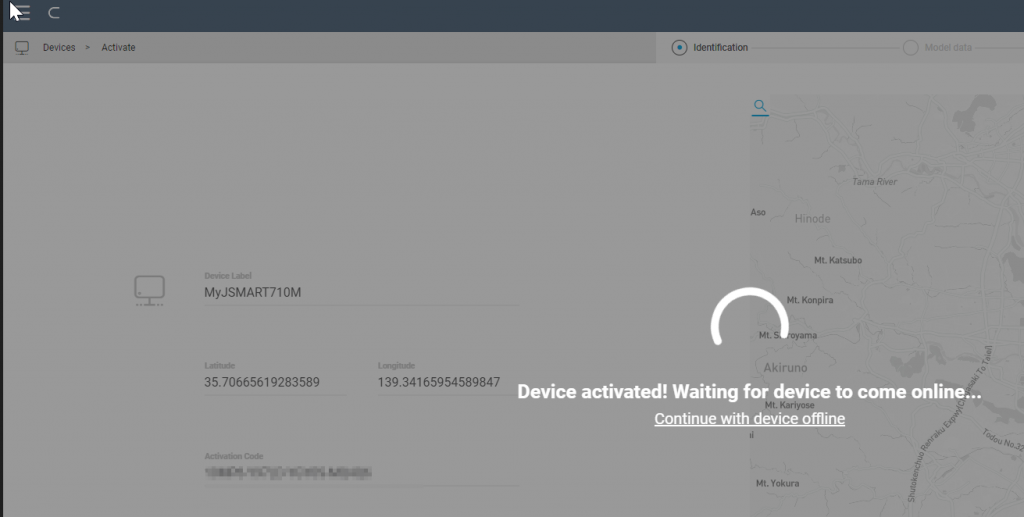
Device Activation screen is shown.
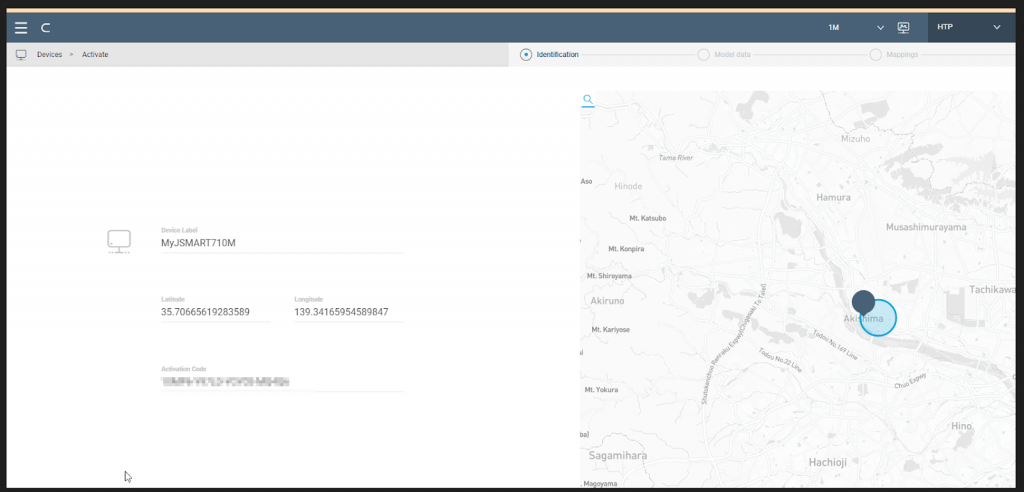
Enter the device name and activation code, and confirm with the Check mark.
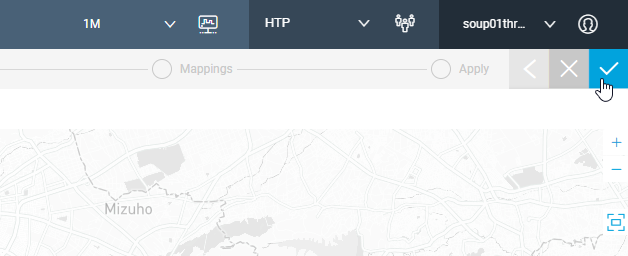
Just wait for a while.
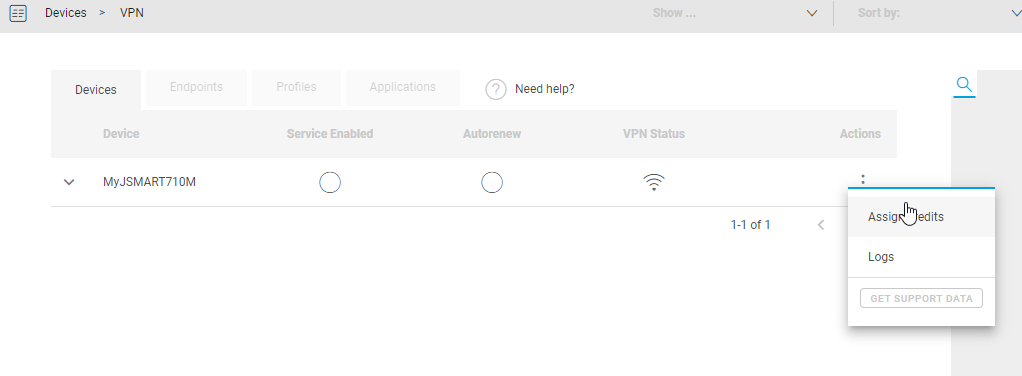
Assing credits
Open Devices>VPN and under Actions, click the Assign Credits.
Enable the VPN CONNECTION.
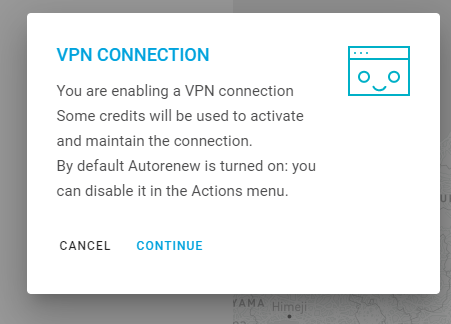
Done!
Test the Servies
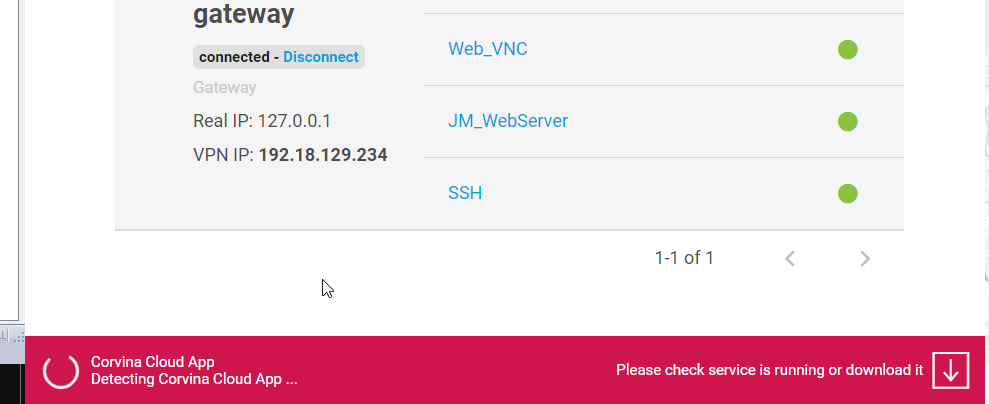
From the EXOR panel, go to Cloud>VPN Service, and if the State display shows “Connection to Cloud With IP X.X.X.X.X”, the VPN Connection is established.
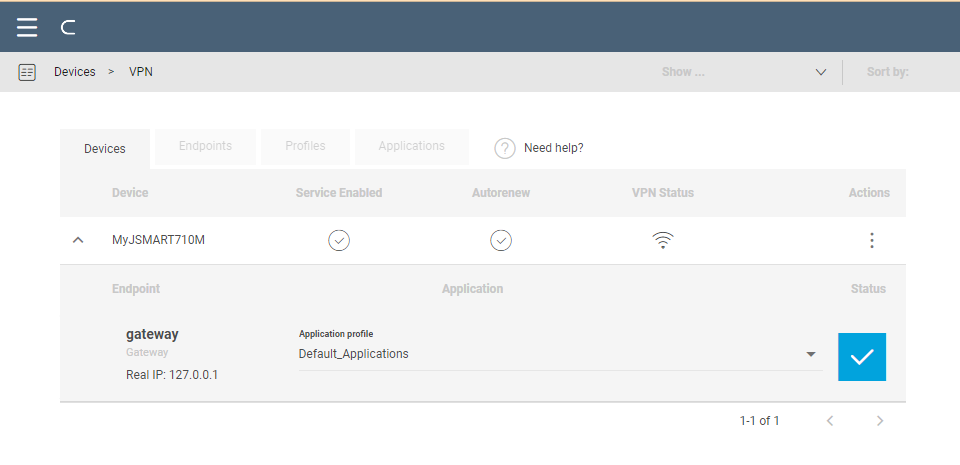
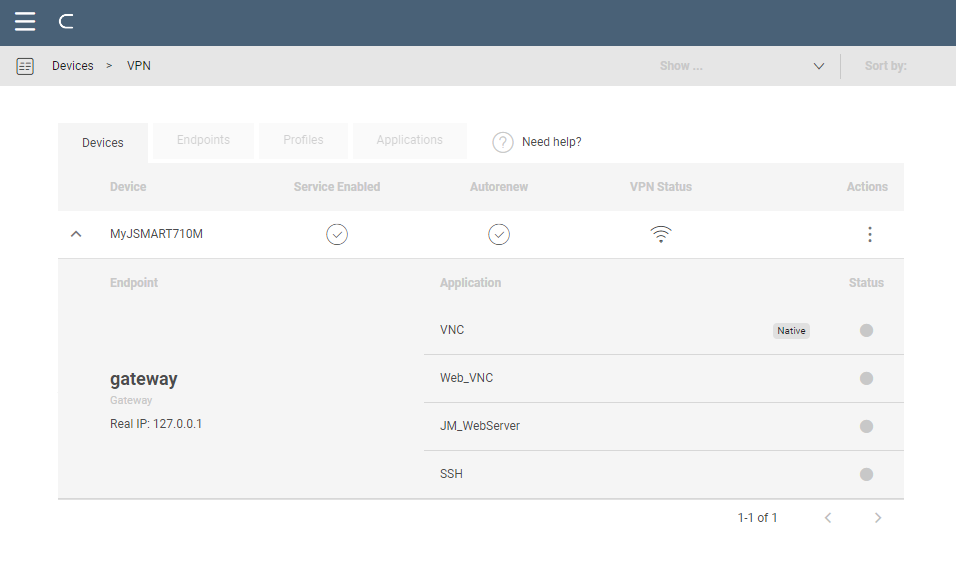
Now we can test the VPN connection. Open the same Devices>VPN screen.
Install Cloud App
You will receive a warning from the Platform that the Corvina Cloud App is not installed.
Click on the arrow ICON to Download the Install File.
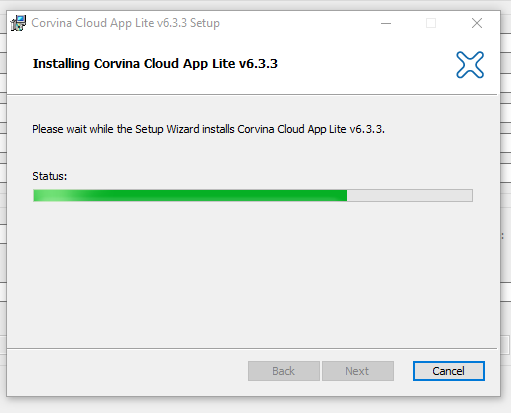
Open the Installation File and proceed to the Installation.
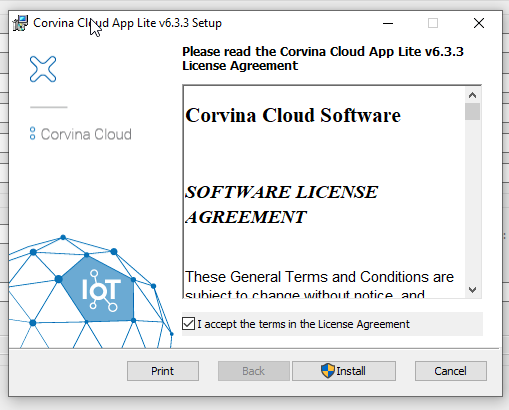
just a second..
Done!
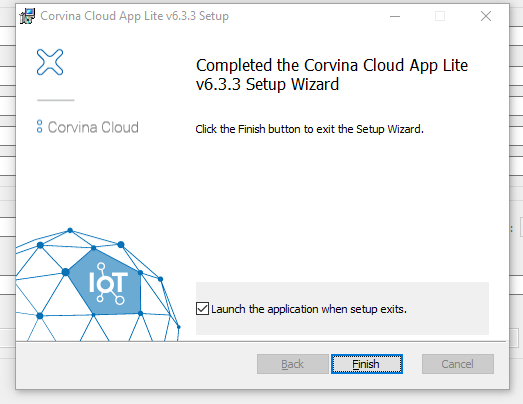
Corvina App has been launched.
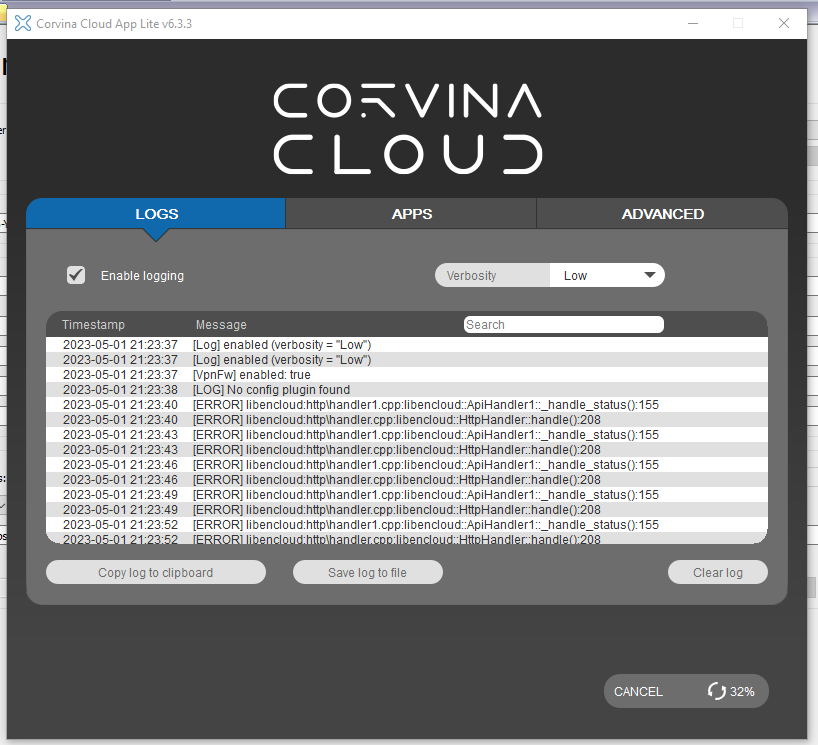
Corvina Cloud App is recognized from Corvina Platform.
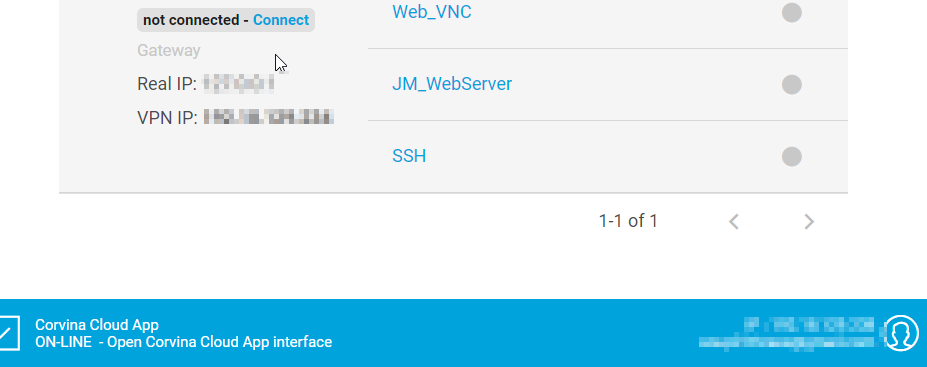
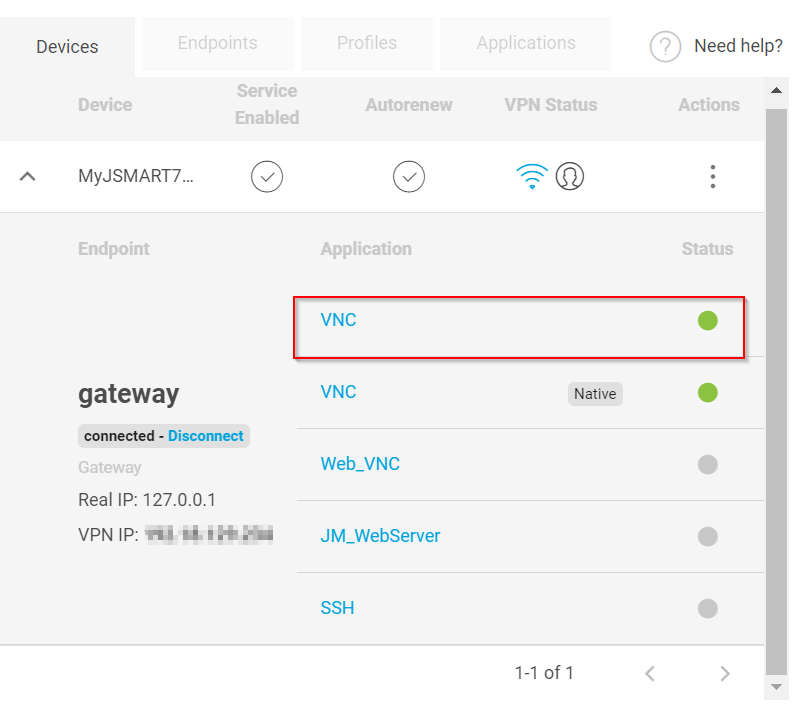
Test with VNC
Now we can try to test the connectivity with VNC Viewer.Doule click the VNC and the status LED will change to green if the application is in a normal status.
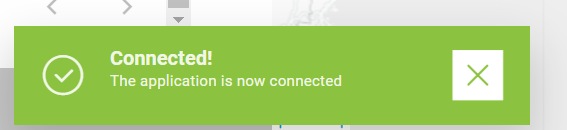
If a message “Connected!” is displayed when the VNC Application is started, the connection is successful.
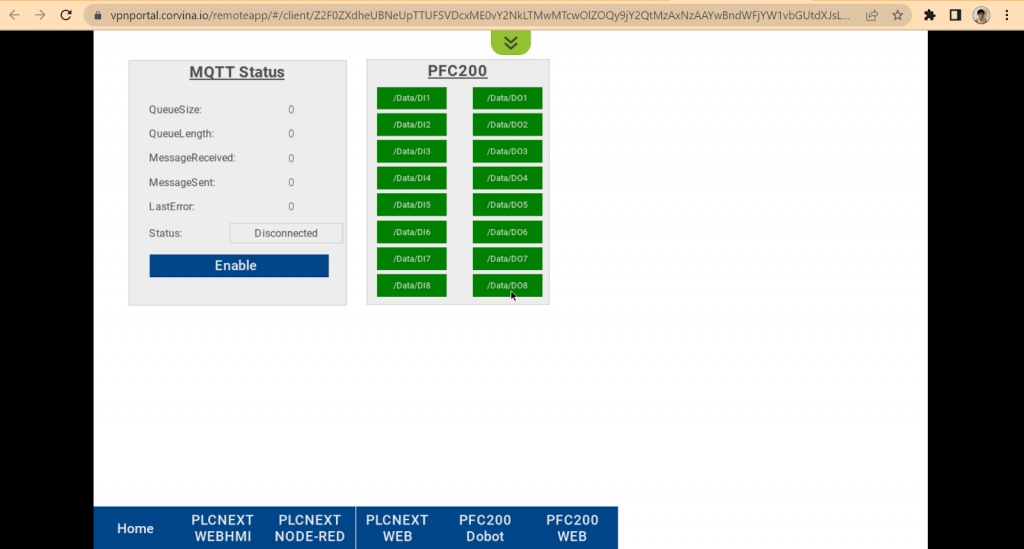
The same screen as the EXOR panel is mirrored from the Browser.
Link the Data
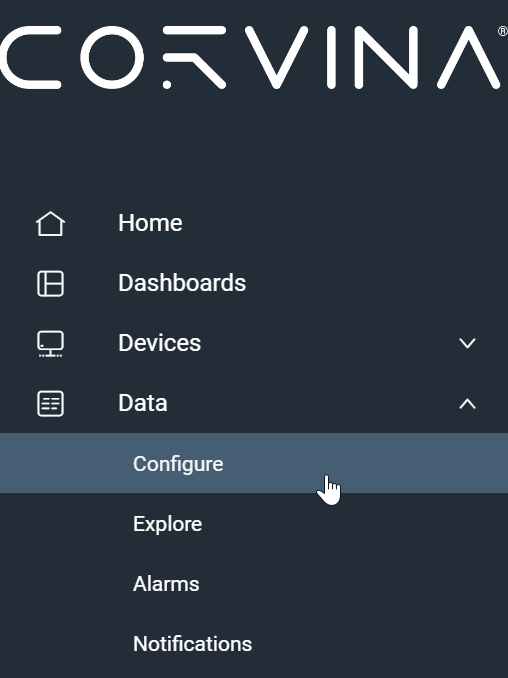
From Corvina Platform, open ICON in the red frame to Menu.

Click Data>Configure.
This is the Data setup screen. Here, you can map the tags in the EXOR panel and check the communication status of the tags.
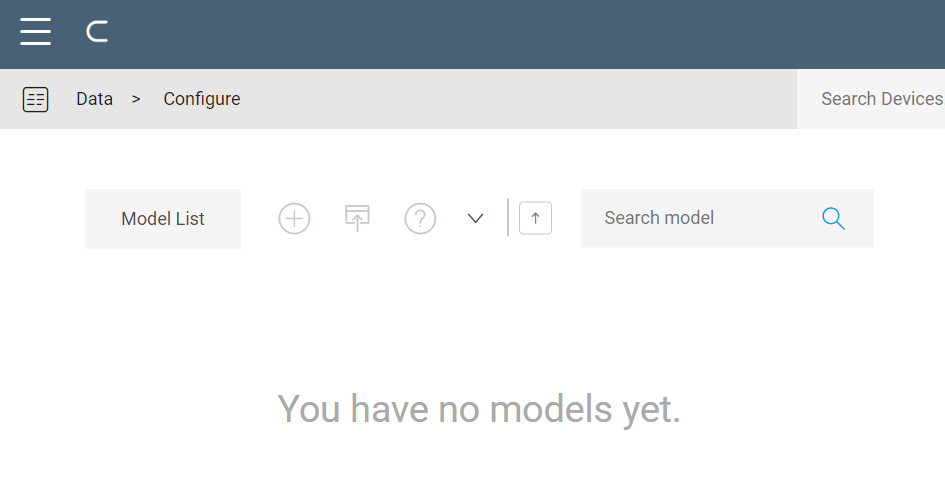
Create Model
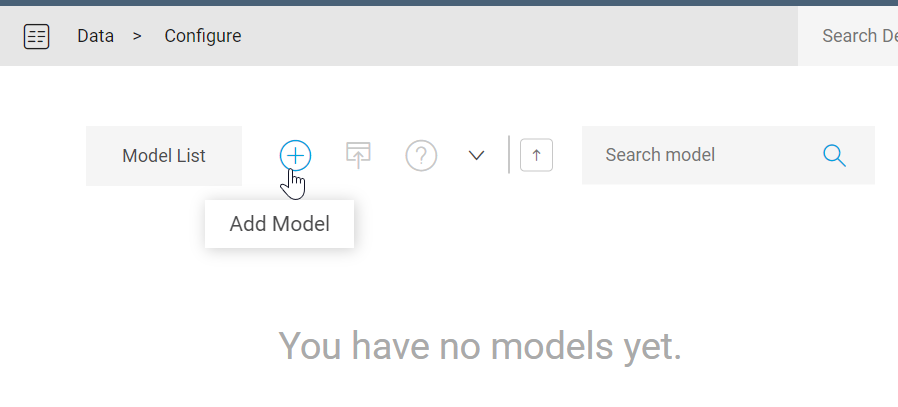
In order to connect the tag between the Corvina Platform and your EXOR panel, you must first create a “Model”. Click on the +Add Model button.
The Model setup screen appears.
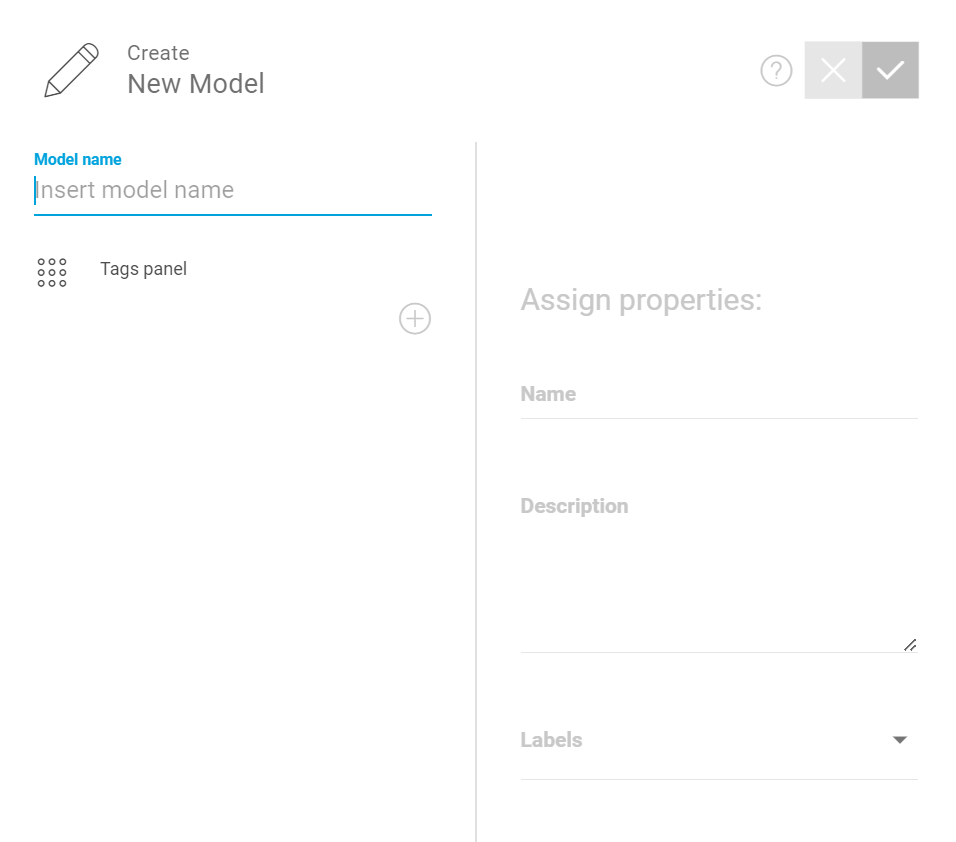
Enter the model name and click “Check Mark” to save the settings.
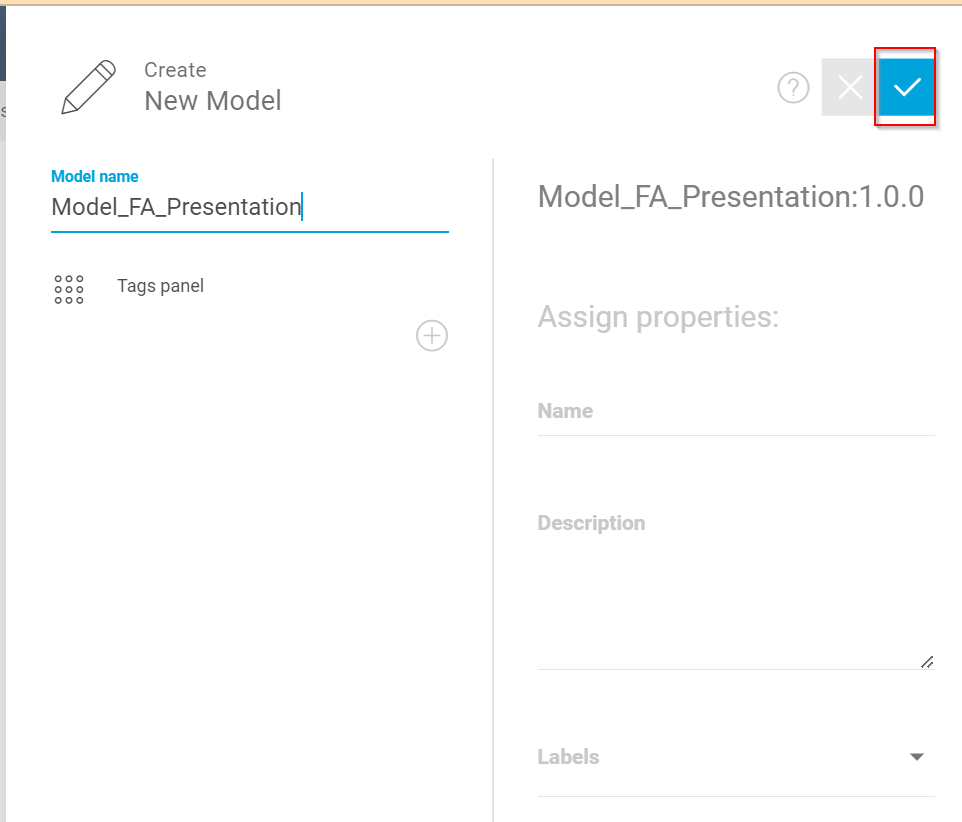
Model has been created.

From the Configure screen, you can see the Model you just created.
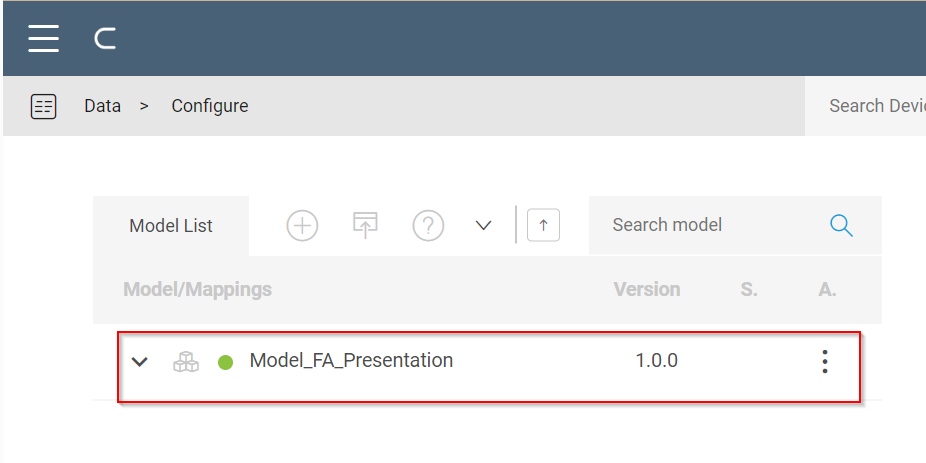
Create Configuration
The next step is to create the Configuration. First, we need to create only a Model, and then we need to link the TAGS in the EXOR panel to that Model.
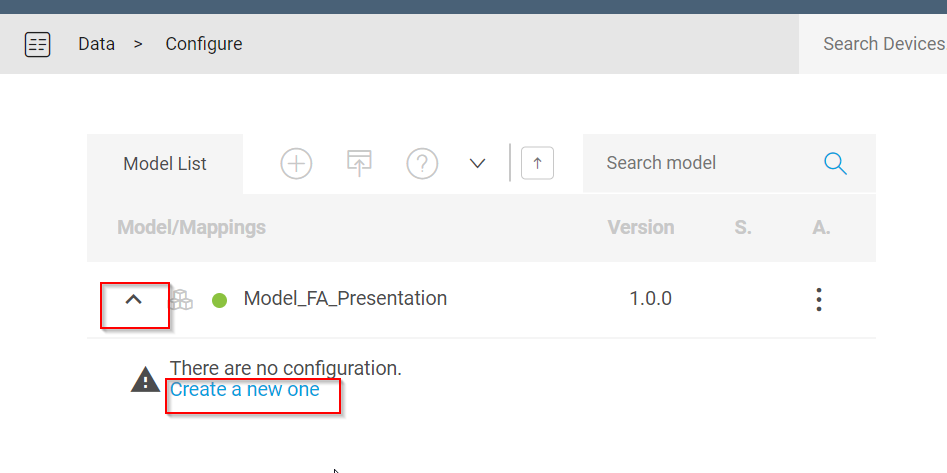
Expand the Model you just created and click on >Create a new one.
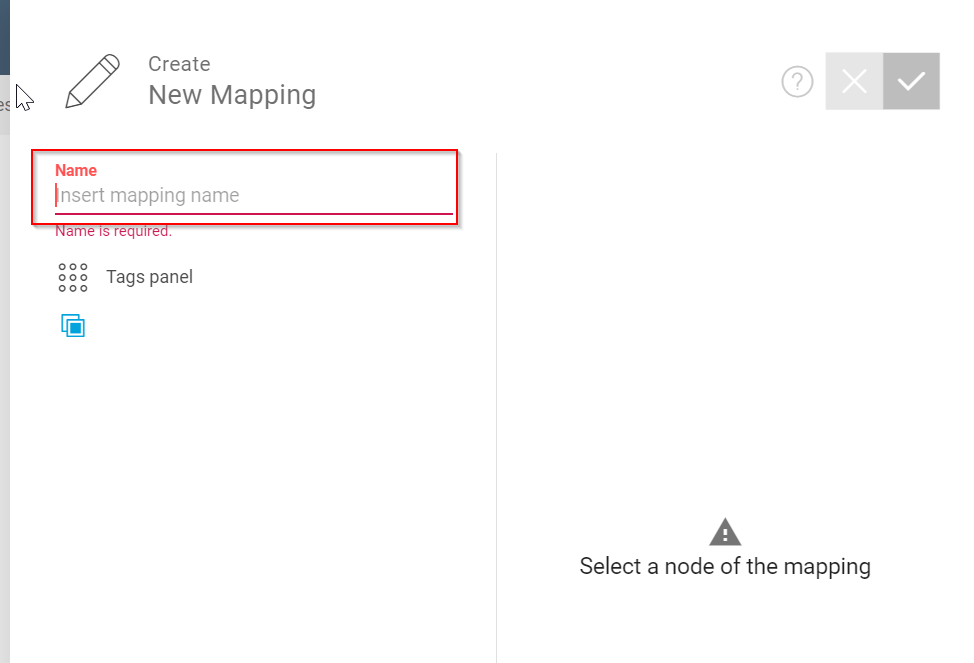
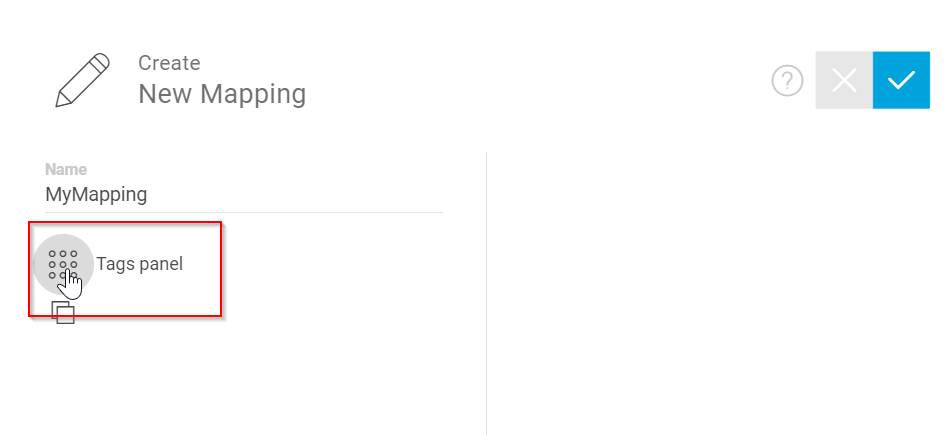
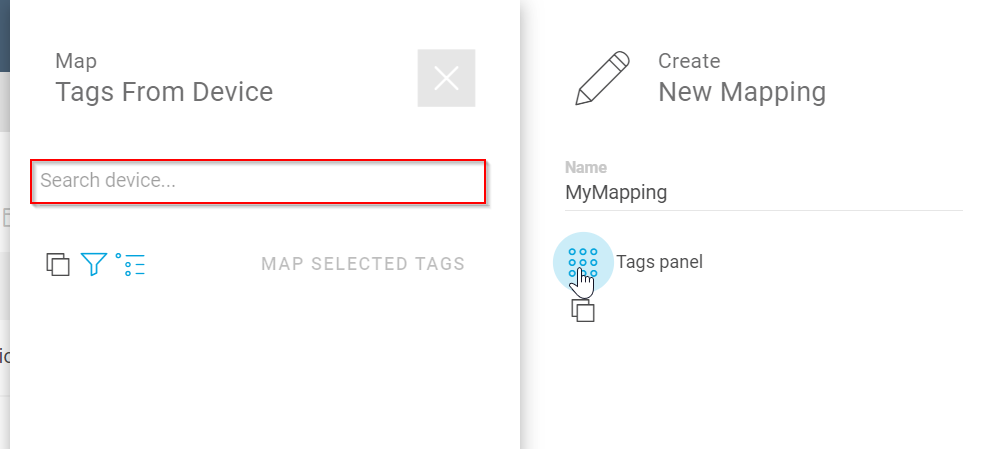
Enter the name of your Mapping.
Click on the Tags Panel to expand the Tag Settings screen.
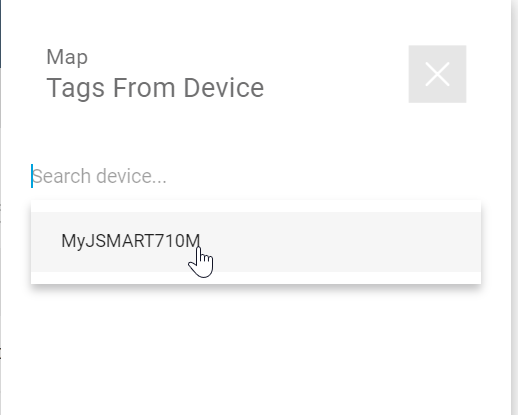
Click on Search device.
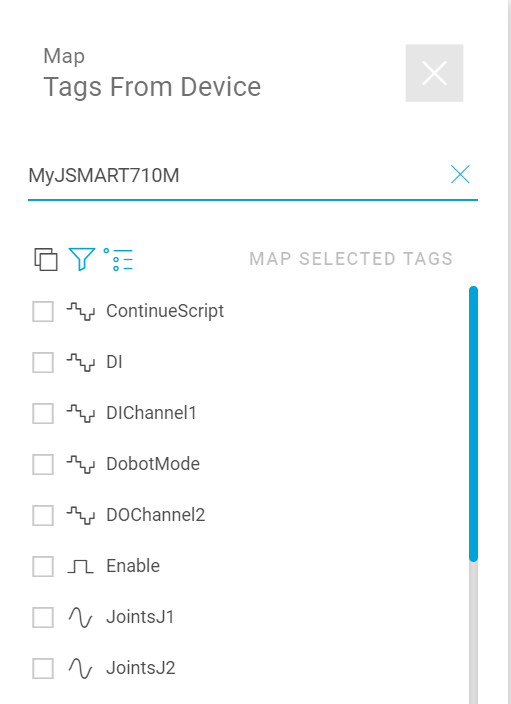
You can select the EXOR panel that you activated in the first Step.
Once the EXOR panel is selected, you can view the list of your Tags in the panel.
Select the necessary tags and click “MAP SELECTED TAGS” to map the tags to the model.
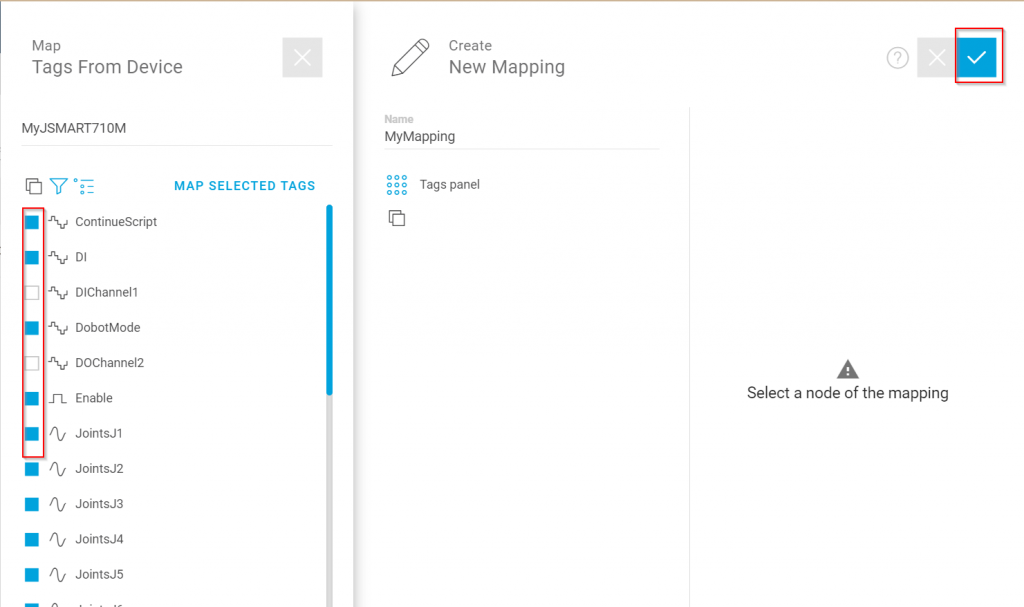
It is OK if you see the message “Mapping created”.

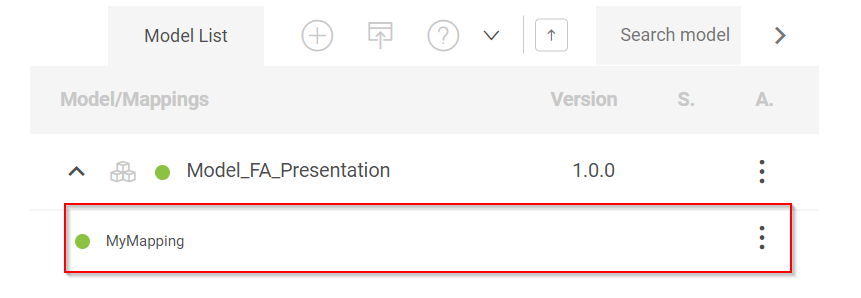
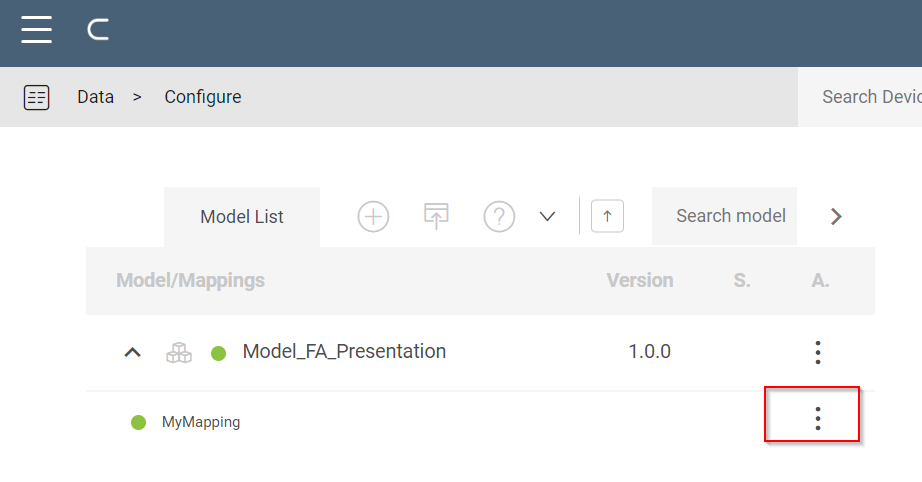
View Mapping
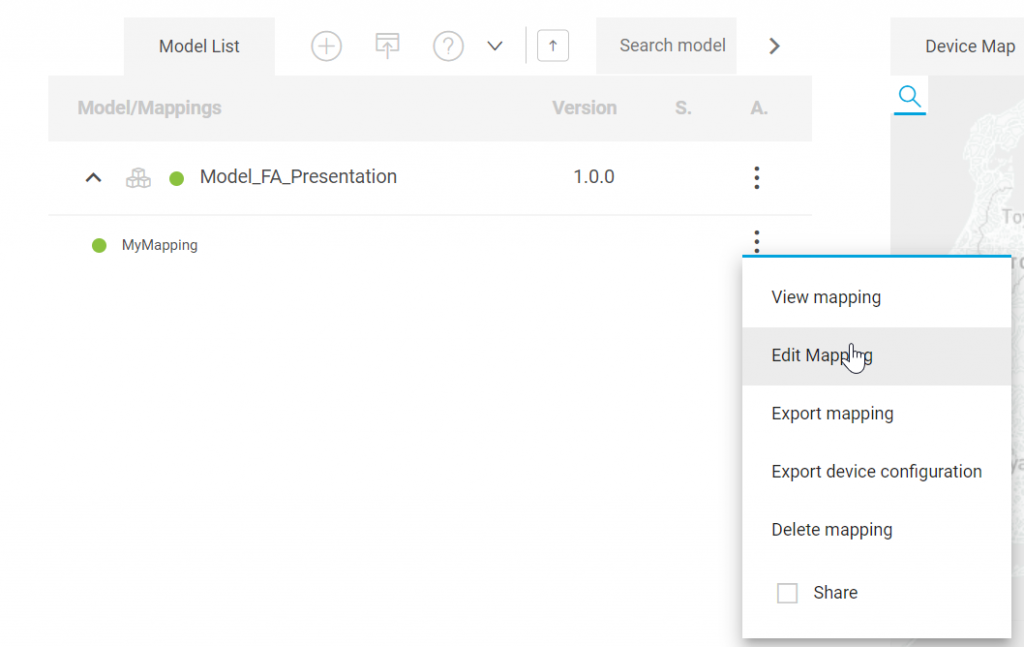
To check the current mapping status, go to Data>Configure and click on the … button in the red frame.
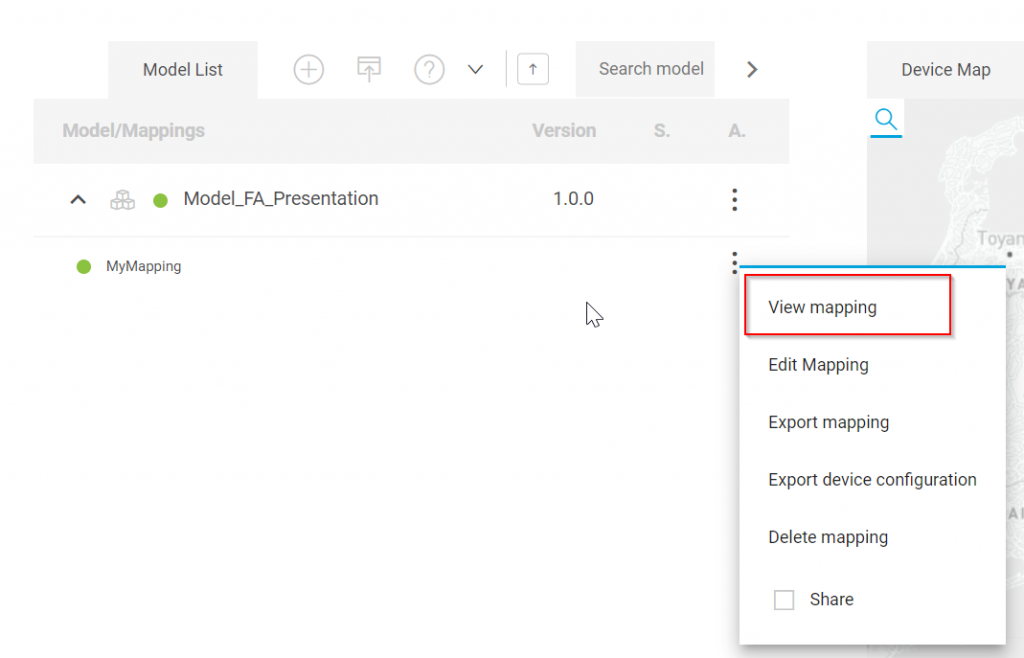
Click View Mapping.
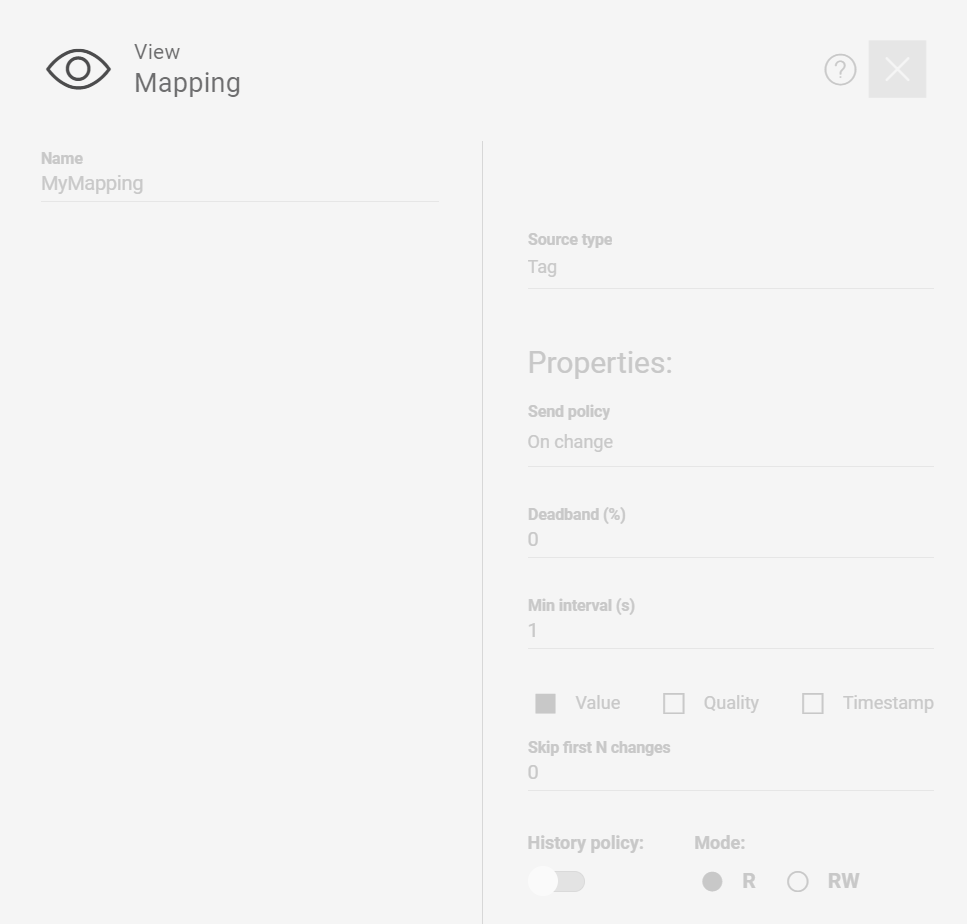
Mapping settings can be checked now.
Configure Mapping
Now let’s change the Mapping settings by clicking on Edit Mapping.
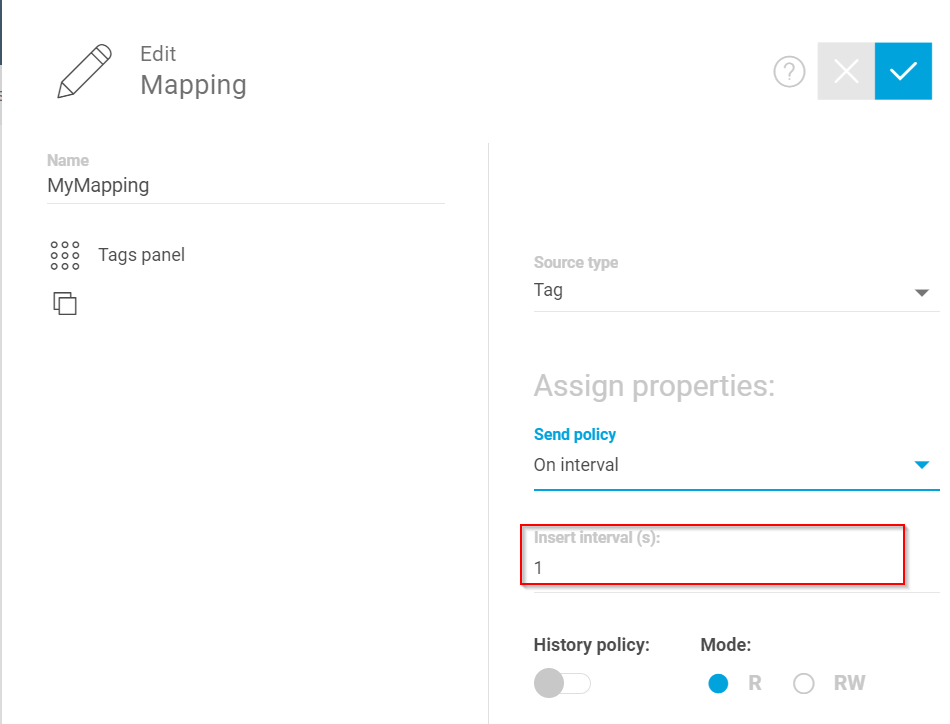
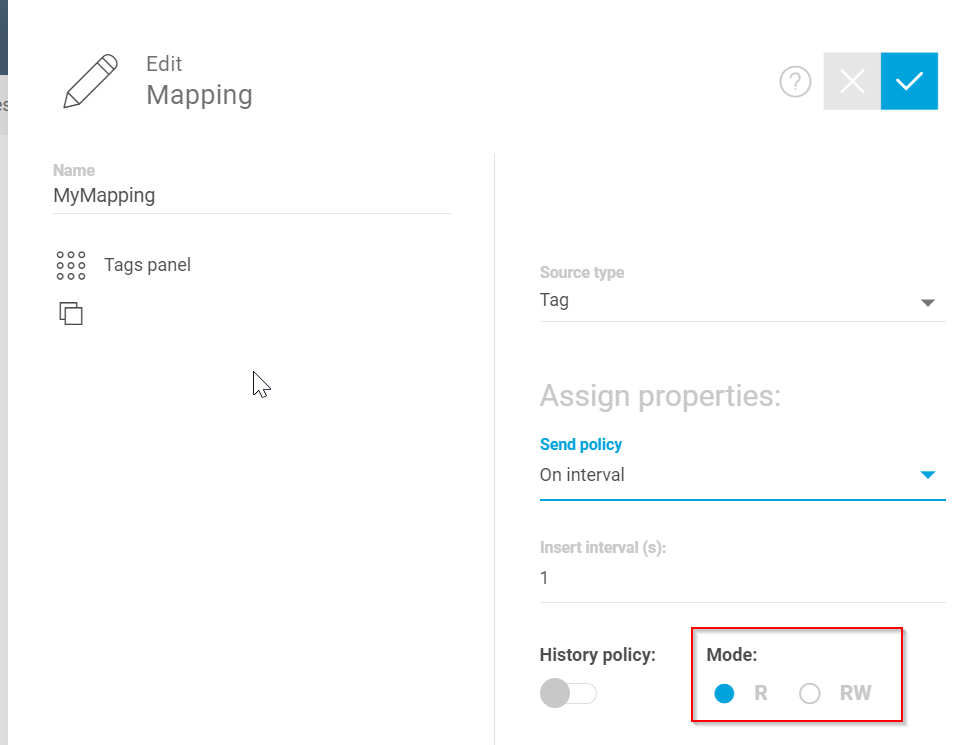
The screen will change to the Mapping setup screen.
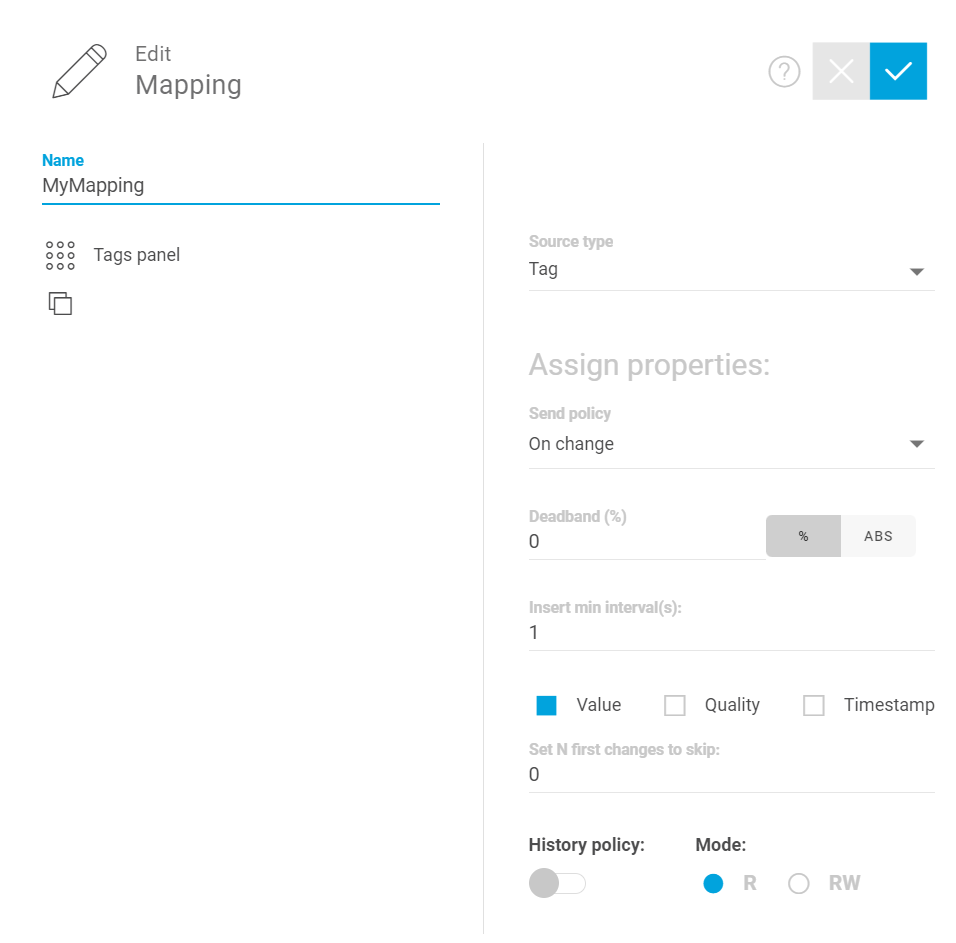
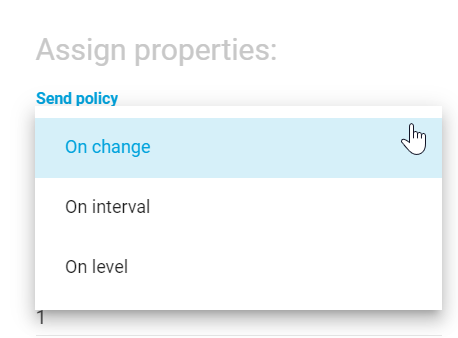
Send Policy
Send PolicyはTag値の更新タイミングです。
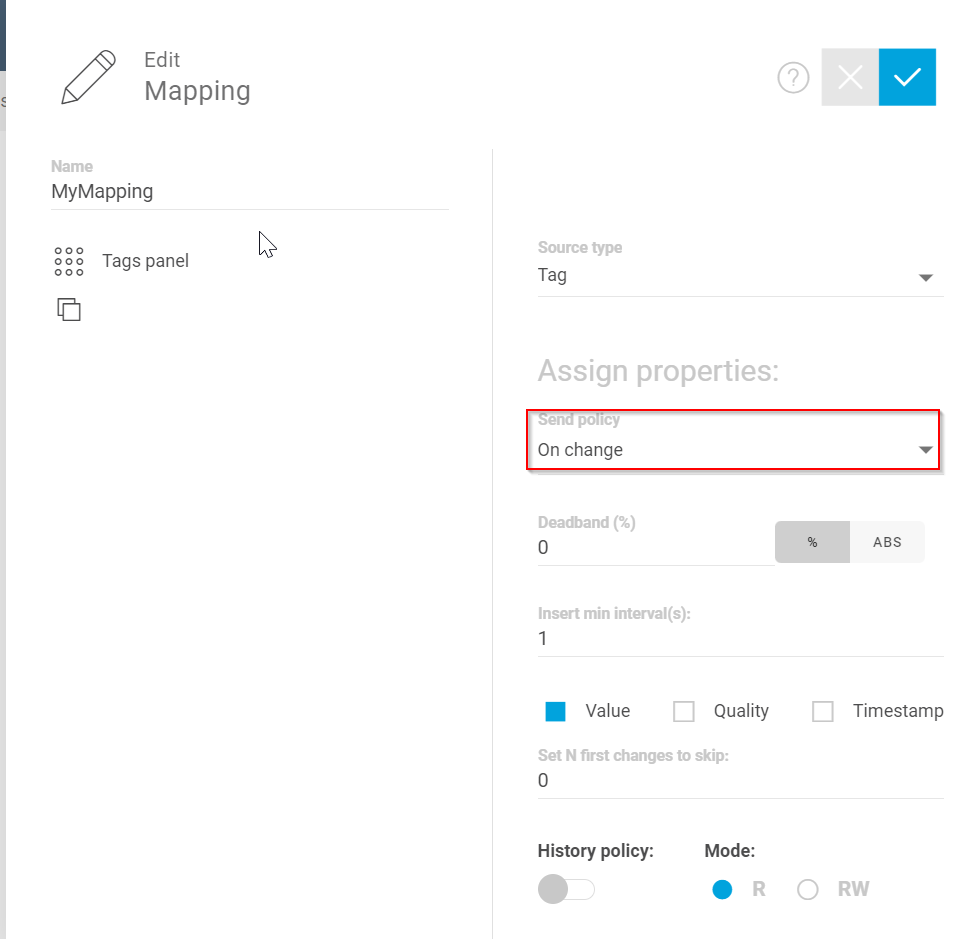
There are three types: On Change (when the Tag value changes), On Interval (Cycle), and On Level (when the threshold is exceeded).
Time
Time is used when the Send Policy is set to “On interval”, i.e., the update cycle.
R/RW
R=Read, RW=Read/Write.
Manage the Mapping
Even though only Model and Mapping ‘s configuration are completed, Tag still cannot connect to Corvina Platform.
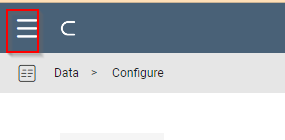
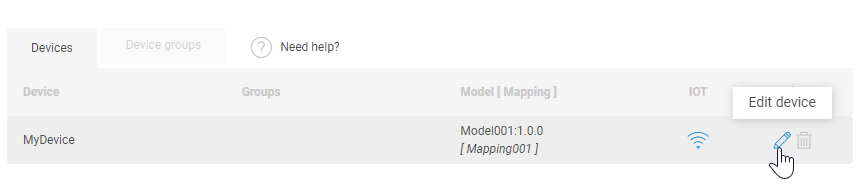
Open Devices>Manage from Menu.
Click Edit device.
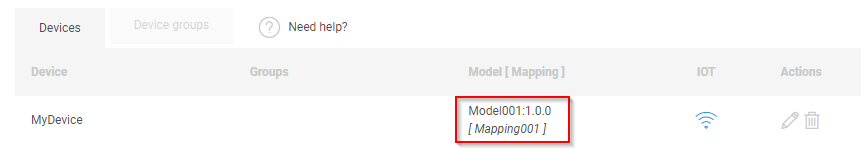
Match the Model and Mapping of the Device to the settings made earlier.
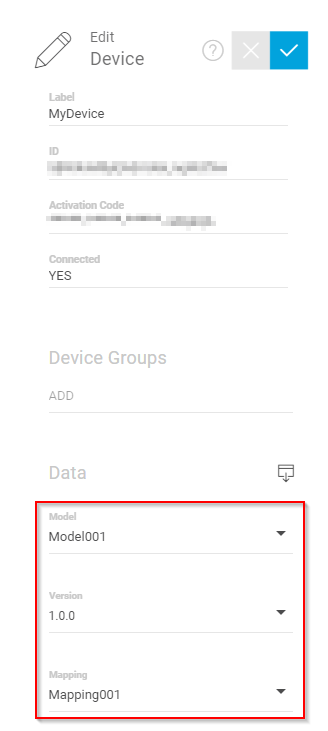
A Mapping message will appear. That’s OK!
Check it
Finally, check the connection status of the Tag.

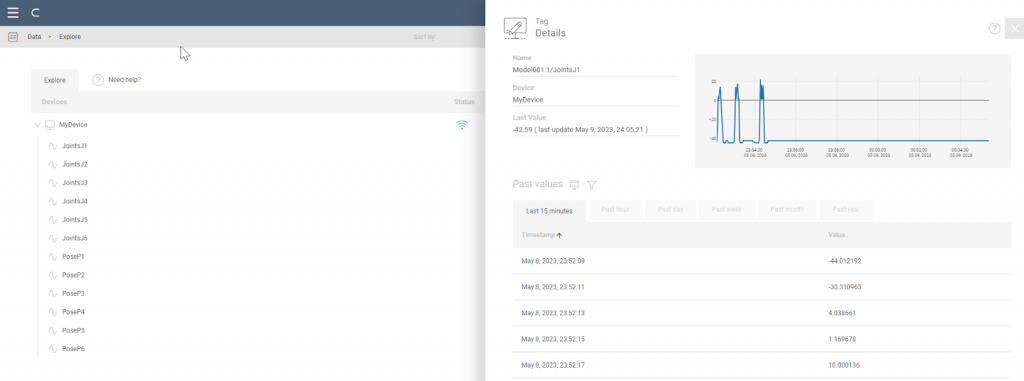
Open Data>Explore from Menu.
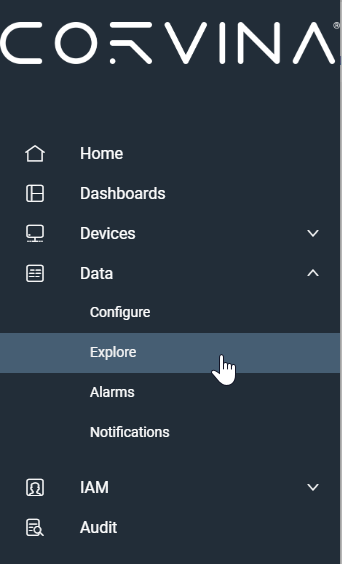
Done! The data has been received.
Create Dashboard
The IOT Platform has a Dashboard feature that allows you to create your own display from User.

Open Dashboards from Menu.
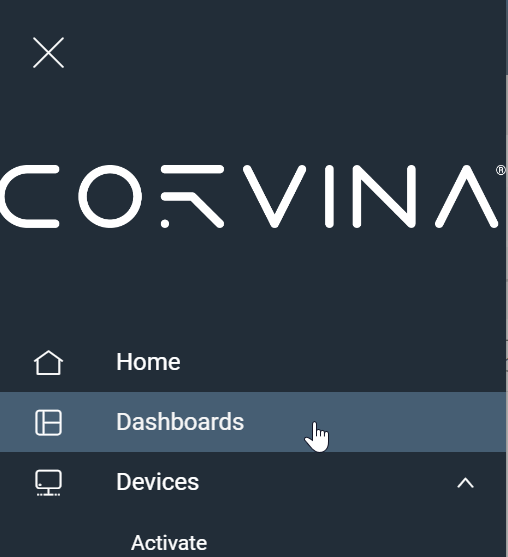
The screen will change to the Dashboards administration screen.
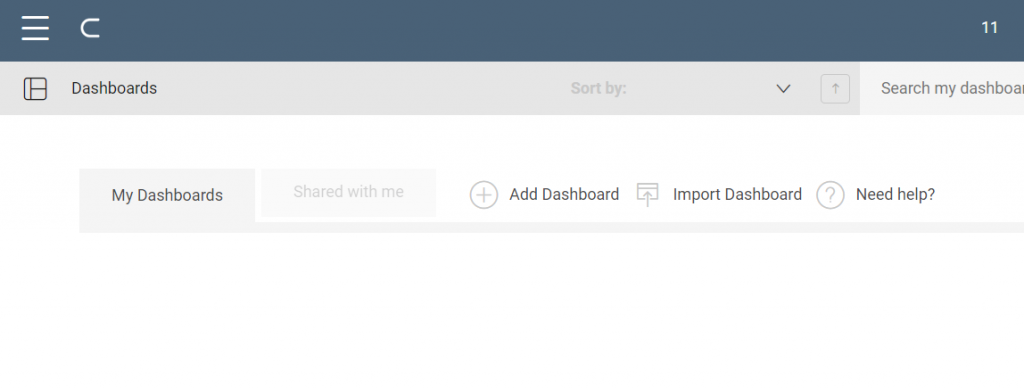
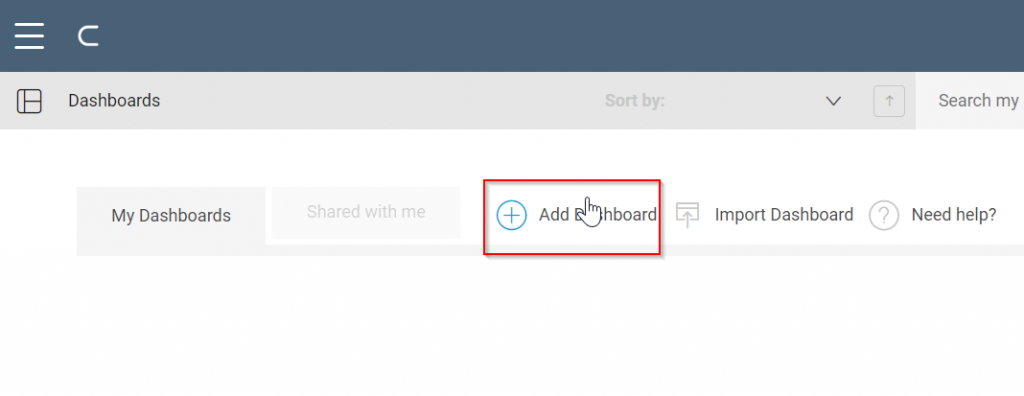
First, add a new Dashboard with the Add Dashboard button.
Default allows you to choose several Layouts.
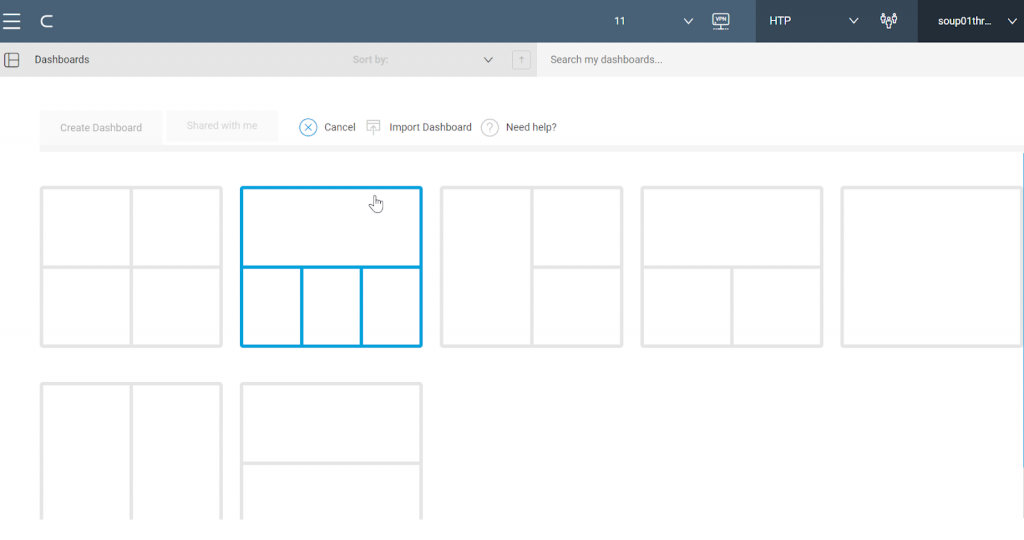
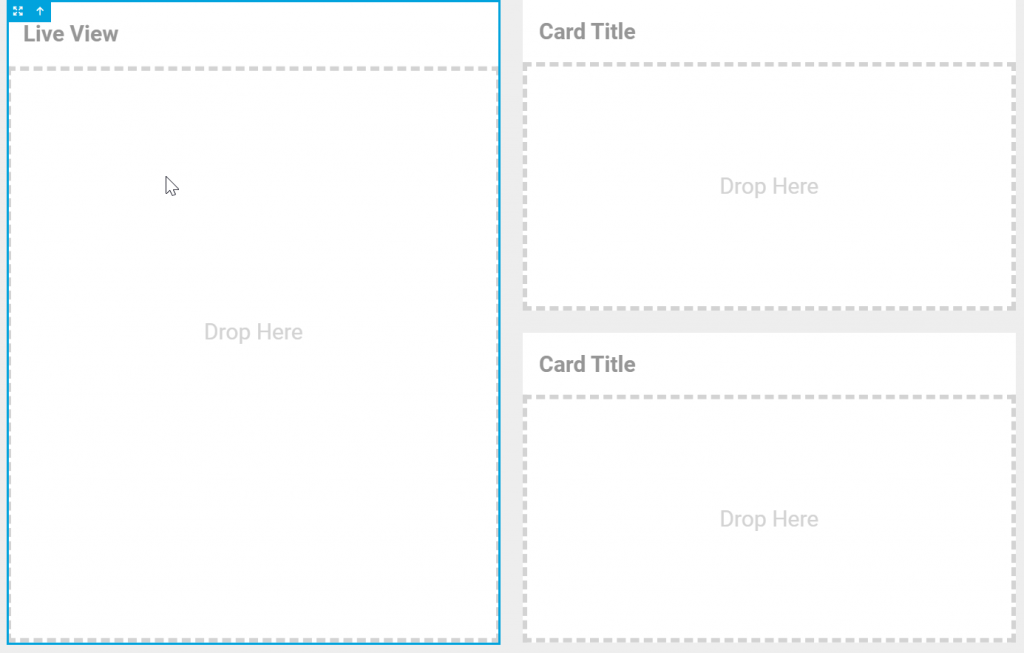
This time we will do a Layout with one Card on the left and two on the right.
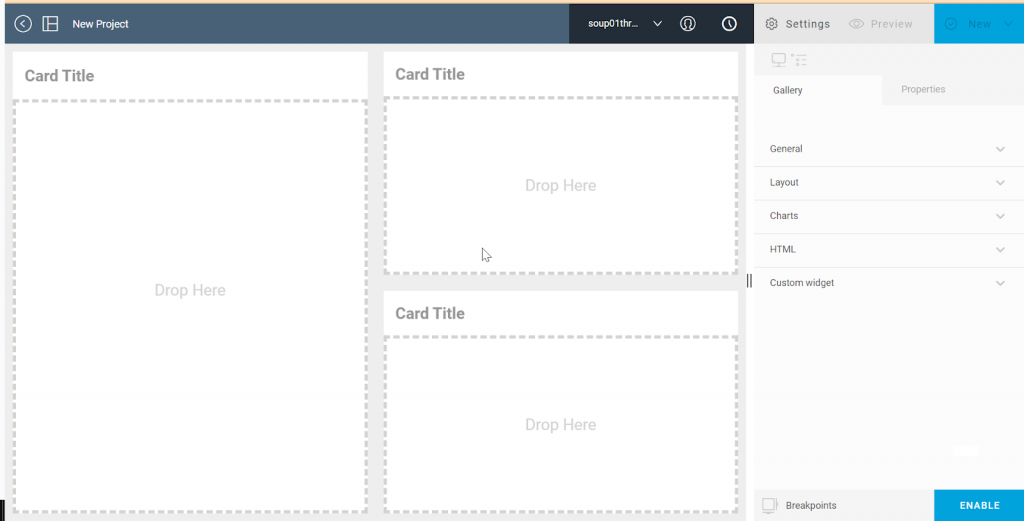
Label
Corvina has many components that can be placed in the Dashboard and not all of them can be described in this article.
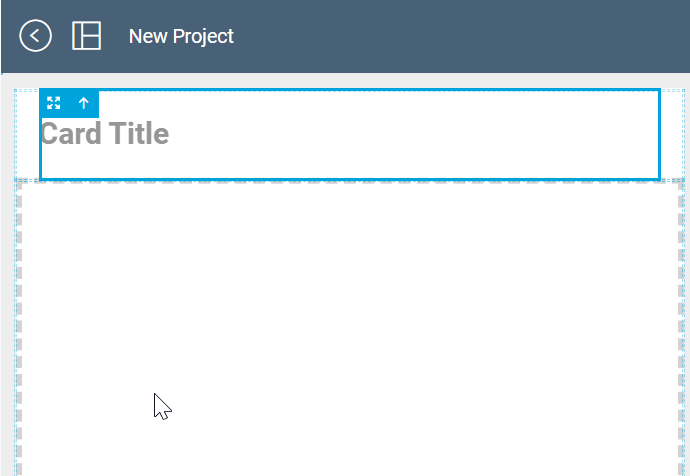
As an example, let’s look at the Card component Label “Card Title”.
Double-click on Card Title.
The Properties setting screen for the Label will appear on the right side.
Change the Text Field and set the text to be displayed on the Label.
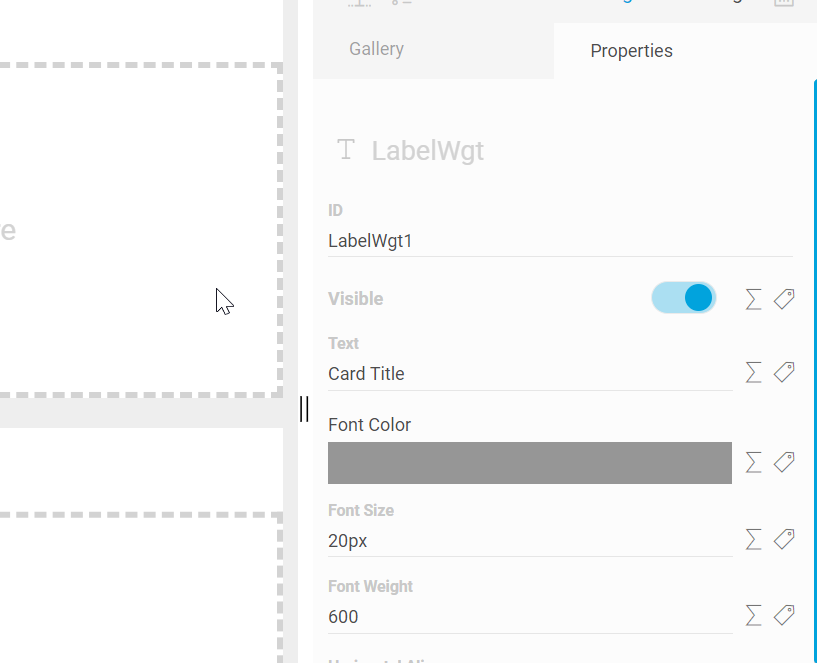
The text of the Card Title has been changed to “Live View”.
Add my live camera
I will Set up the USB Live camera server connected to my Network so that it can be displayed in Corvina, and NAT settings are required for this.
Open System Setting>Services>Router/NAT/Port Running in the EXOR panel.
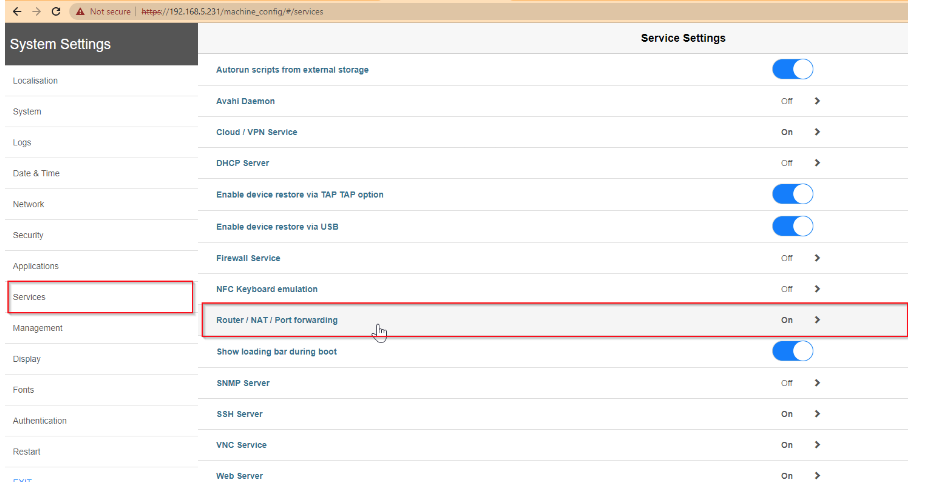
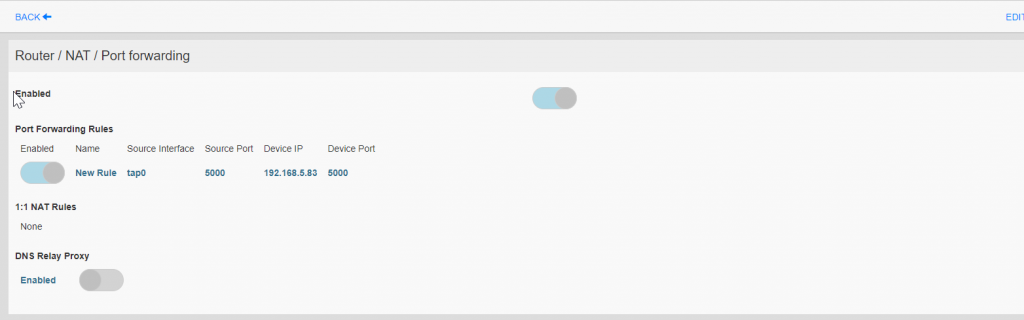
Configure these settings inside Router/NAT/Port Running Field.
- Enable the features
- Enable the Port Forwarding Rules
- Source Interface is tap0.
- Source Port is 5000 (Port to be set by Corvina).
- Device IP is 192.168.5.83 (IP of USB Live Camera)
- Device Port is 5000 (Port for USB Live Camera)
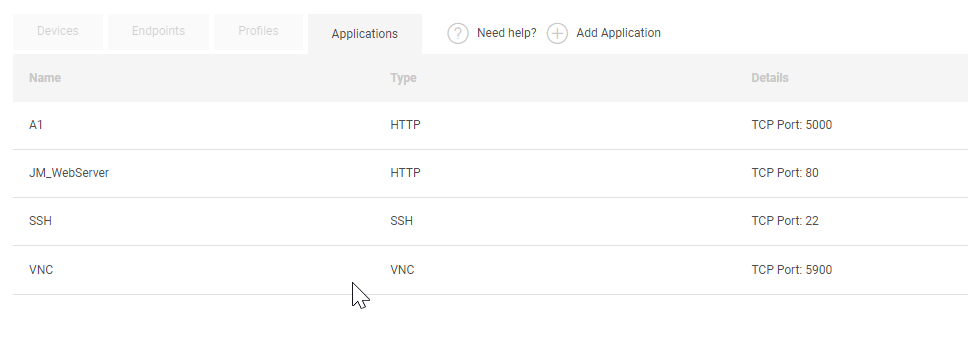
Open Applications under Devices>VPN.
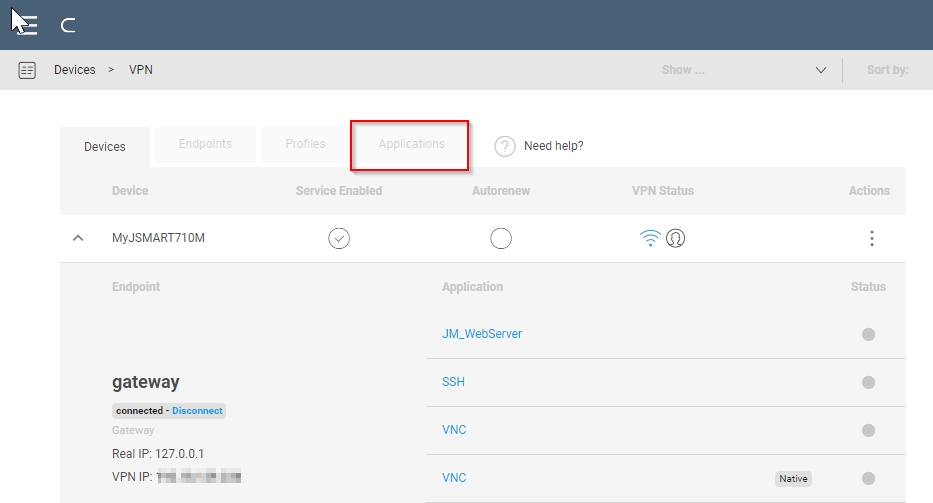
The Applications Tab lists the applications that work with Corvina and the corresponding EXOR panel.
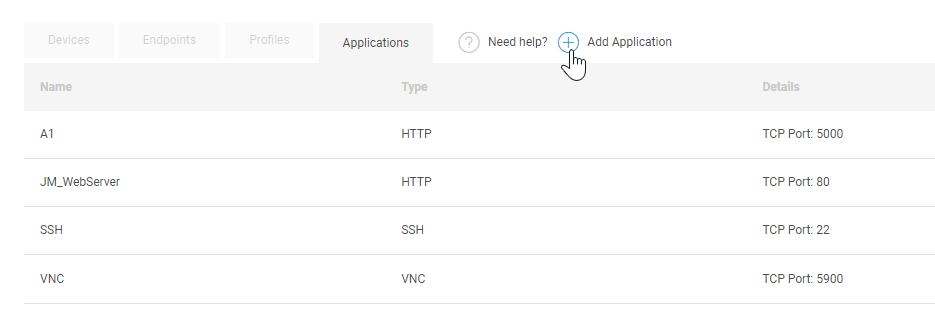
Press + Add Application to add a new application.
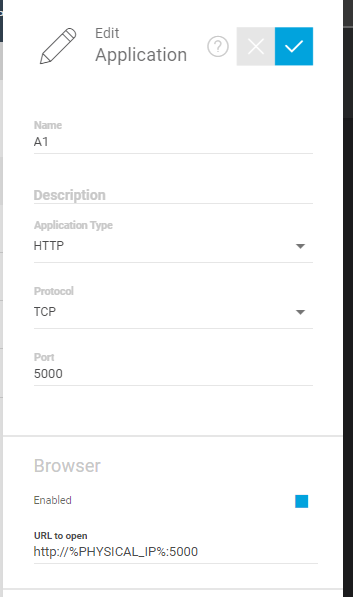
Application Type=HTTP, Protocol=TCP, Port=5000, and the URL to open is http://%PHYSICAL_IP%:5000でOKです.
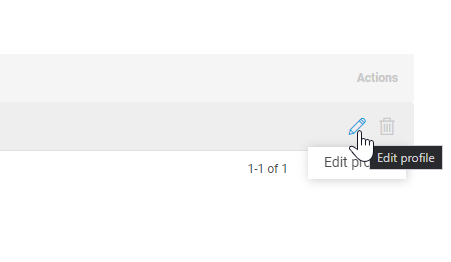
Next, Profiles must be added to the Application.
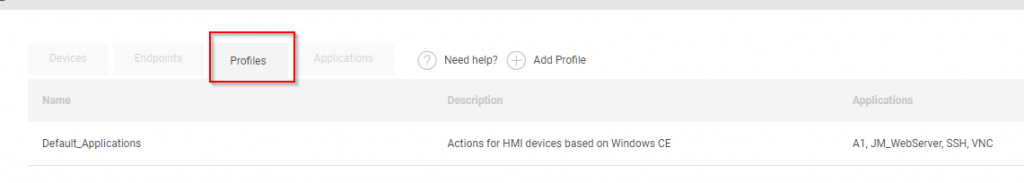
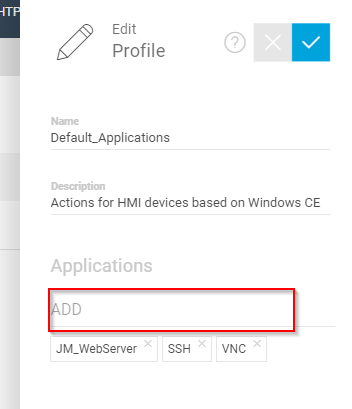
Click the Edit profile button.
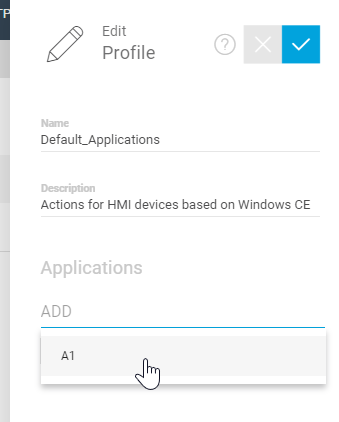
Add the application with ADD.
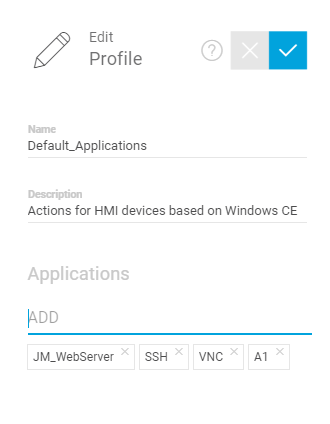
You can select the application that added in the previous step.(in this case named A1).
Done!
VPN Application
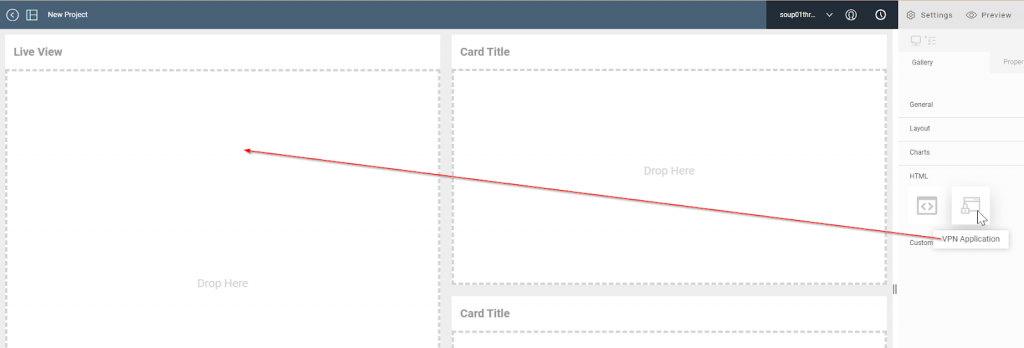
The next step is to add the VPN application to the Dashboard.
Go to Gallery and drop HTML>VPN Application to “Drop here” Area.
Configure the application path that you just added with + button.
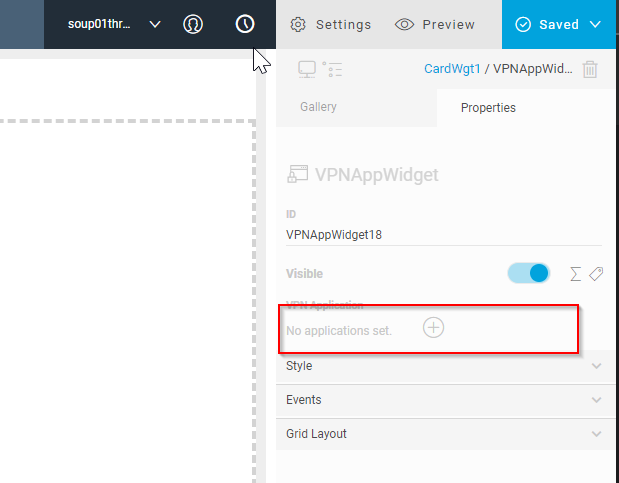
Thus, the application just mentioned has been added.
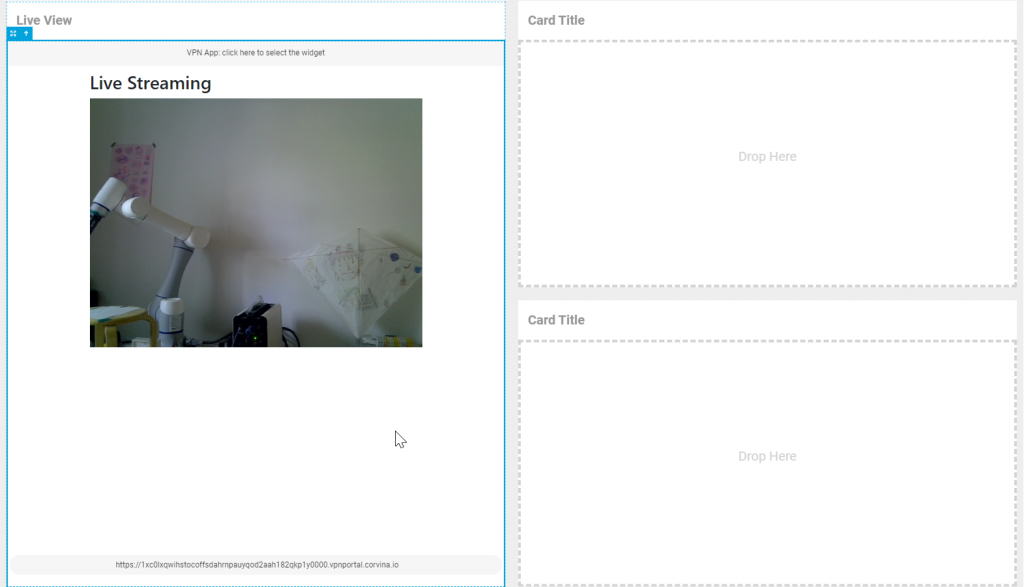
Once a VPN Connection is established, you can view the Live camera images as they are.
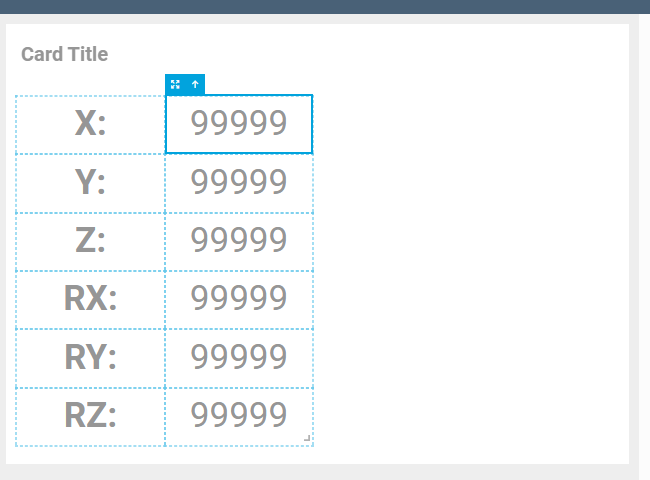
Add NumberDisplay
I will also add a numerical display at the end of the article.
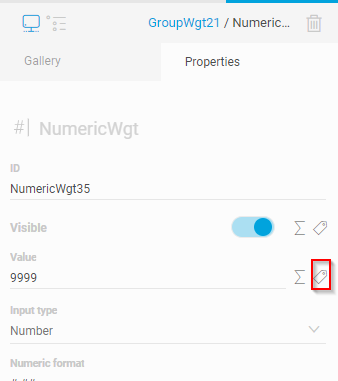
In Properties, click on the small Tag ICON (red box) from the Value field.
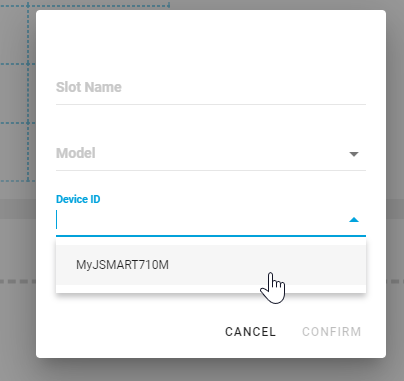
press “ADD DEVICE SLOT “ to add a new device slot. The device slot is actually the setting required to connect between the Tag and Dashboard.
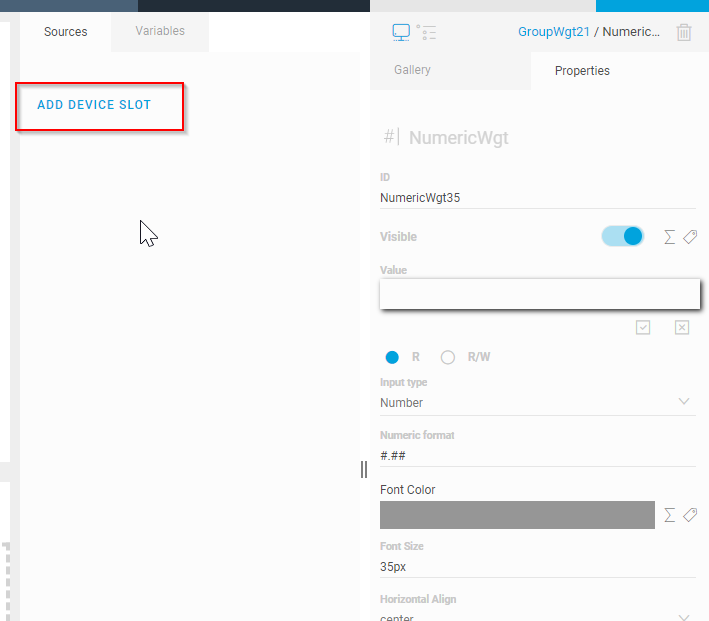
The EXOR panel to be connected can be selected from Device ID.
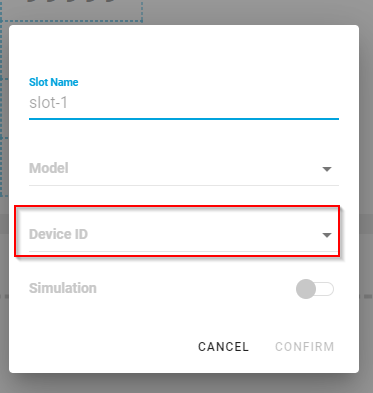
Enter Slot name>Disable Simulation>confirm with CONFIRM.
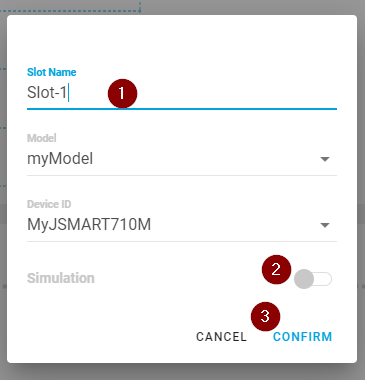
Done!
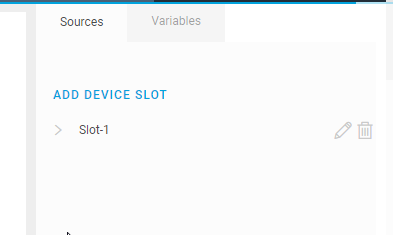
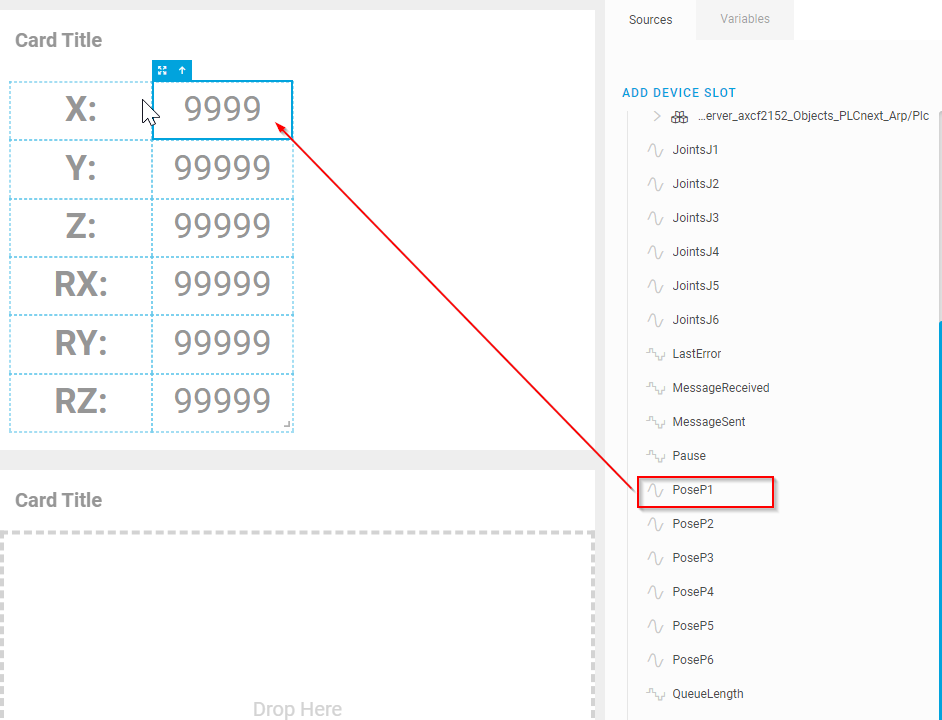
You can list the Tags associated with the Sources Tab.
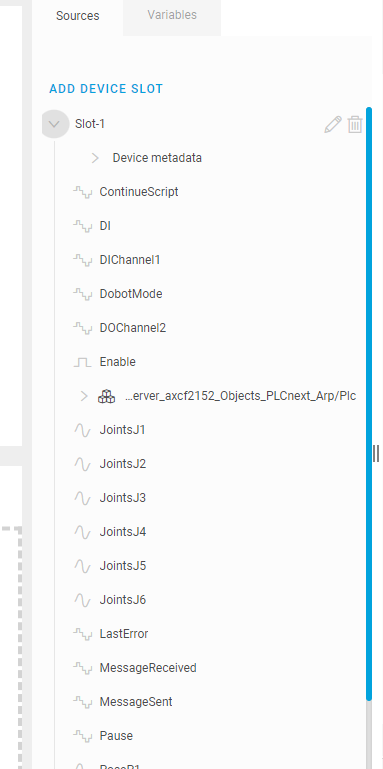
Finally, drop the tag from the Device Slot directly into the Numbers Display.
Result
Here is a demo video of the EXOR panel and the Corvina Platform’s Dashboard working together.
Here is a demo video of the EXOR panel and Corvina Platform VNC working together.