WAGO Cloud is a cloud platform that can collect and analyze data from multiple devices by using the PFC Controller, and remote monitoring and management of your PFC Controller. The user-interface is very user-friendly, and Configuration isn’t that difficult. However, the documentation is scarce, so I would like to supplement various things from this article series.
By the way, it is possible to try WAGO Cloud during the 30-day trial period.
Thanks!
I would like to say thanks to Wago Japan Co., Ltd that rented the 720-8215 PFC Controller to me for this article.
Wago Japan
PFC Controller750-8215 was lent by Wago Japan Co., Ltd. WAGO was started in 1951, a German company that has supported the field with the technologies of PUSH WIRE and CAGE CLAMP, and have contributed to industries around the world with terminal block technology. WAGO also has a PLC LINEUP, offering automation solutions with an emphasis on openness and flexibility.
Wago Japan Co., Ltd. is headquartered in Koto-ku, Tokyo.

Reference Link
Here is the reference link for E!COCKPIT operation.
Big Concept
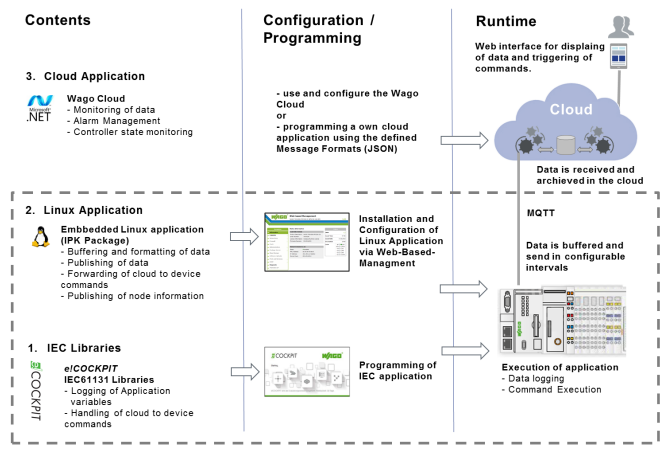
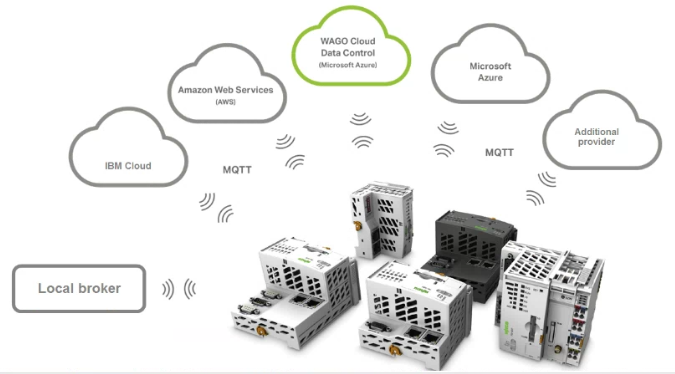
This is a rough concept when not only WAGO Cloud but also PFC Controller uses other IOT Services.
- E!COCKPIT provides a dedicated IEC 61131-3 library that allows direct programming of data to be sent to the Cloud Platform in PLC Runtime.
- A Linux Application runs behind the PFC Controller and sends and receives PLC Runtime data to and from the Cloud Platform.
- MQTT is used behind the Linux Application to send the data to each Cloud Platform.
- Finally, Data monitoring and alarms application are implemented on Cloud Platform.
Data Protocol
With Cloud connection, you can transfer Cloud with multiple protocols from PFC’s PLC program (750-8215 used this time). In other words, the PFC CPU uses the IEC library in the PLC program and sends data to any Cloud application from MQTT via the Linux application.
Note that one Connection cannot access multiple Data Protocols at the same time.
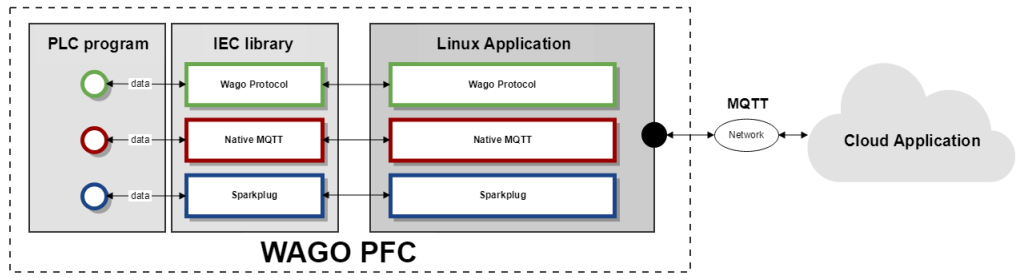
WAGO Protocol
Wago Protocol allows you to easily send data from your PLC to your Cloud application. The Wago Protocol is compatible not only with Wago Cloud but also with various Cloud Platforms. for example,
- WAGO Cloud
- Azure
- AWS
- IBM Cloud
- MQTT For AnyCloud
Native MQTT
You can also launch MQTT Client on PFC CPU and publish/subscribe data to MQTT Broker. for example,
- AWS
- SAP IoT Services
- IBM Cloud
- MQTT For AnyCloud
Sparkplug
You can also launch MQTT Client on PFC CPU and publish/subscribe data to MQTT Broker.
IEC Libraries
WagoAppCloudはICE 61131ライブラリでE!COCKPITからPLCプログラムを作成しデータをCloud Platfromに送信できます。
- FbCollectionLogger
- FbCollectionLogger_2
- FbCommandConfigurator
- FbCommandConfigurator_2
- FbCommandListener
- FbCommandListener_2
- FbStatus_WagoProtocol
- FbStatus_WagoProtocol_2
Linux Application
A Linux application runs behind the PFC, handles data exchange between the PLC and the Cloud application, and implements the IEC library (WagoAppCloud) in the PLC program. MQTT Protocol is used between PFC and the Cloud application, and encrypted with TLS (Transport Layer Security). The Linux Application provides the following information.
- Device Information
PFC specification information is defined in Linux Application when connecting to Cloud Application. - Device Status
Linux Application is PFC state transition in Cloud Application.
And Wago Protocol Caching can be set to RAM or SD Card from WBM (Web Based Management).
IEC Application
Telemetry is the process of collecting data and sending it to other applications for monitoring and analysis, which E!COCKPIT implements with the Function Block “FbCollectionLogger”. That Function Block can send data to the Cloud in two ways.
- Cyclically Data Exchange
Sending data cyclically to a Cloud application and Sample Interval is a parameter used when sending data cyclically. - Event Base
Sending data by some state Trigger and Sampling Data Mode, Collection Trigger, and Variable Trigger are parameters used when sending data with Event Base.

Be Careful!
When collecting data in a PLC program, it is necessary to clarify the structure of variables, variable names, and the cycle of publishing data. Especially for the Publish cycle, Be careful about the collection cycle of each data, and define the collect and publish cycle times with RETAIN.
Limit
For RAM, samples can be collected in the fastest 100ms.
In the case of SD-CARD, samples can be collected in the fastest 1s.
The fastest Publish cycle is 1s.
Ports
As mentioned before, the PFC Controller uses MQTT to send data to the Cloud application, so we use Port 1883 (unencrypted data) and 8883/443 (encrypted data). Before connecting PFC Controller to the Cloud application, reconfirm whether Data Traffic is not blocked by Firewall settings.
Cache Mode?
As mentioned before, The cycle time depends on the Cache Mode that is used in the CPU, but I will explain what the Cache Mode is. Linux Application normally writes the data received from the PLC program to Cache and then sends it to the Cloud application.
If data is successfully sent from Cache to Cloud, the data will be deleted in Cache. Conversely, if transmission fails due to a network problem, the data will accumulate in the Cache.
However, if the network failure becomes longer and the Cache Max Size is reached, the PFC Linux Application will delete the oldest data sequentially according to the First In First Out rule. Then the data will be lost.
RAM Mode
RAM MODE is the default mode -It has a maximum Size of 3 MB, and all data will be lost if power is lost. According to Wago’s manual, the PLC program is still in the development stage and Cache Mode is strongly recommended to be RAM Mode.
SD Card Mode
Conversely, it is important to ensure that data to be sent to the Cloud is not lost due to network failures, and in SD Card Mode data is kept even if the power supply is lost.
Be Careful!
The Lifetime of SD Card
SD Cards have a lifespan, and the number of times they are read and written reduces that lifespan. The WAGO Manual recommends using a Wago SD Card or Microsd Card. Check the manufacturer’s Data Sheet when selecting an SD Card.
Class
Use at least a Class 10 SD card. It takes an unexpected time when the PFC CPU with accumulated cache data starts up.
Speed
Since the read/write speed of an SD Card is slower than RAM, WAGO’s Manual recommends a minimum collection period of 1000ms, too short a period will result in data loss.
Requirements
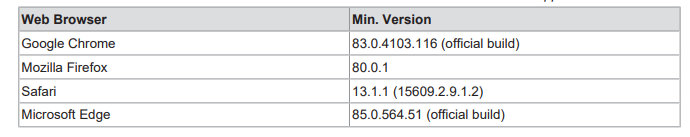
Web Browser
Controller
- PFC100 Controller>Firmware v11
- PFC200 Controller>Firmware v11
- PFC XTR Controller>Firmware v11
Other
- Internet Connection
- E!COCKPIT
Function Block
FbCollectionLogger
By using this Function Block, you can send the current values of variables to the Cloud. When creating a program, it is necessary to organize the variables that you want to send to the Cloud into a “Collection” array, and pass the memory address of the array to FbCollectionLogger.
Note that FbCollectionLogger should call in the Background Task cyclically. (task priority 15).
The maximum number of Collections is limited to 10 with gMAX_COLLECTIONS in default and can be changed from the parameter list ‘Param’.
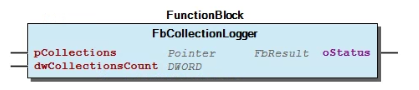
VAR_INPUT
| Variable | Type | Description |
| pCollections | POINTER TO ARRAY [0..(gMAX_COLLECTIONS – 1)] OF typCollection | collection list Pointer・Memory Address |
| dwCollectionsCount | DWORD | The numbers of collection |
VAR_OUTPUT
| Variable | Type | Description |
| oStatus | WagoSysErrorBase.FbResult | The result of Function Block |
typCollection (STRUCT)
| Variable | Type | Description |
| dwCollectionId | DWORD | Collection unique ID |
| sName | STRING(80) | Collection Name |
| pVariableDescriptions | POINTER TO ARRAY [0..(gMAX_VARIABLES – 1)] OF typVariableDescription | Array addresses of typVariableDescription and variable information are stored. |
| dwVariablesCount | DWORD | Number of variables contained in pVariableDescriptions |
| eSamplingDataMode | eSamplingMode Default=eSamplingMode.LIBRARY_DEFAULT_AUTOMATIC | |
| pPublishInterval | POINTER TO TIME | Time interval to publish dataIt will be 1s even if it is set to <1s. (if Sampling Mode = LIBRARY_DEFAULT_AUTOMATIC) |
| pSampleInterval | POINTER TO TIME | Time interval for collecting dataRAM Mode=minimum 100msSD Card Mode=minimum 1000ms |
| xCollectionTrigger | BOOL | Trigger to send all variables to Collection when using Event Base |
| ltTimeStampUTC | LTIME LTIME#0ns | Optionally, it will be a UTC Timestamp.Runtime is automatically generated if not set. |
| typState | typLoggingState | Indicates the state of internal variables and collections |
| typContext | typInternalContext | internal variable |
typVariableDescription (STRUCT)
| Variable | Type | Description |
| dwTypeId | DWORD | Catalog of variables |
| eValueType | eVariableValueType | Data type and size of variable |
| pAddress | POINTER TO DWORD | the address of the variable |
| sTag | STRING(80) | Tag name displayed on Iot Platform |
| sUnit | STRING(5) | Units displayed on Iot Platform |
| xVariableTrigger | BOOL | For use with Event Base, True=send the data |
.
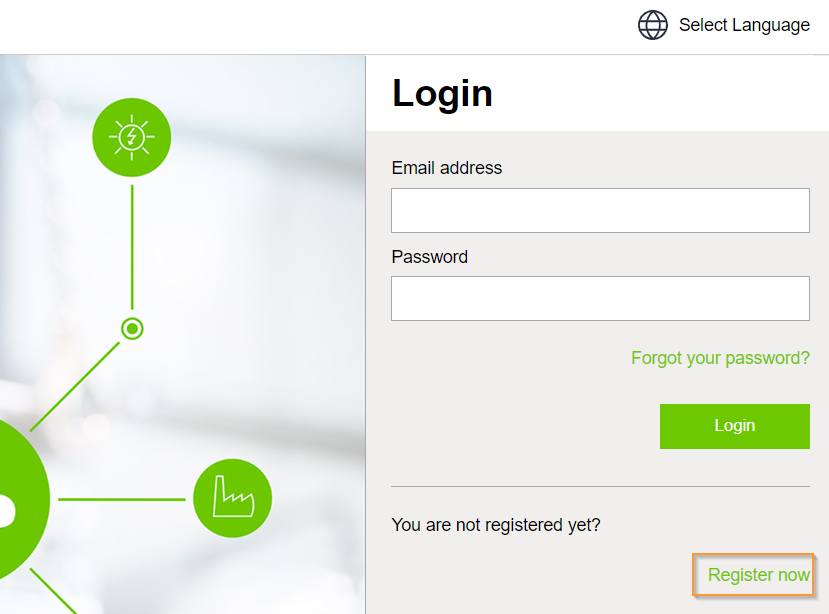
Create An Account!
Access this link to create a Wago Cloud.
For first-time users, click Register now to apply for a Wago Cloud account.
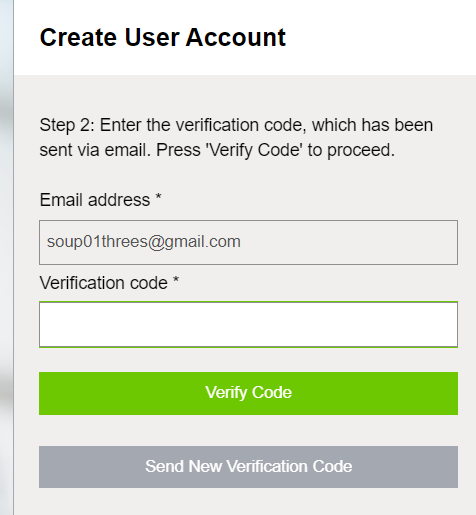
Enter your Email address and press the ”Send Verification Code” button to get the verification code.
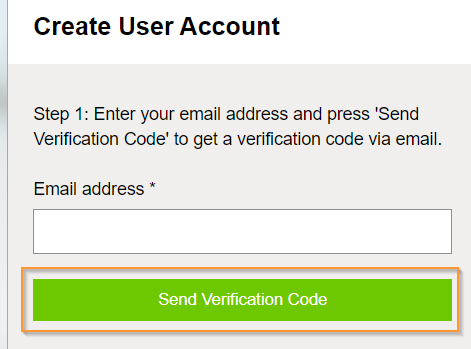
Then the screen is changed and waiting the Verification Code.
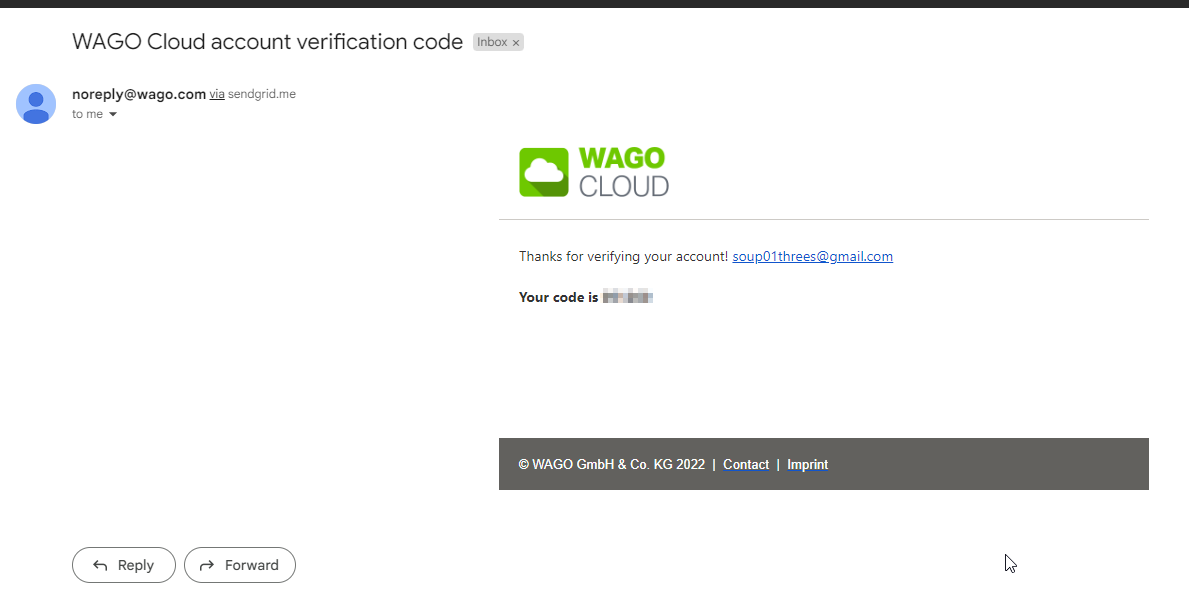
Check your email and copy and paste the code from Wago’s email.
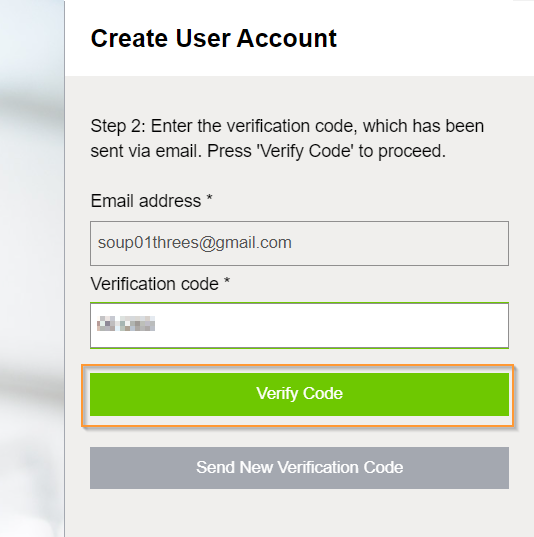
Press Verify Code.
Enter the user information, agree to the terms and register as a user with the Register button.

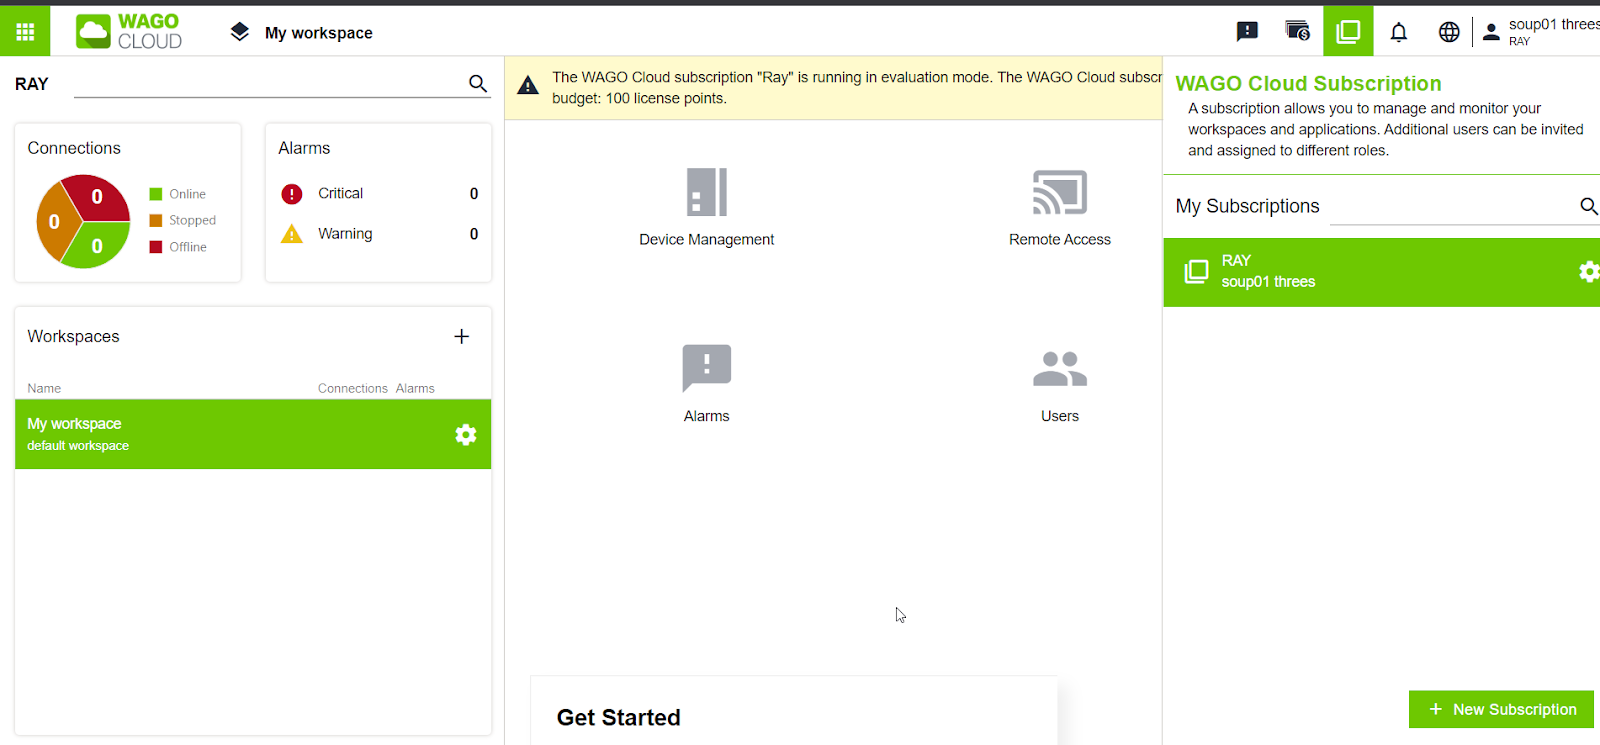
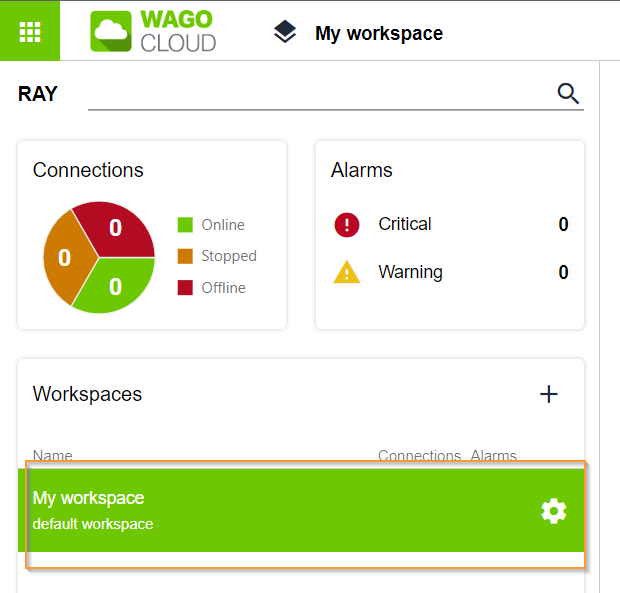
Done! Your account has been successfully registered and the screen is changed to the Wago Cloud Home Page.
Configure WorkSpace
A Workspace is an Area that manages devices connected to Wago Cloud and can be shared with other Wago Cloud Users. Please note that one device can only be associated with one workspace. And there are two permission levels in Workspace.
- Workspace Administrator
You can manage and set up the Workspace. - Workspace User
Default User and can only view the workspace.
When the account is first created, there is already a “My workspace”.
Add Devices
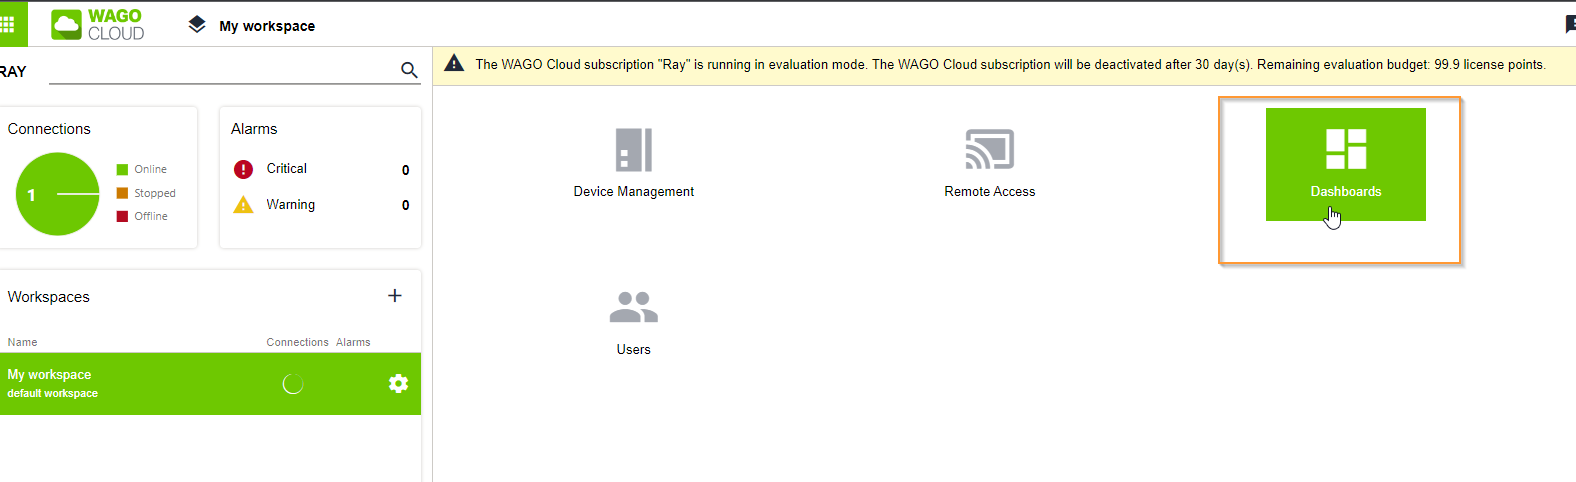
Click the Device Management button.
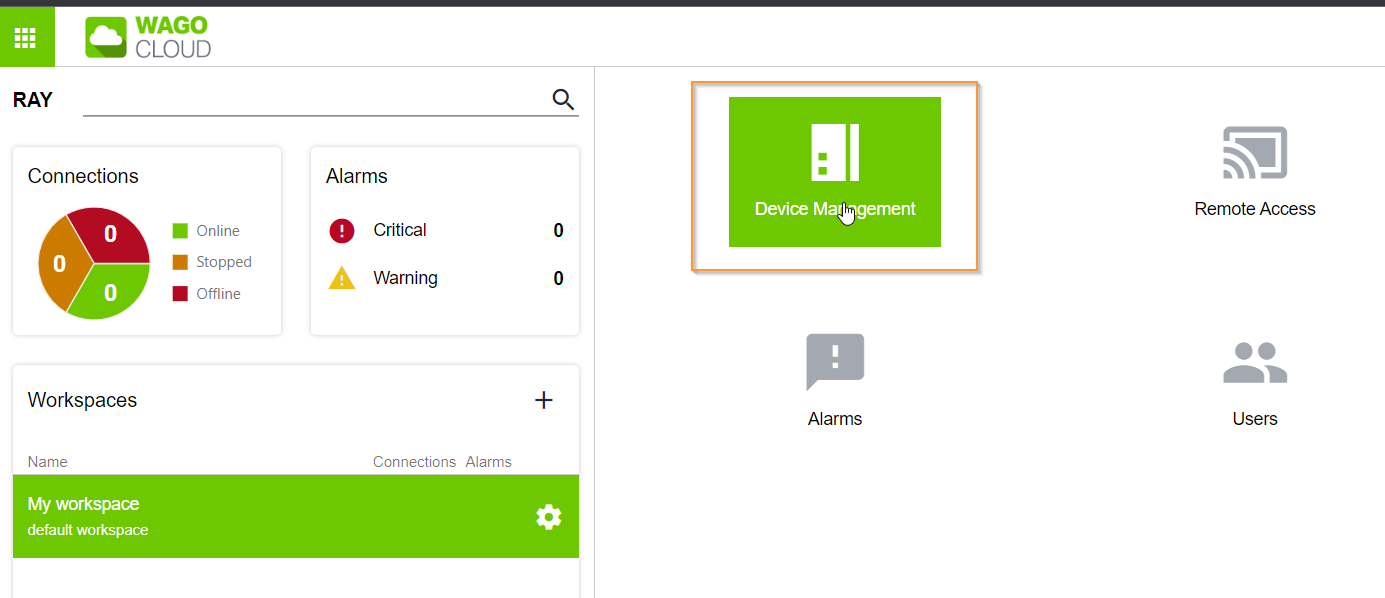
The Device Management screen is displayed.
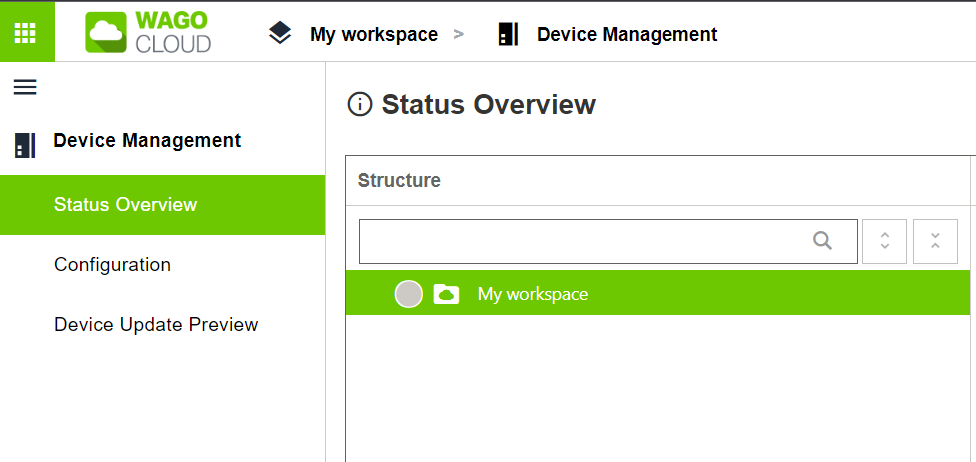
A new workspace has been created.

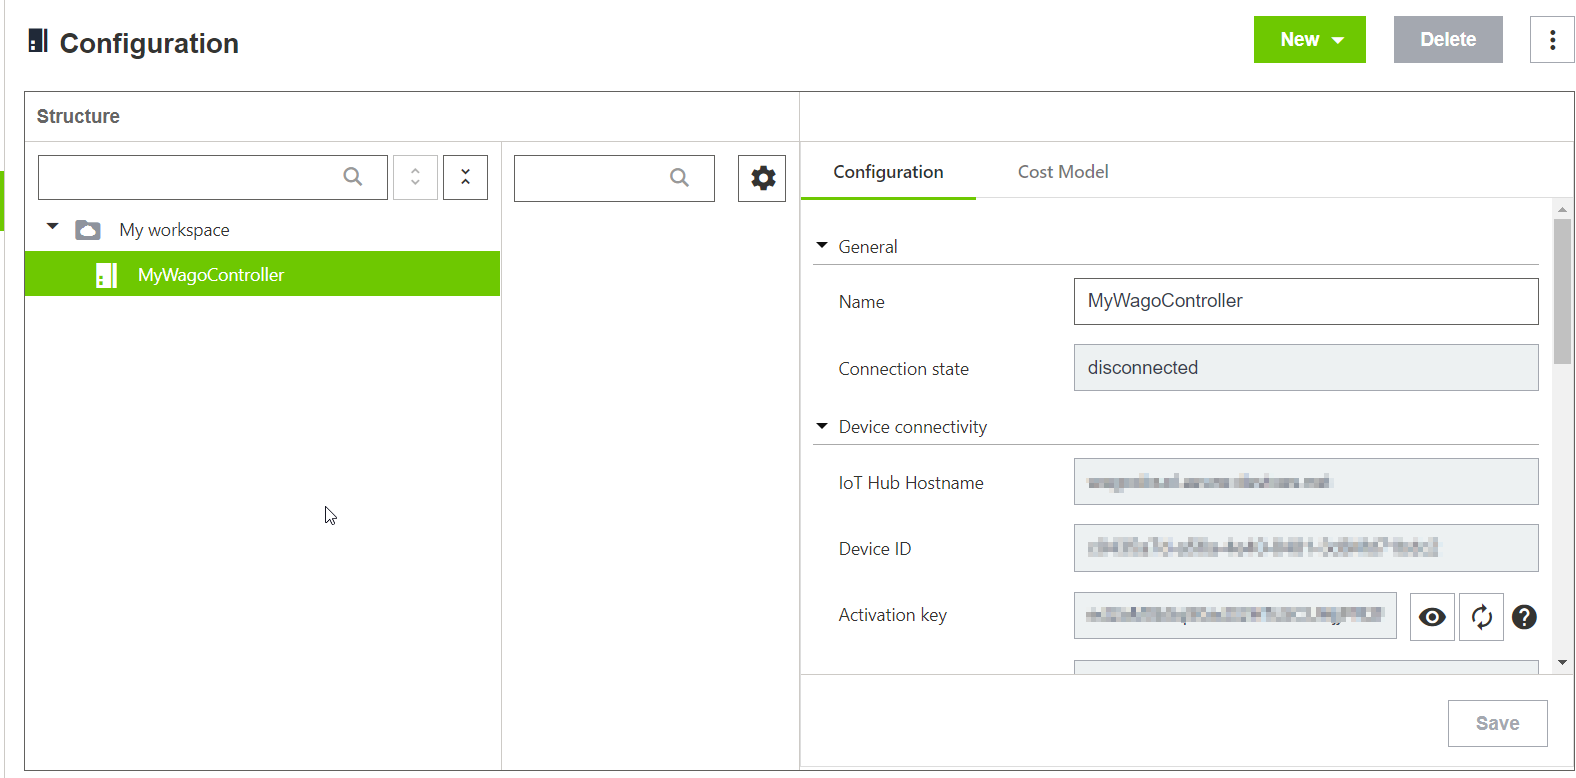
Press New>Devices to create a new device.

Click OK.

Enter the Device name and Create it.

Done! Next, you need to set the Device information according to the PFC Controller.
Controller Side
Configure Wago Controller
Check IP
If you don’t know the Wago Controller’s IP, check the IP with software such as Advanced IP Scanner or Wireshark.
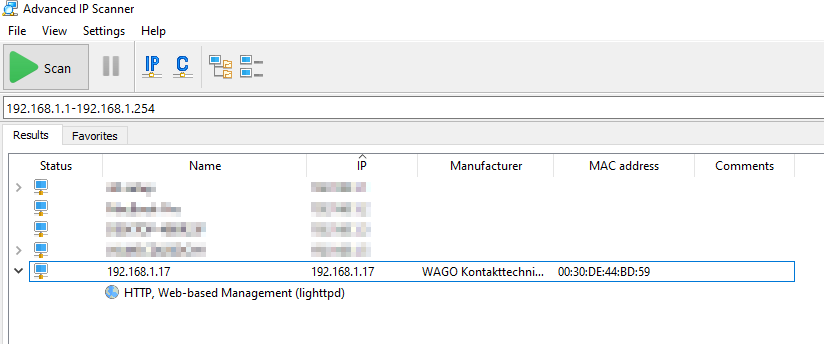
Cloud Connectivity Setup
Access the WBM of PFC Controller (Https://yourPFCControllerIP) and there is an item of Cloud Connectivity. It will list the connection status of PFC Controller and Cloud Application.

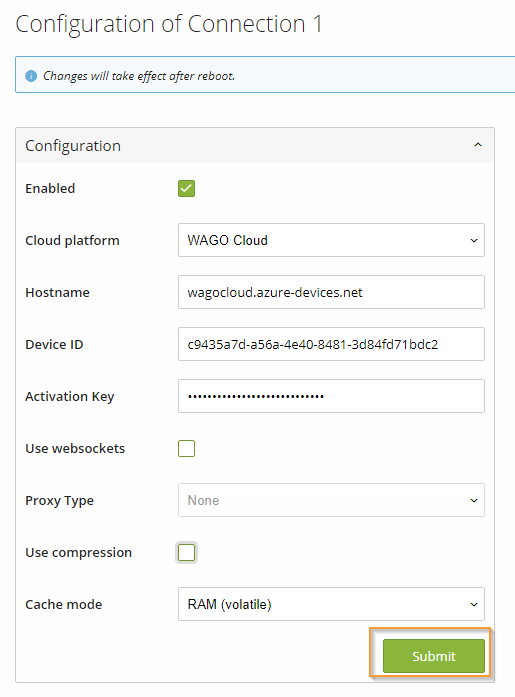
Click Connection1 and configure the connection settings for PFC Controller and Cloud.
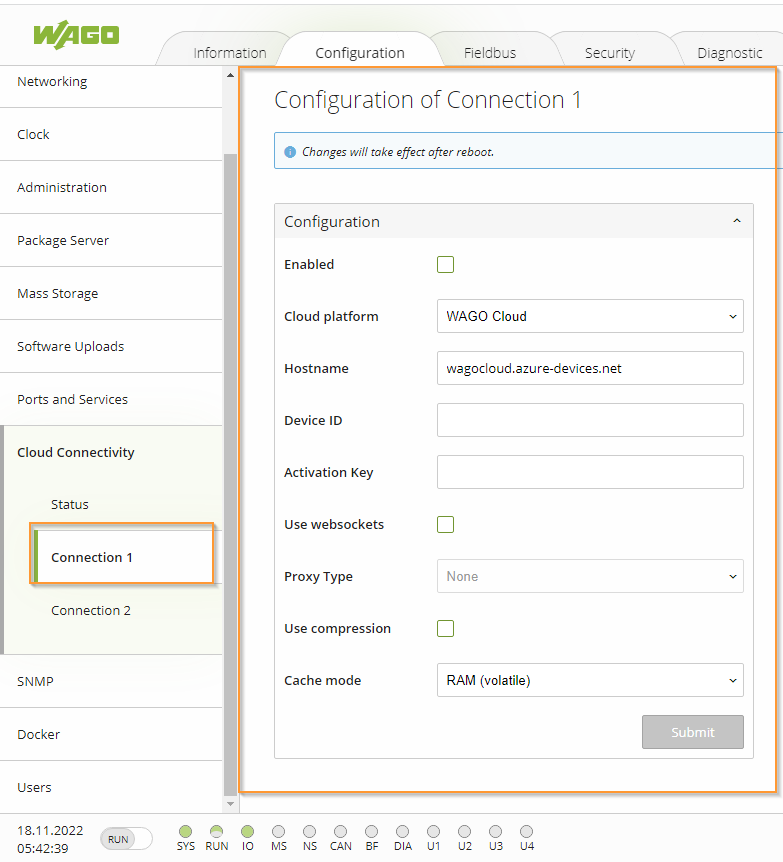
Enabled
First, put an Enabled Checkbox.

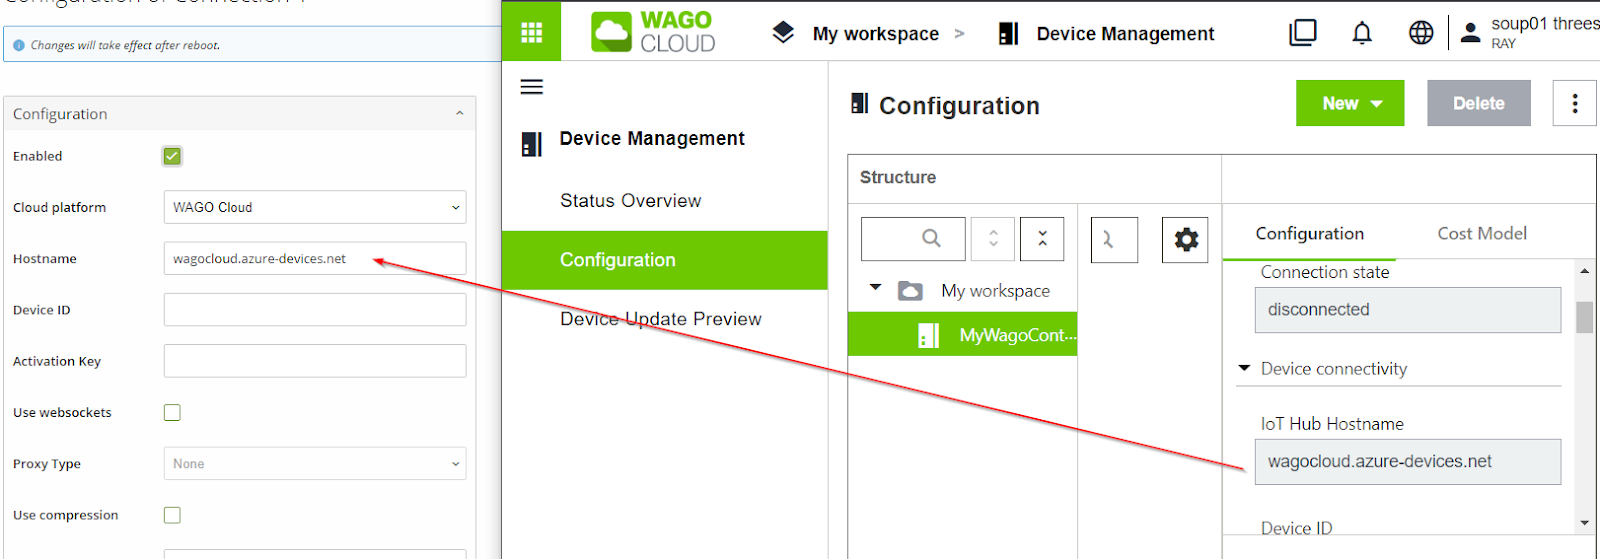
HostName
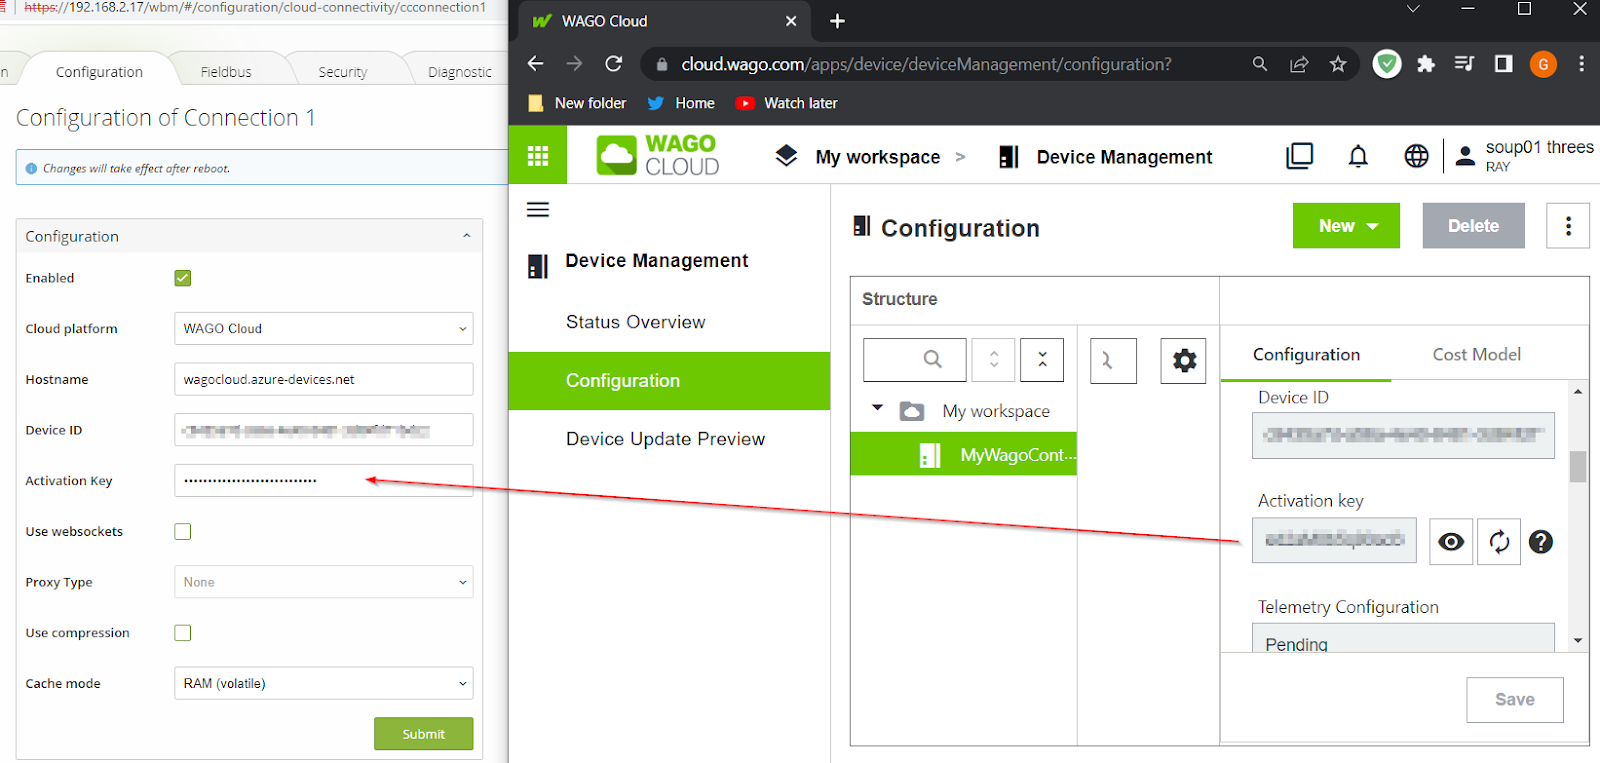
Device ID

Activiation Key
Reboot
Finally, apply the settings with the Submit button and reboot the PFC Controller.
NTP Client
Next is the NTP Client settings. PFC time information is important for the cloud connection, and if the time information is not correct, a Certificate authentication error will occur when connecting to the Cloud Application.
Click Ports and Services>NTP Client.
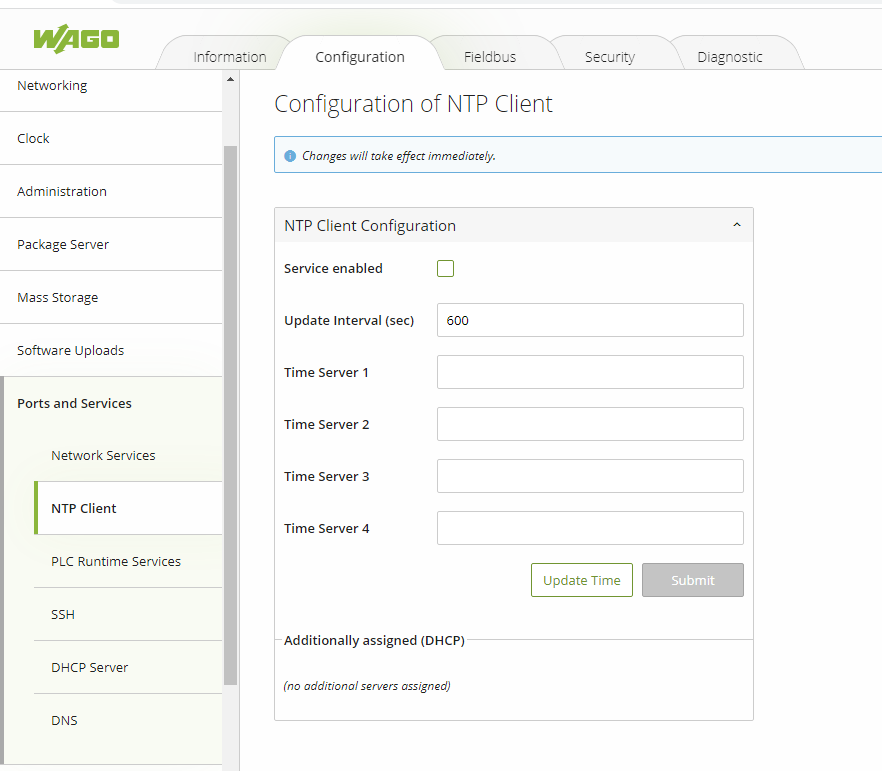
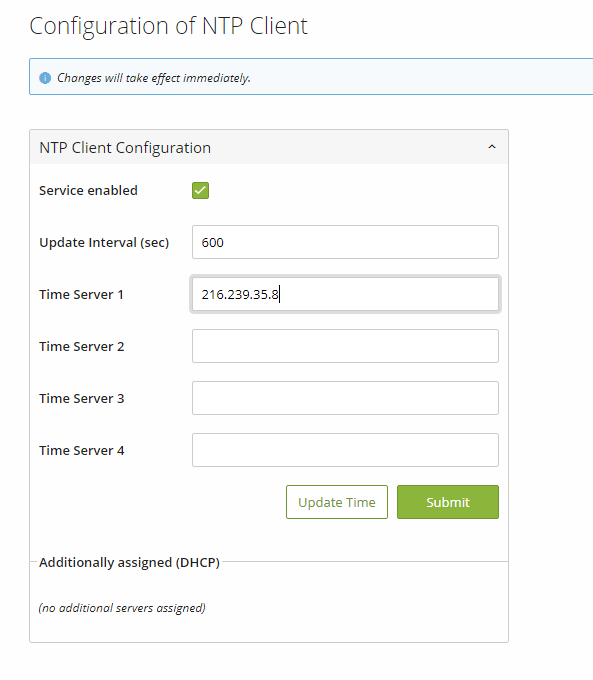
Check the Service enabled checkbox and set Time server1 to 216.239.35.8.
216.239.35.8 is Google’s NTP Server.
Interface Setup
By connecting to the Internet, PCF Controller can link with Cloud Services and time server synchronization. The X11 and X12 of the 750-8215 used this time are Profinet Interfaces, so there is a possibility that the settings will be overwritten by the PN Controller, so please refrain from using X11 and X12 as IOT Ports.
Click Configuration>Networking>TCP/IP Configuration.
I will use X1 this time, and I change the setting of X1 to DHCP Mode and connect it to my home Router.

Check
The State of the Controller added earlier from WAGO Cloud has changed to Connected.
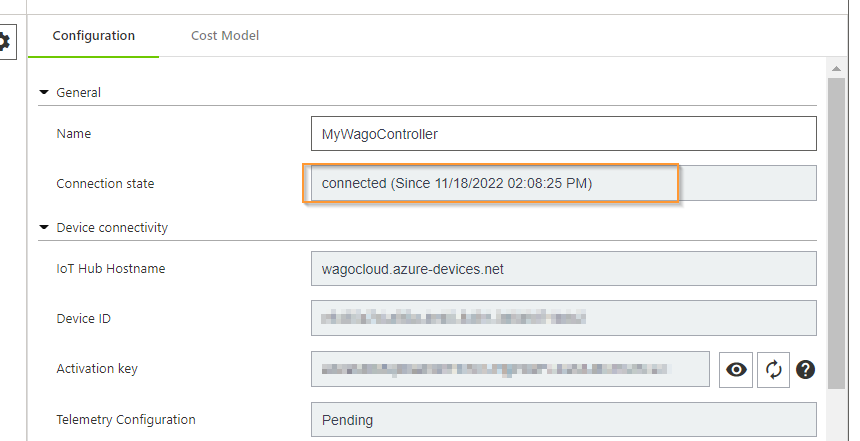
The status is changed to Connected in PFC Controller>Cloud Connectivity>Status>Connection1のCloud connection.Done!

E!COCKPIT
Add WagoCloudApp
Import Library from the Library Manager in E!COCKPIT.
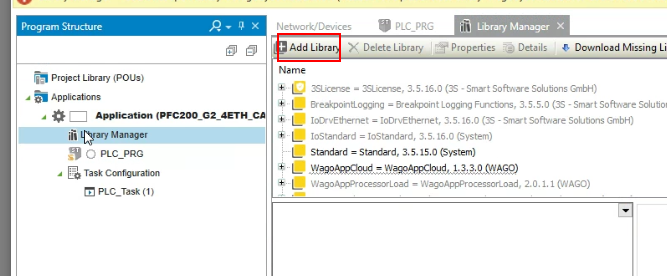
Search WagoAppCloud and Add it into your project.

PROGRAM
Here is the program to initialize the variables of Collections and variableDescription.
| PROGRAM PLC_PRG VAR Counter :INT; Var1:WagoAppCloud.typVariableDescription; Trigger:BOOL; Logger :WagoAppCloud.FbCollectionLogger; Status:WagoSysErrorBase.FbResult; END_VAR VAR RETAIN tSampleInvTime :TIME:=T#1S; tPublishInvTime :TIME:=T#5S; END_VAR VAR MyCollections:WagoAppCloud.typCollection; END_VAR Counter:=Counter+1; Var1.sUnit:=’mm’; Var1.pAddress:=ADR(Counter); Var1.eValueType:=WagoAppCloud.VVT_INT; Var1.sTag:=’Counter’; Var1.dwTypeId:=1; MyCollections.dwCollectionId:=1; MyCollections.dwVariablesCount:=1; MyCollections.sName:=’MyCollections’; MyCollections.pPublishInterval:=ADR(tPublishInvTime); MyCollections.pSampleInterval:=ADR(tSampleInvTime); MyCollections.pVariableDescriptions:=ADR(Var1); Logger( pCollections:=ADR(MyCollections) ,dwCollectionsCount:=1 ,oStatus=>Status ); |
Download
Download your project to CPU and do not forget to Create the Boot Application also.

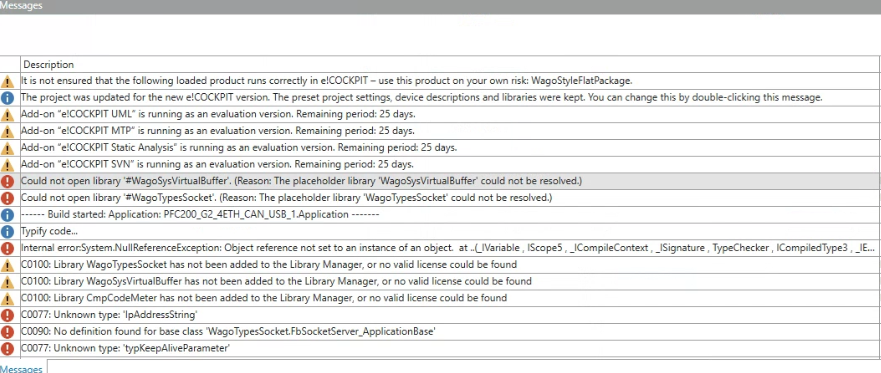
Update Firmware
please update the firmware of PFC Controller and Adjust the Version of Codesys Compiler if there is an library import error.
Result
From Workspace
Done!The Connections status is changed to Online in the WAGICloud platform.
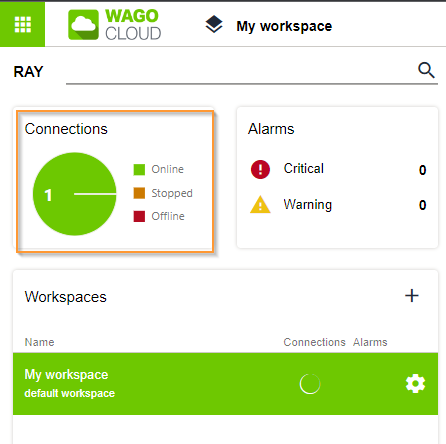
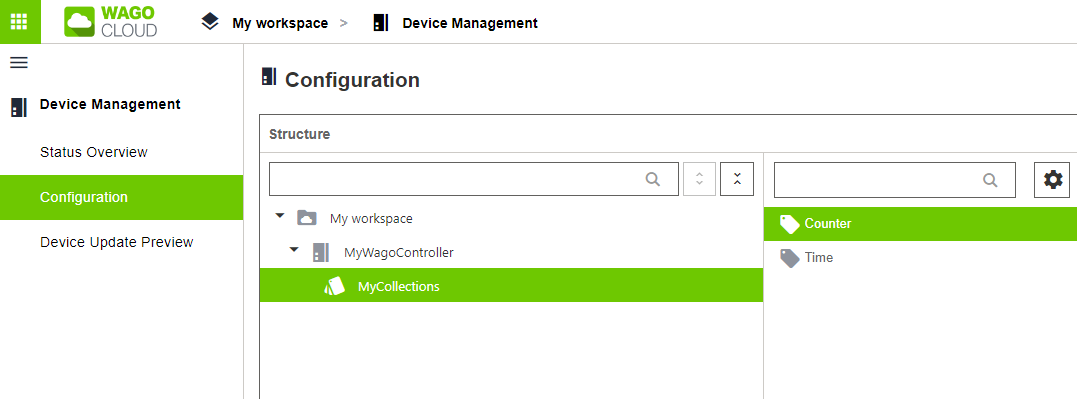
A Collections named “MyCollections” is created in the configuration, and variable “Counter” is added inside.
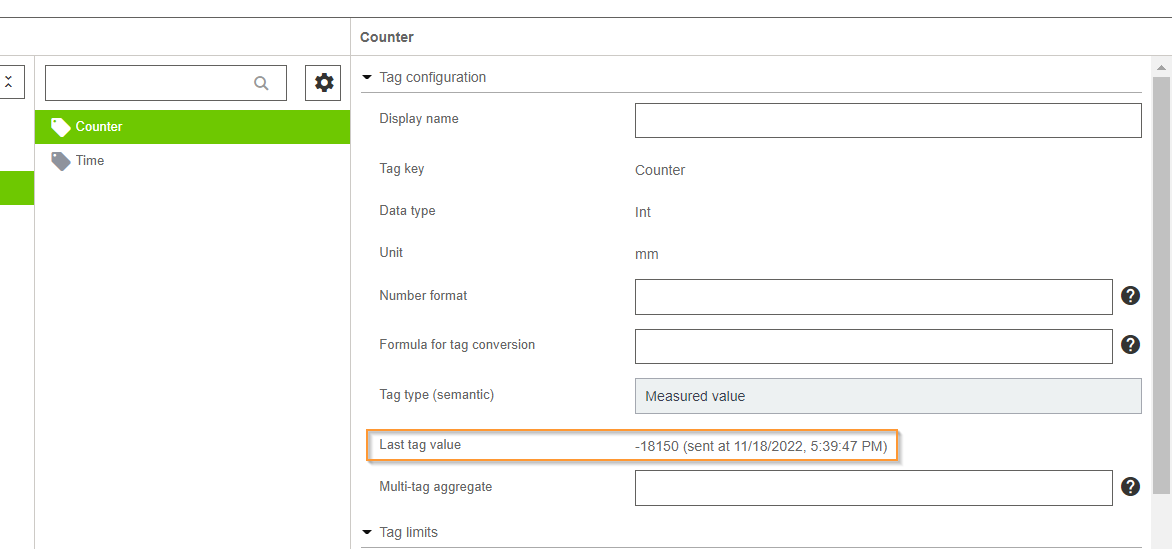
The current value is also updated.
Dashboard
Add New Dashbaord
Now we can create a Dashboard.
Press Add button to insert a new Dashboard.

Choose Dashboard as the Type and OK.
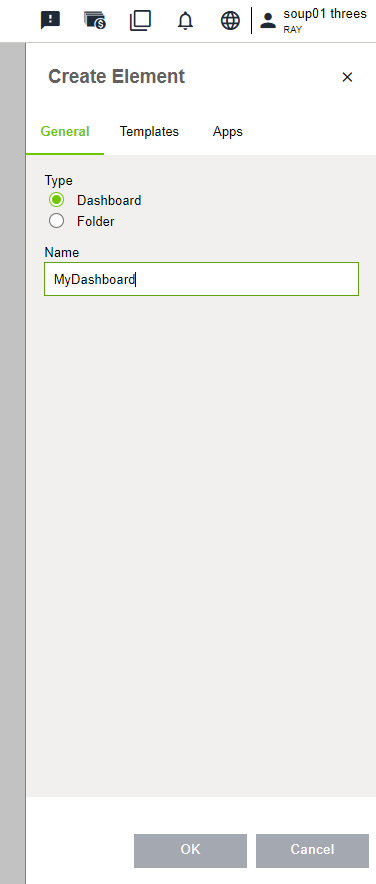
Dashboard is created.
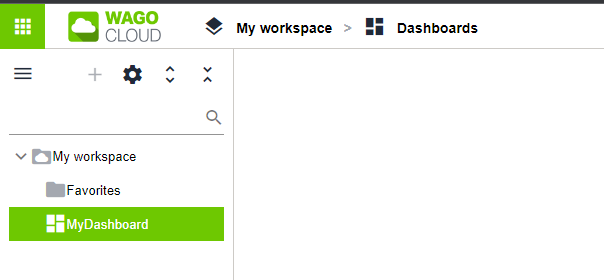
Add new Panel
Now we can Add a new Panel.
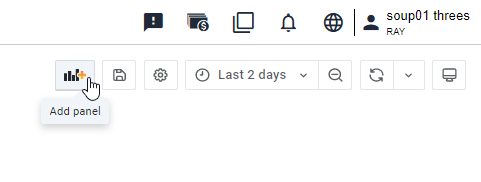
Press “Add new Panel”.

The screen is changed to Panel editor.
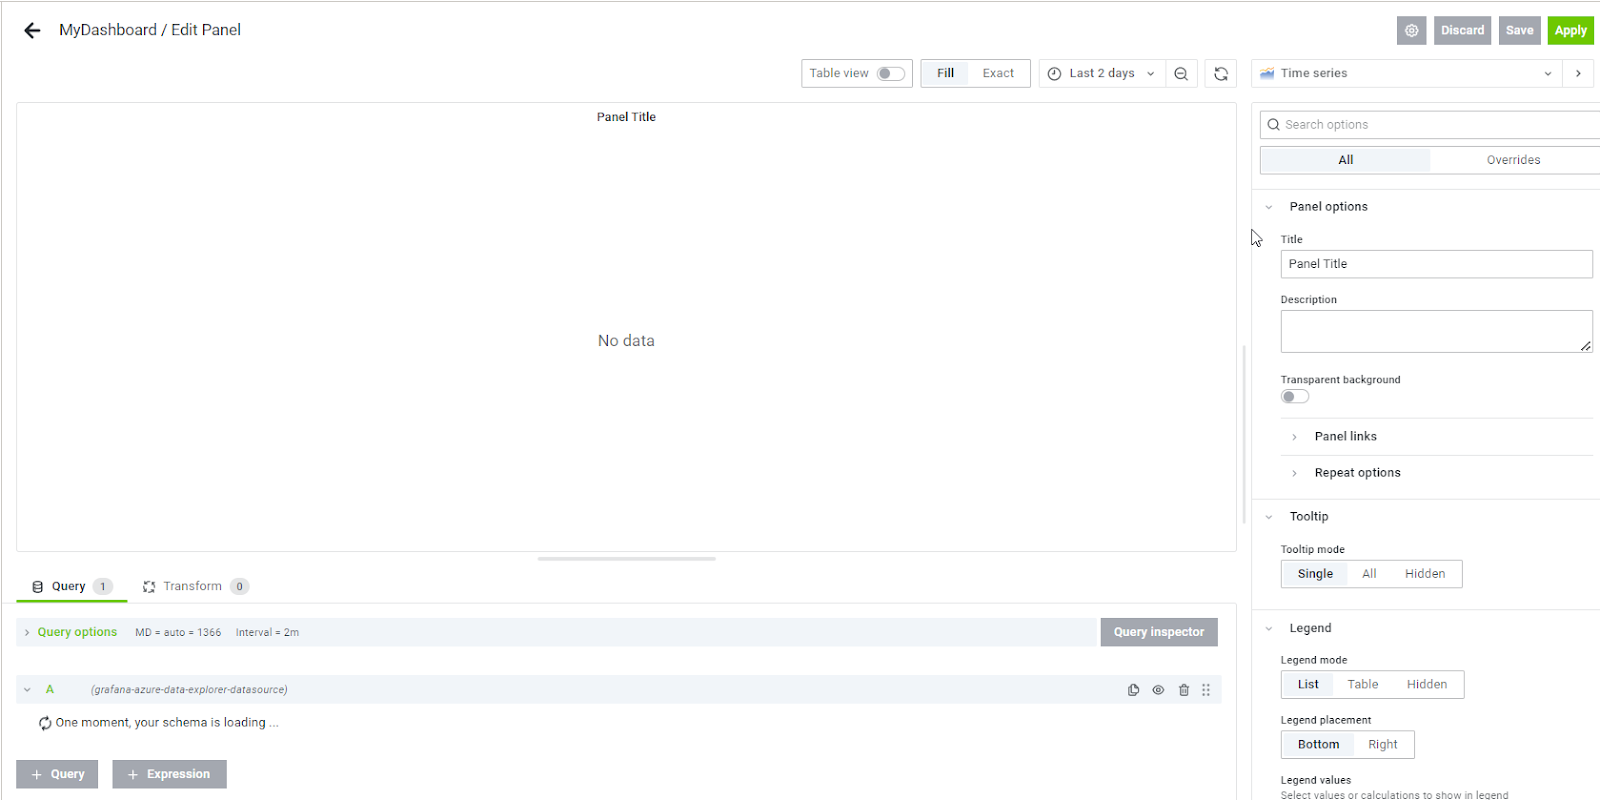
Change Title
We can change the Title and Description of our Panel in the right hand side.
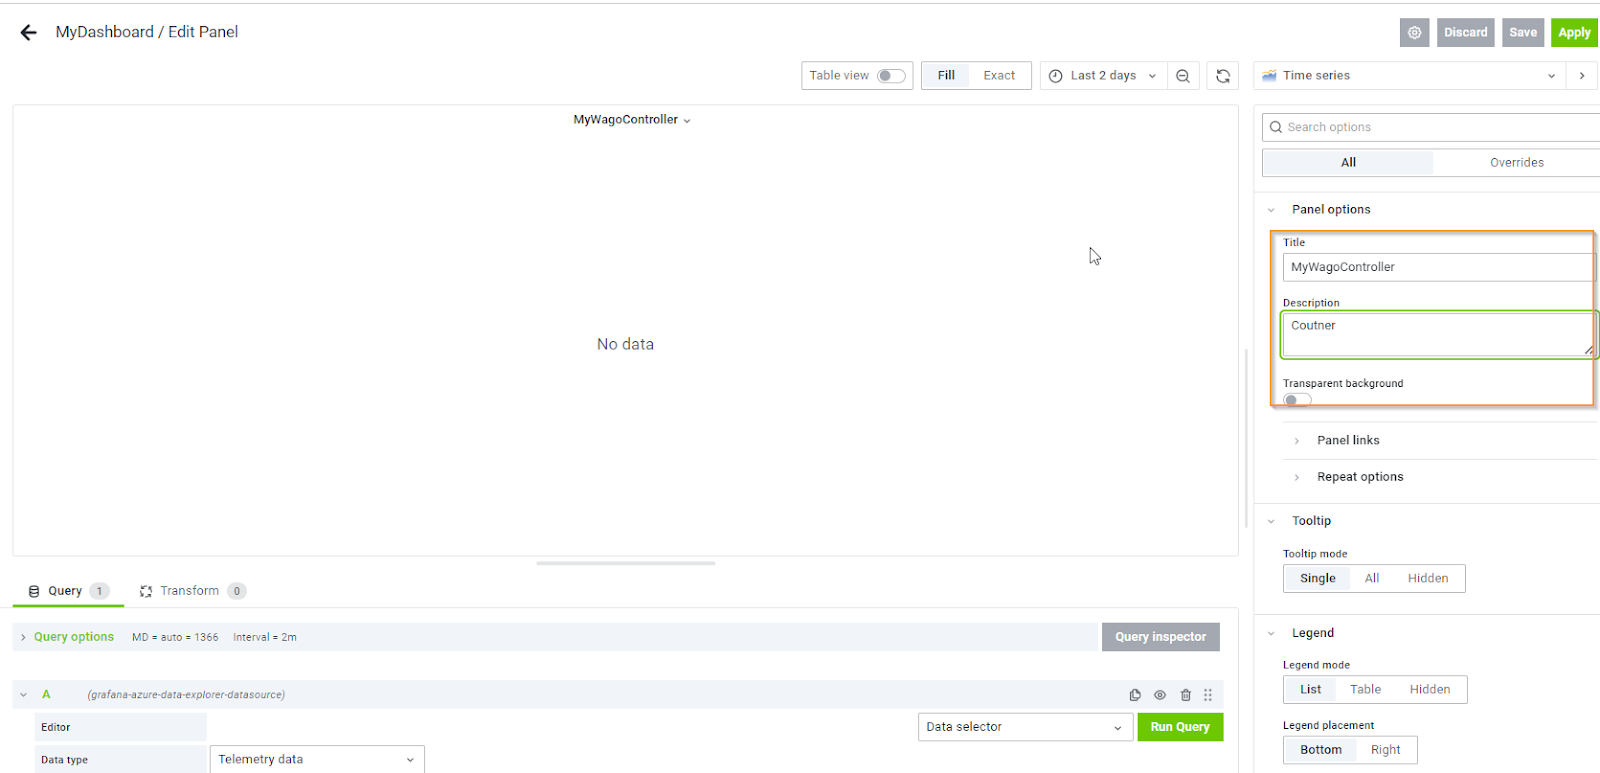
Add Query
There is a Query that is created by default and we can scroll down to edit it.

Choose Telemetry as the Data Type and choose Counter in MyCollections , Check this box>press Run Query to test the request.
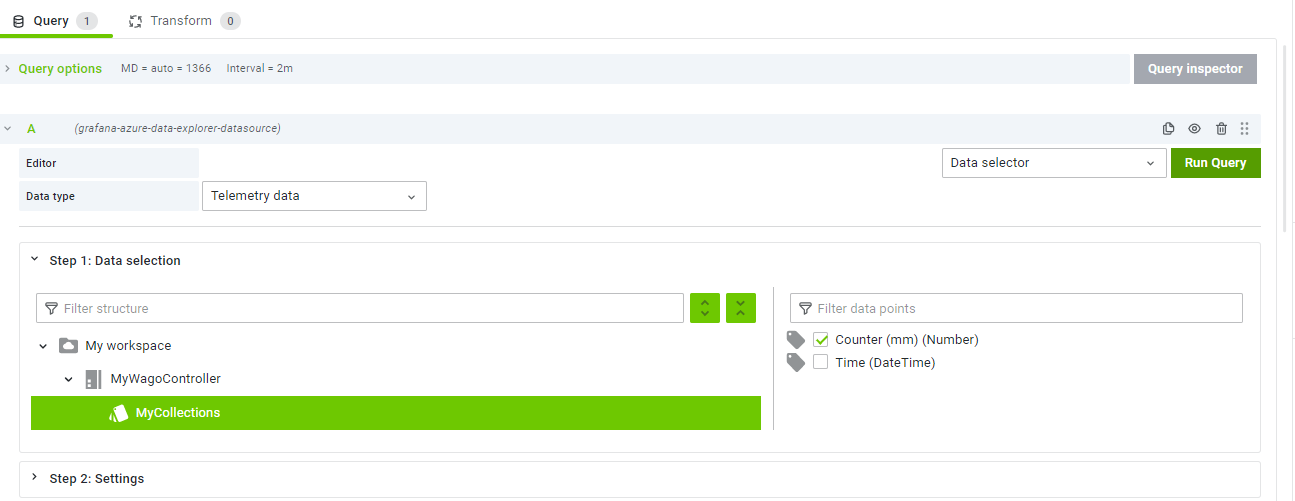
Sure you can display the data as Bar Chart,Gauge but not only Time series.
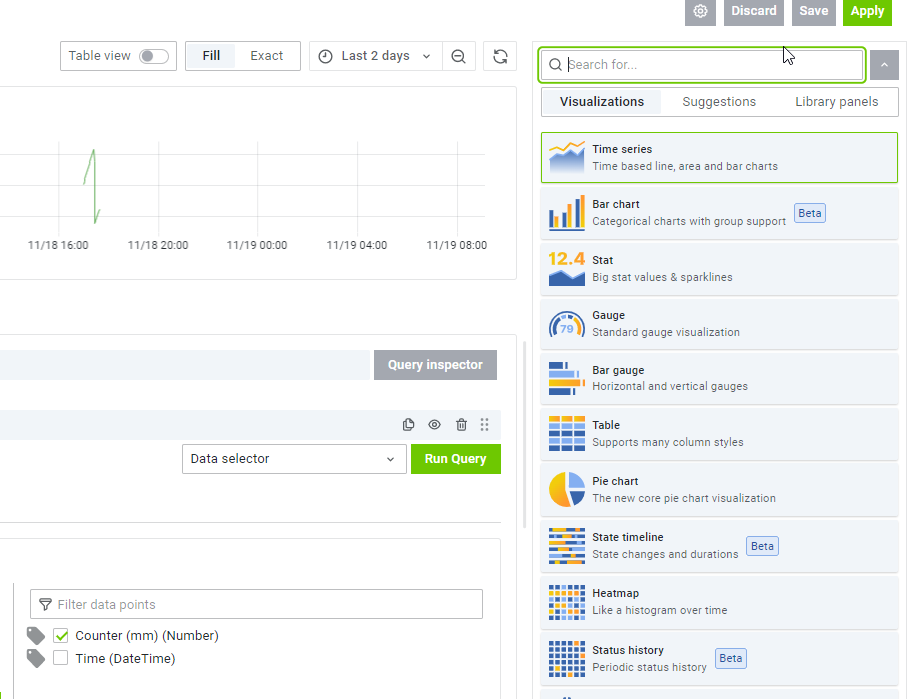
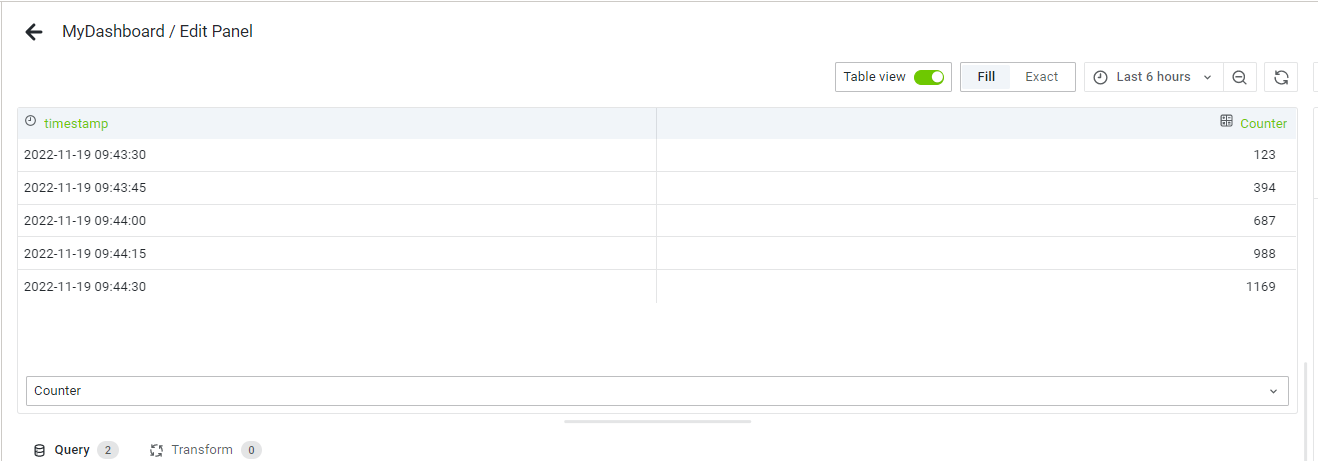
Let’s select “Table” as our visualizations.

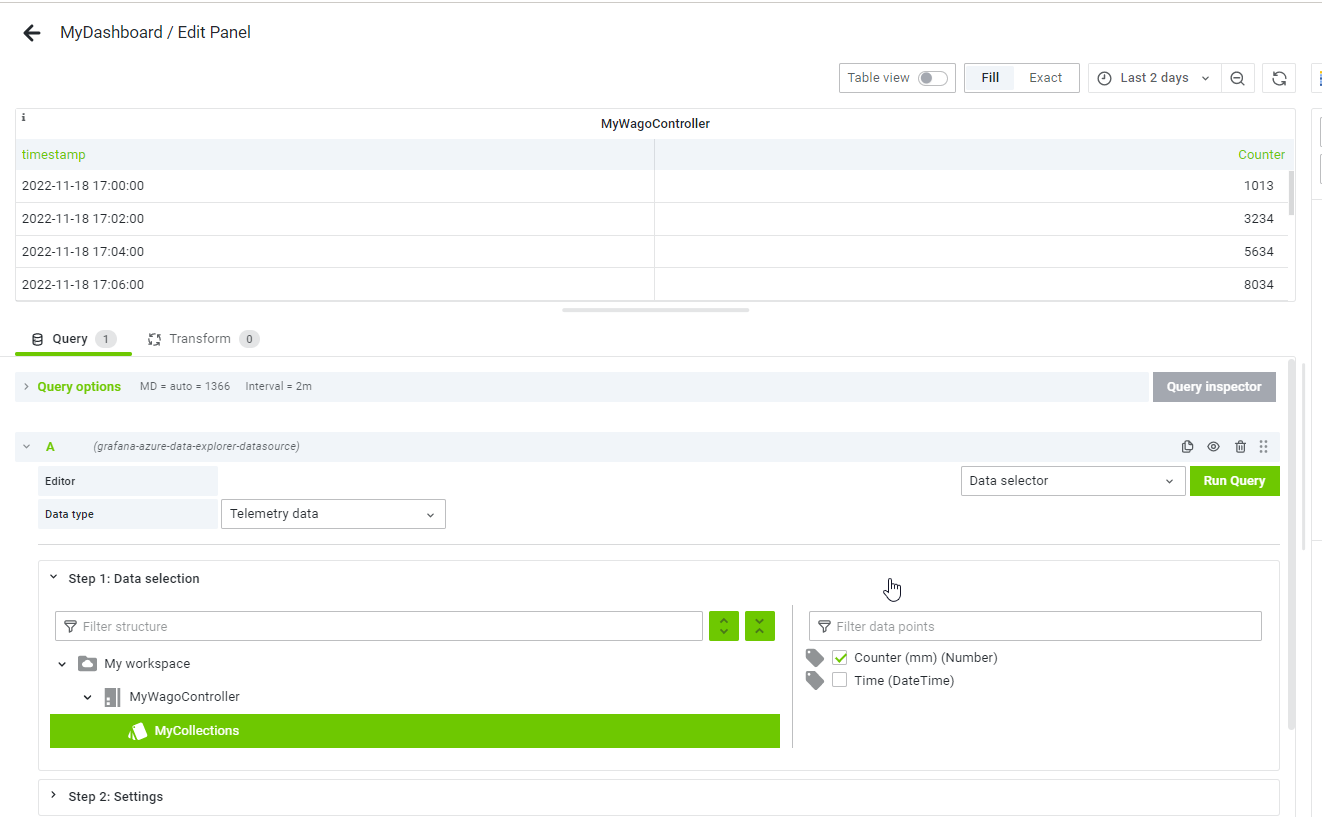
Done!The data is displayed as Counter value and time stamp with a Table format.
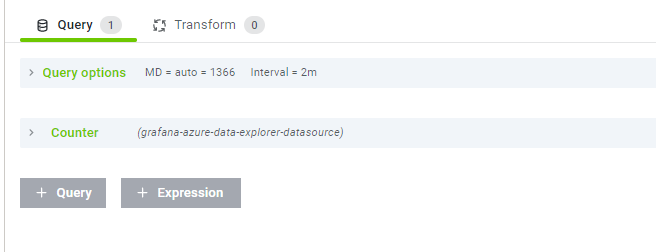
we can close the Query by clicking the > button.

And we can edit the query name by clicking the pencil icon.

The name of Query is changed to “Counter”.
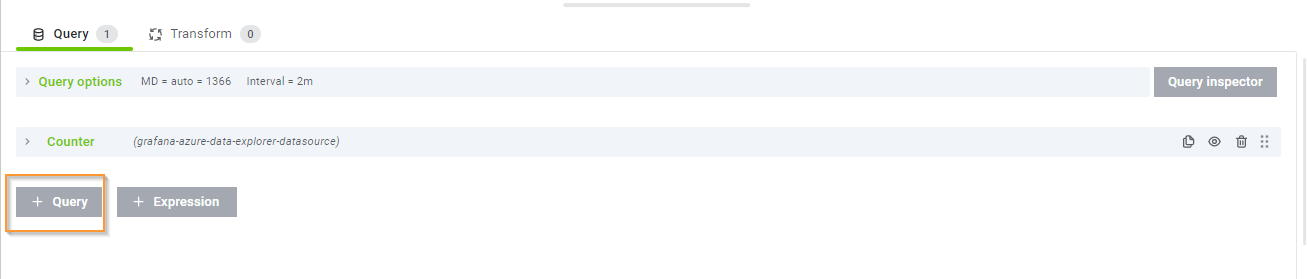
Add more Query
we can add more Query by pressing the “+Query” Button.
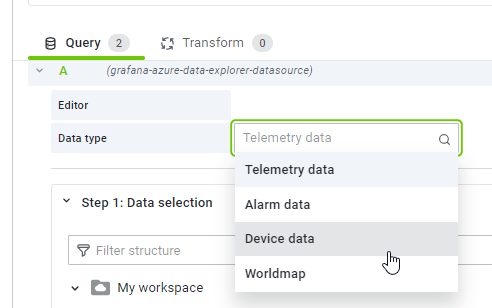
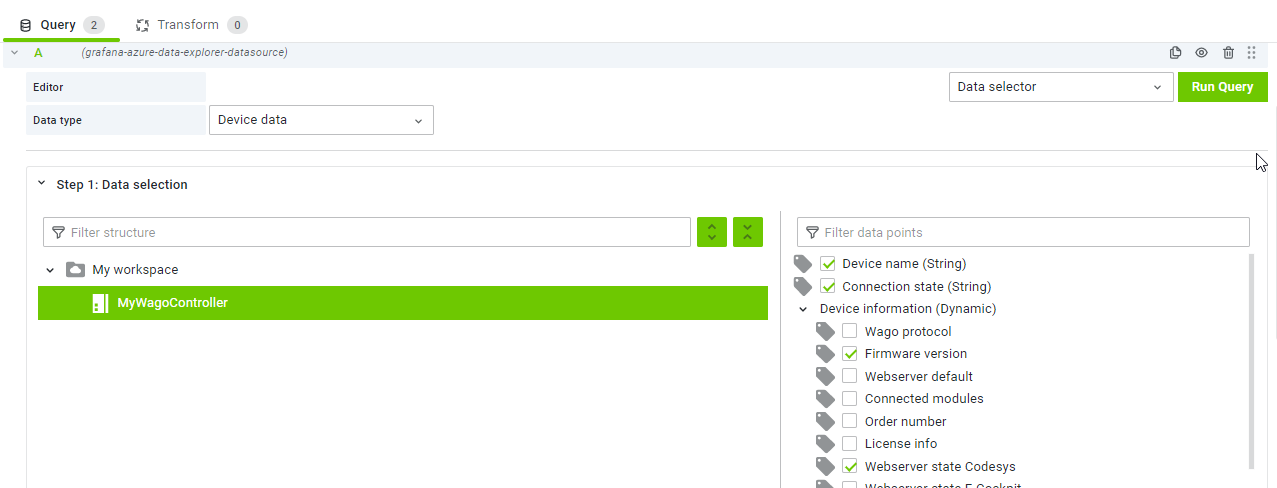
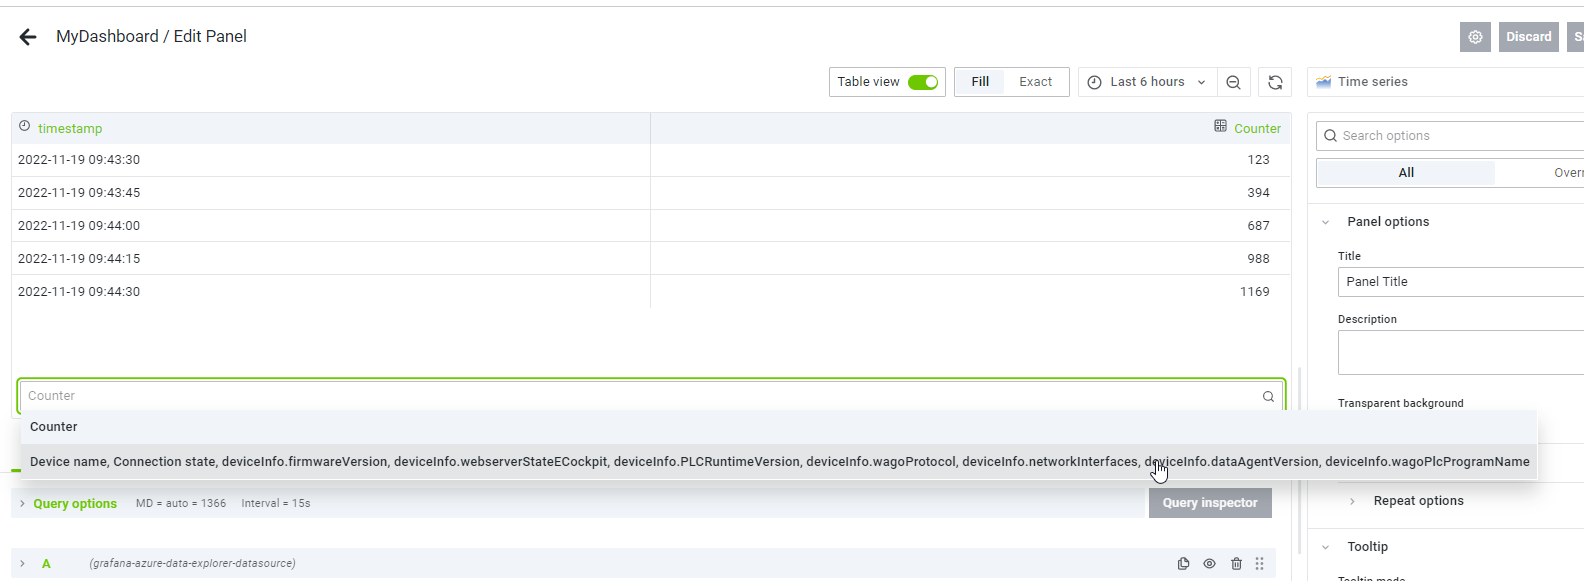
Choose Device data as your Data type – because I would like to collect the status of PFC Controller.
Let’s choose some variables like Firmware Version,runtime..
Change the view to Table view.
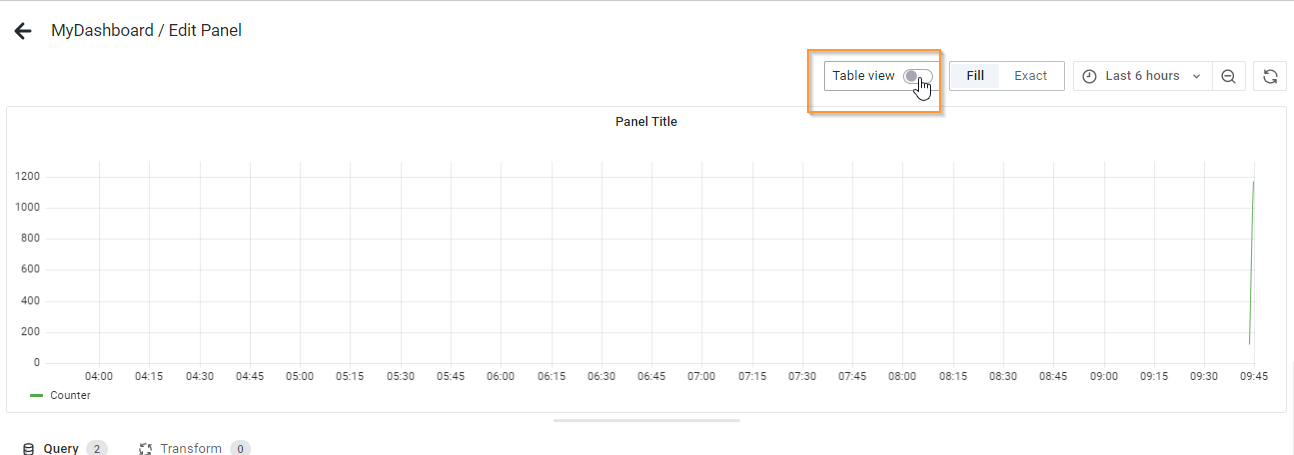
The data is displayed as Table format.
And we can choose the Query from the Drop list.
Done!

Check it!
Finally, please save the Panel and confirm the data in Dashboard.
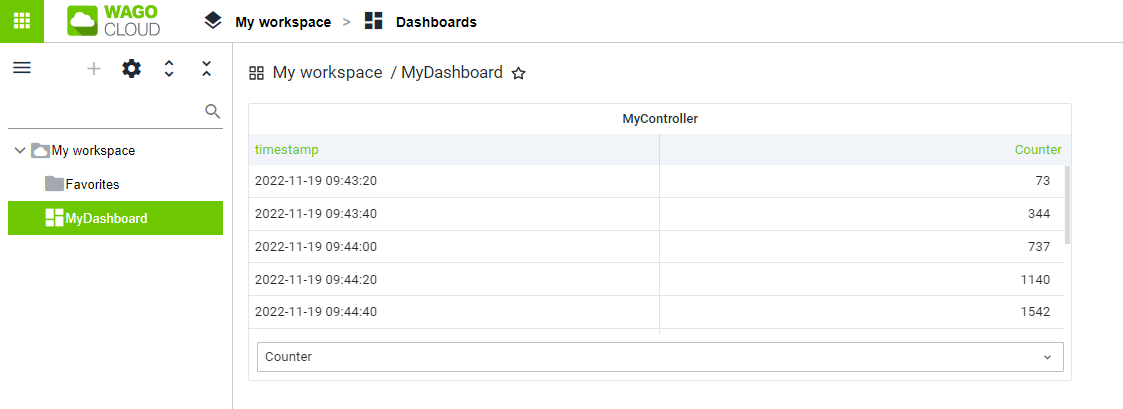
Done!
