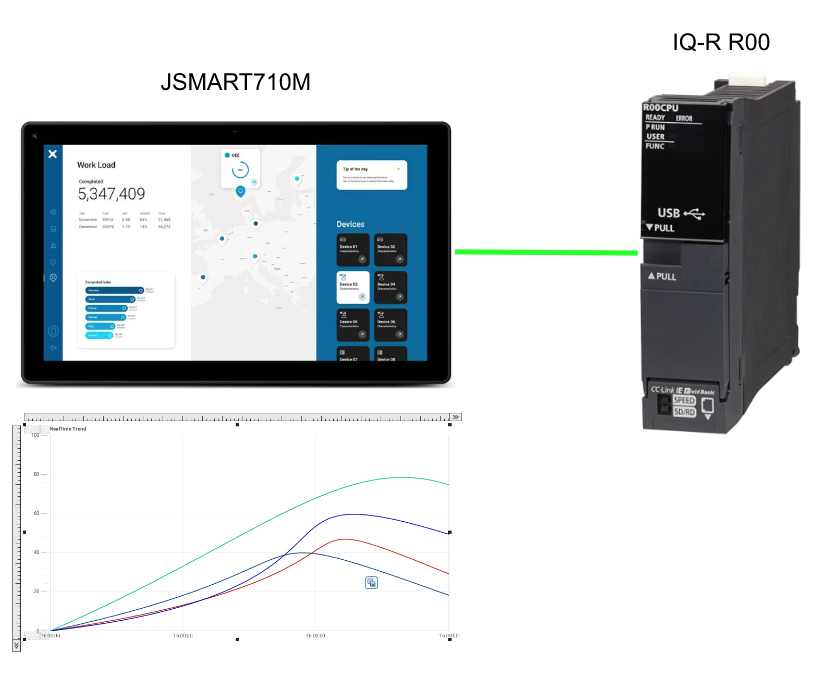
This article explains how to connect the IQ-R R00CPU to the EXOR JSMART panel and create a Trend View.
Let’s Start!
Target
This is the Target for this article. we will exchange data with Mitsubishi IQ-R CPUs, display RealTime Trend and History Trend, and still operate Mitsubishi M devices with the Toggle button.
Reference Link
Implementation
GXWORK Side
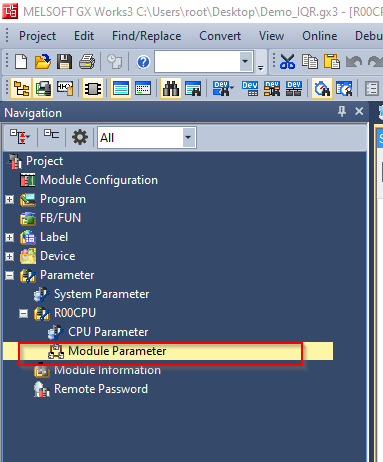
Create a project and open Parameter>Module Parameter.
IP Address
Set IP address and Subnet Mask from Basic Setting.
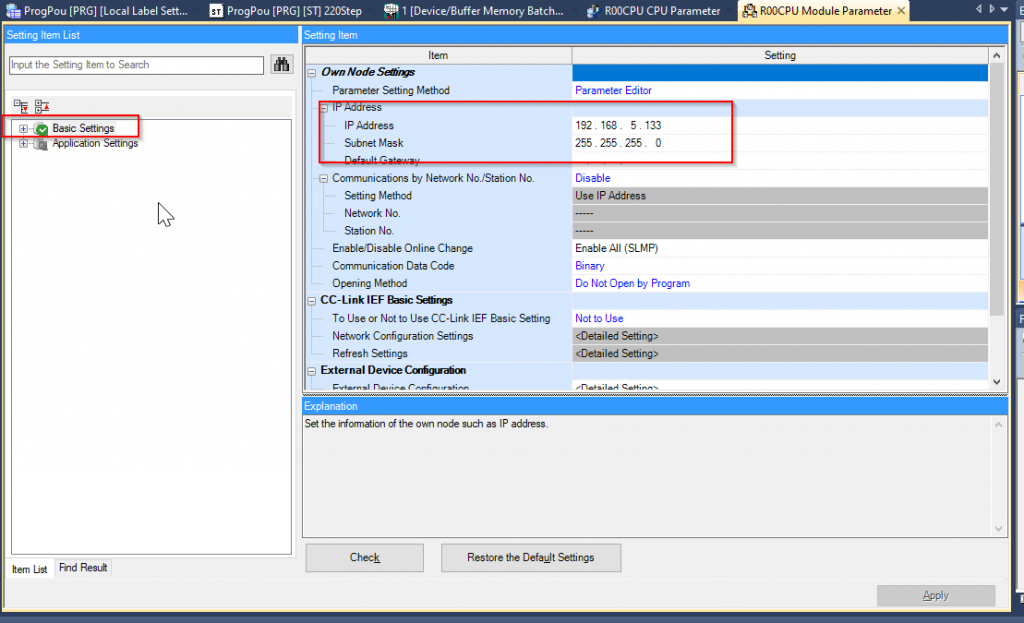
SLMP Configuration
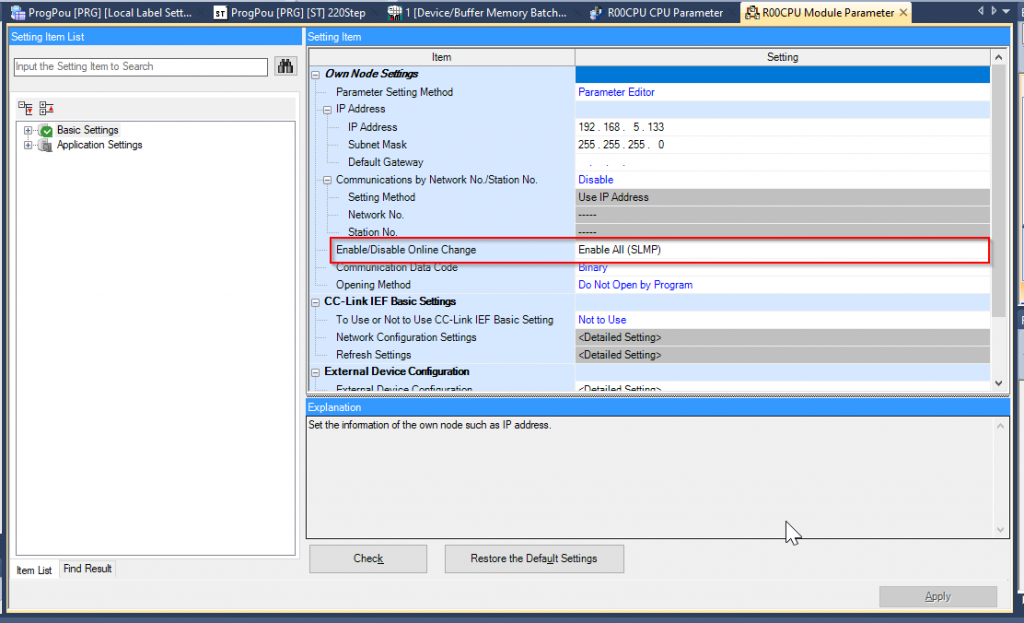
To connect the EXOR JSMART panel to the IQ-R, the SLAMP connection must be enabled.
Go to Communication by Network No./Station No.>Enable/Disable Online Change to “Enable All (SLMP)”.
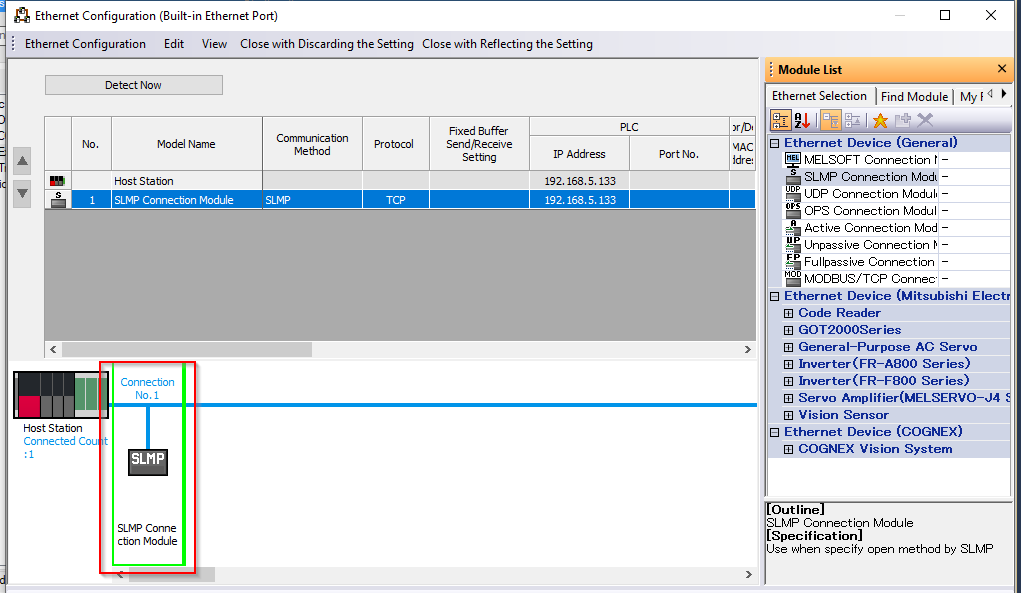
Next, open External Device Configuration.
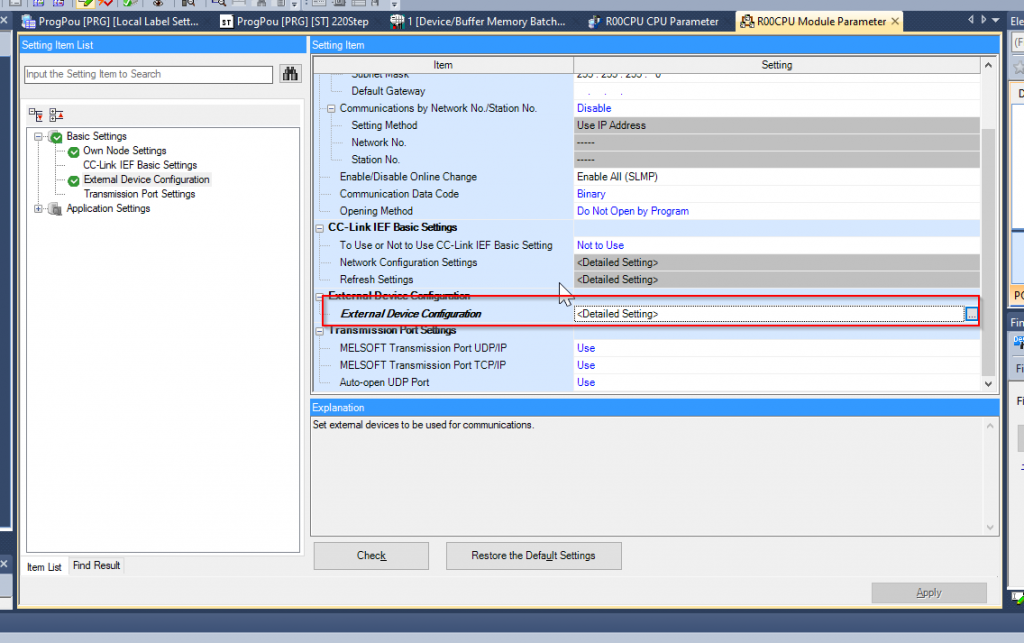
The screen will change to the Ethernet Configuration construction screen.
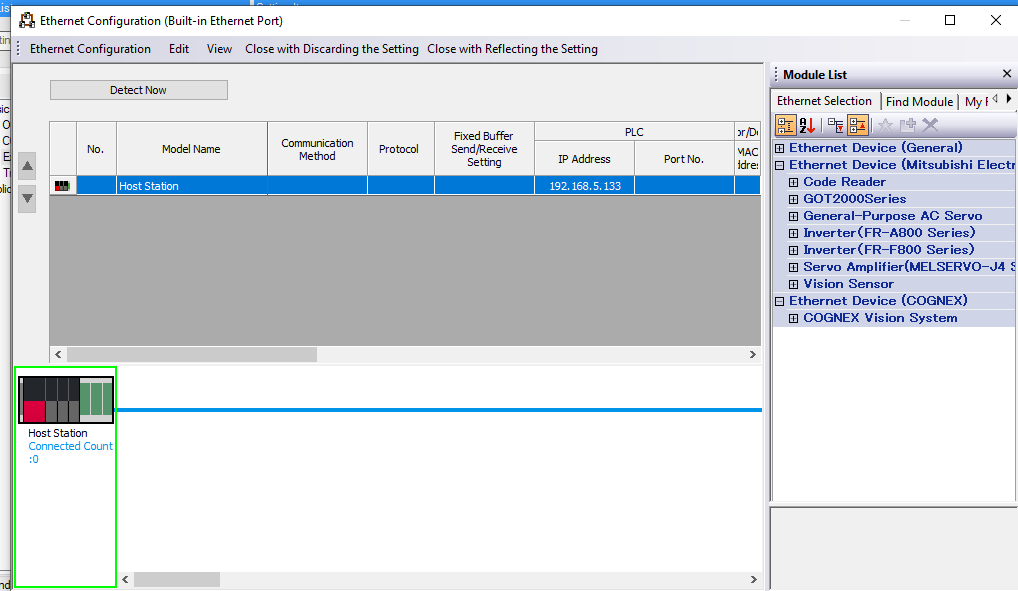
Add the SLMP Connection Module from Ethernet Selection.
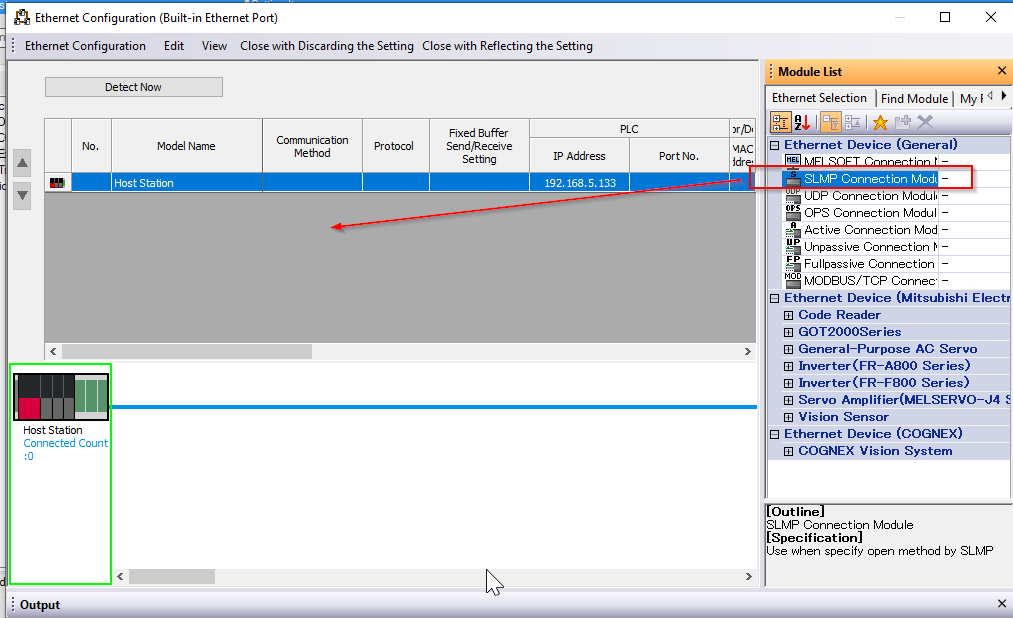
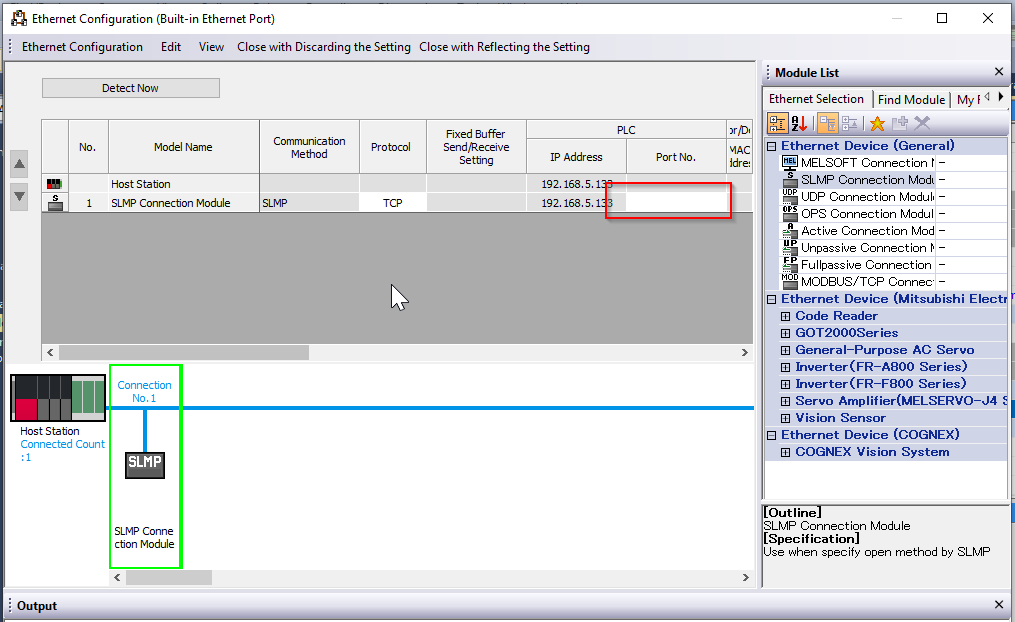
SLMP Connection Module has been added.
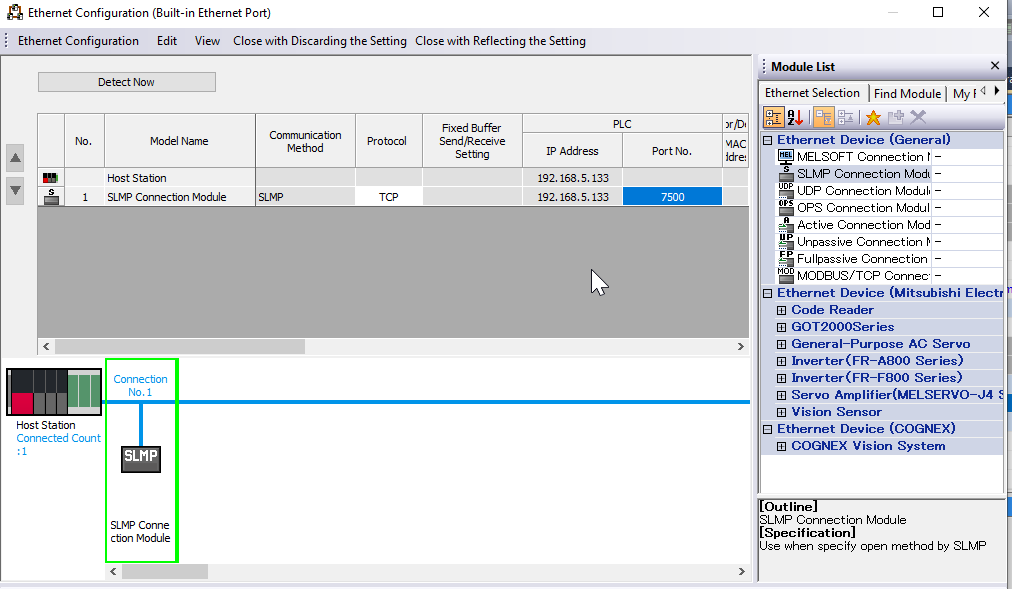
Set the Port No. This number will be needed later in JMobile’s Connection settings.
For this article, we have set Port No.: 7500.
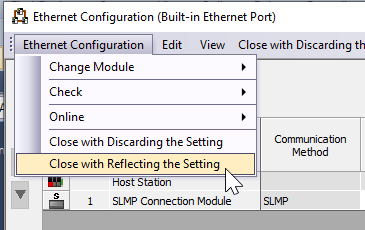
Save the settings under Ethernet Configuration>Close with Reflecting the Setting.
Testing Program
Here is the program for this test: Define 10 real variables from D200 and 10 integer variables from D100 in Local Label.
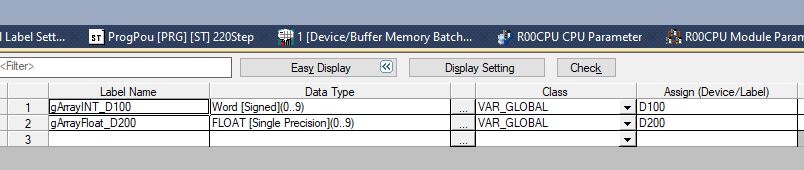
The program generates a simple SINE WAVE.
| tReflesh(in:=NOT tReflesh.Q, PT:=t#50ms); IF tReflesh.Q THEN r32SetPoint[0]:=r32SetPoint[0]+0.01; gArrayFloat_D200[0]:=SIN(r32SetPoint[0]); gArrayFloat_D200[1]:=SIN(r32SetPoint[0])*-1.0; gArrayFloat_D200[2]:=SIN(gArrayFloat_D200[0])*2.0; gArrayFloat_D200[3]:=SIN(gArrayFloat_D200[0])*-2.0; gArrayFloat_D200[4]:=SIN(gArrayFloat_D200[0])*3.0; gArrayFloat_D200[5]:=SIN(gArrayFloat_D200[0])*-3.0; gArrayFloat_D200[6]:=SIN(gArrayFloat_D200[0])*4.0; gArrayFloat_D200[7]:=SIN(gArrayFloat_D200[0])*-4.0; gArrayFloat_D200[8]:=SIN(gArrayFloat_D200[0])*4.0; gArrayFloat_D200[9]:=SIN(gArrayFloat_D200[0])*-4.0; IF r32SetPoint[0] >= 360.0 THEN r32SetPoint[0]:=0.0; END_IF; END_IF; |
JMobile Side
The next step is to build the JMobile side.
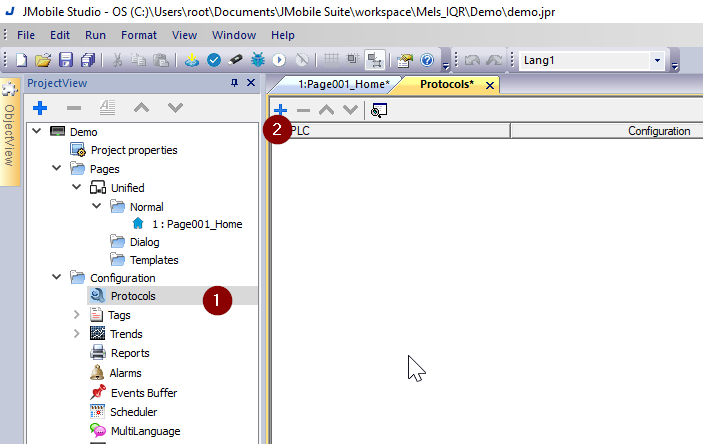
Protocols
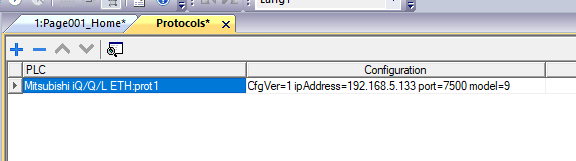
Create a Connection to connect to the IQ-R using the Configuration>Protocols>+ button.
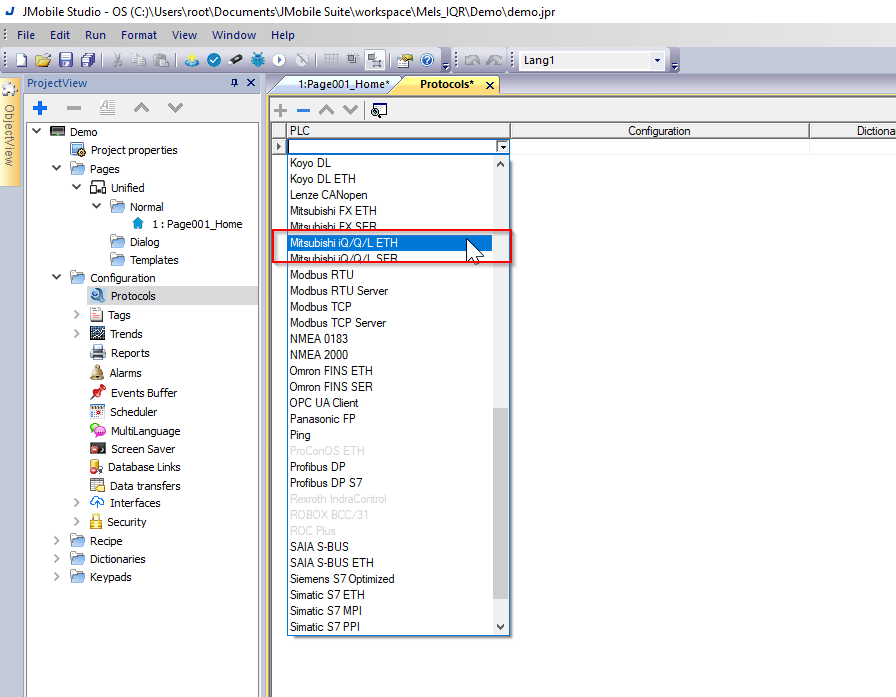
Choose Mitsubishi iQ/Q/L ETH from the Drop-List.
The Connection Settings screen appears.
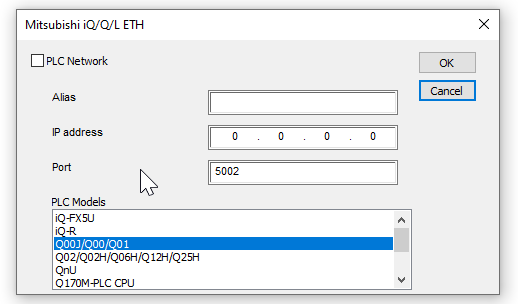
PLC Module
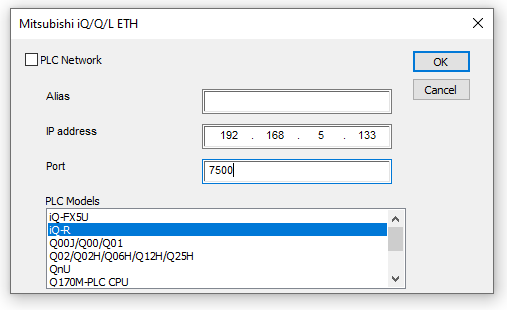
Since the IQ-R CPU is used in this project, select IQ-R for PLC Modules.

IP Address/Port
IP address and Port number should be set according to the Ethernet Configuration.
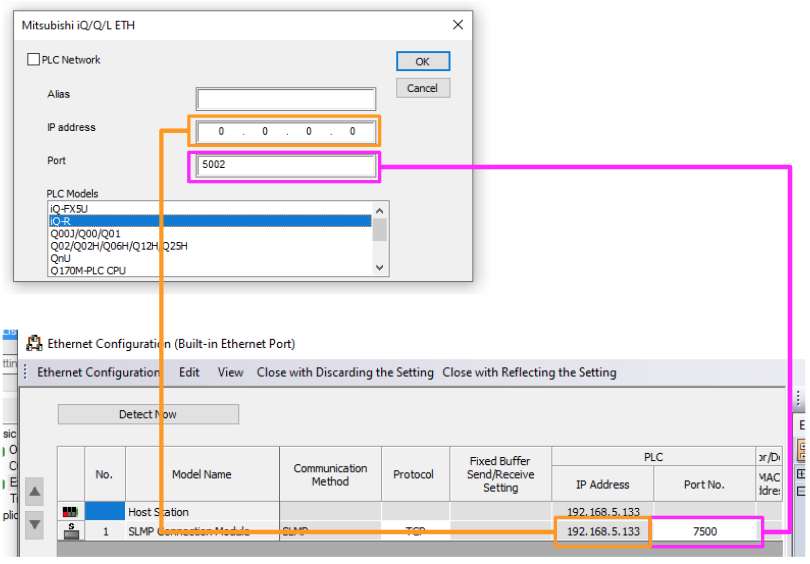
So, IP is 192.168.5.133, Port is 7500, and OK to confirm.
Done!
Add Tags
Next, add Tags by going to Configuration>Tags>IQ-R Connection>+ button that you just added.
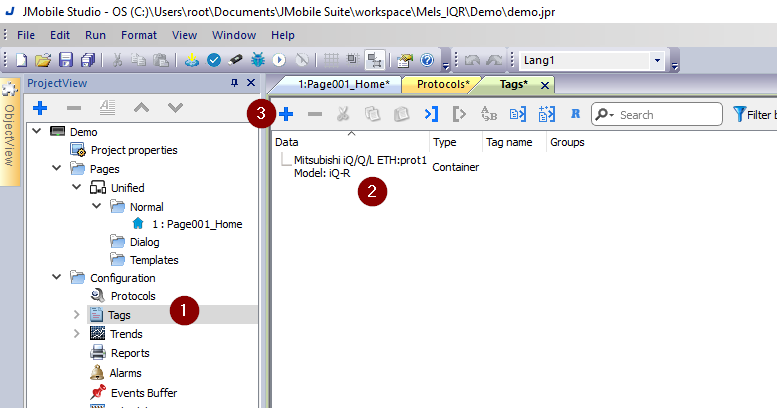
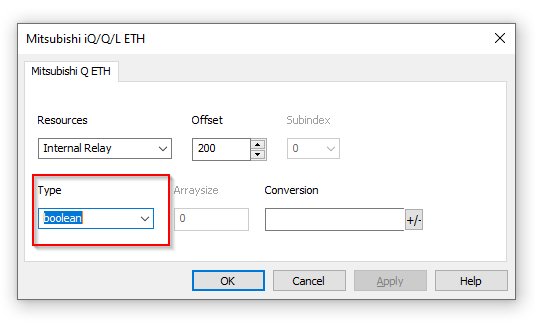
The Tag construction screen will appear.
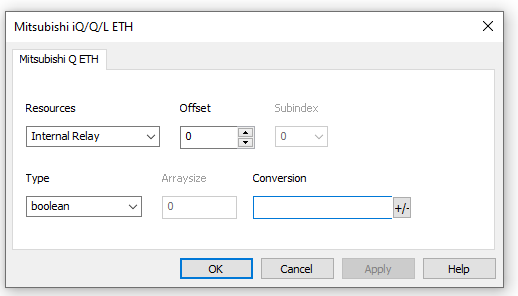
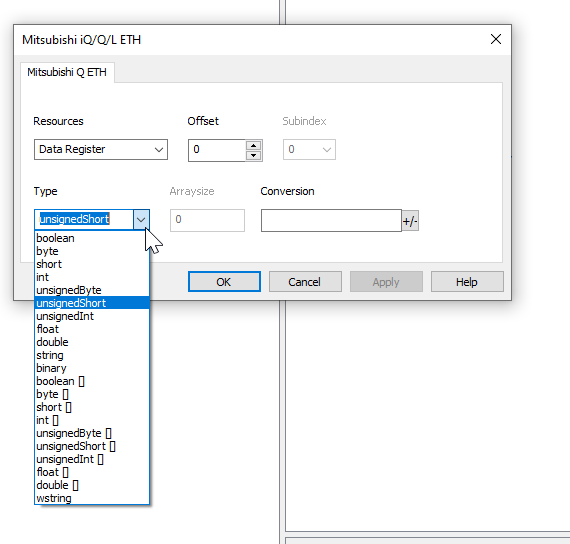
There is a Drop-List in Resources, where you can choose your IQ-R device.
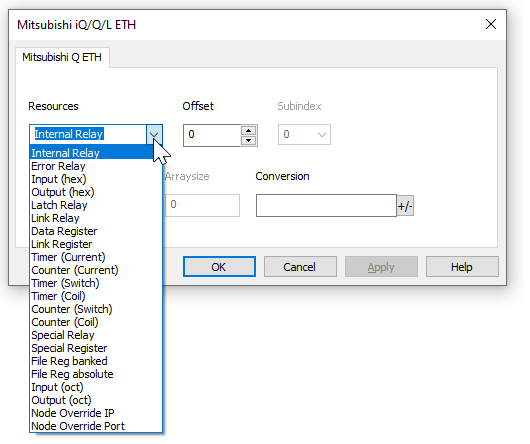
M Devices
Resources=Internal Relay corresponds to the M device in IQ-R.
Next is Offset: 0, which corresponds to address M0 in Tag.
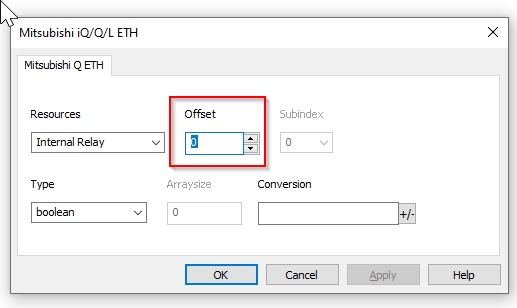
This time, set Offset=200 and set M200 as accessed.
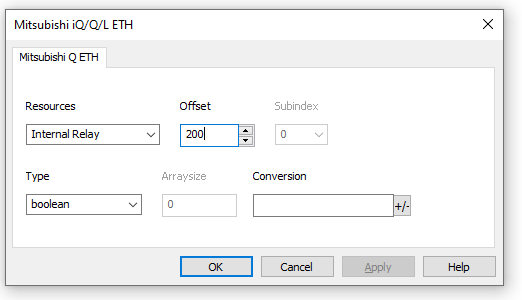
If Type=Boolean, the device is accessed in Bit Format.
You can also choose from Type=boolean[]. boolean[] is an array Format, which is accessed from M200.
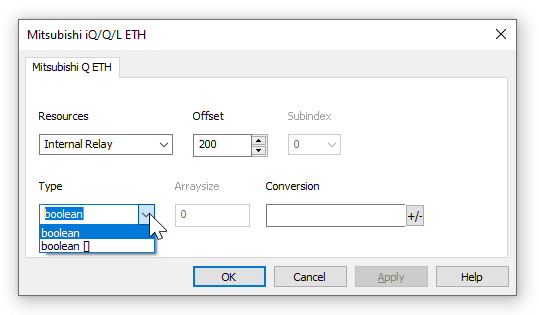
ArraySize can be entered.
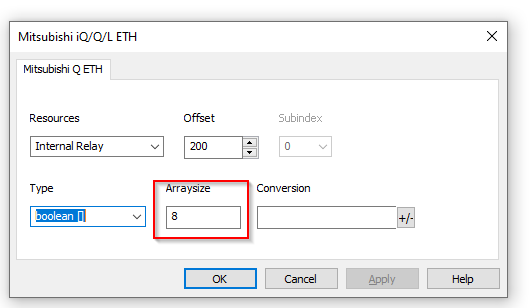
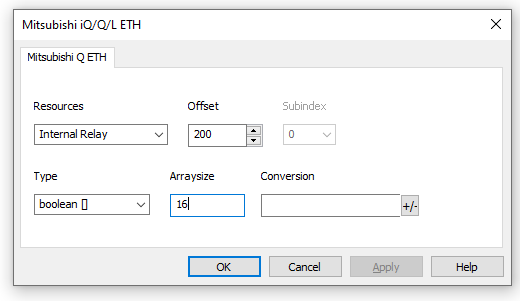
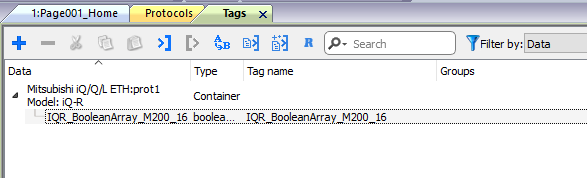
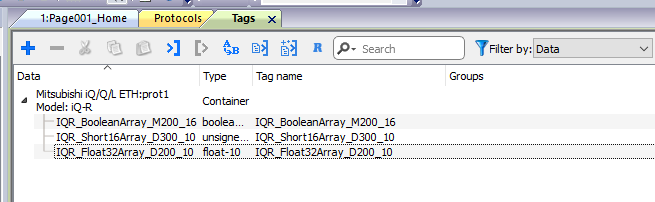
Resources=Internal Relay (M device), Offset=200 (from M200), Type and ArraySize are Boolean[], and 16 devices would be accessed M200-M215 together.
Finally, change the name of the variable to something easy to understand.
D Devices
The following is another example of setting up a commonly used “D” device.
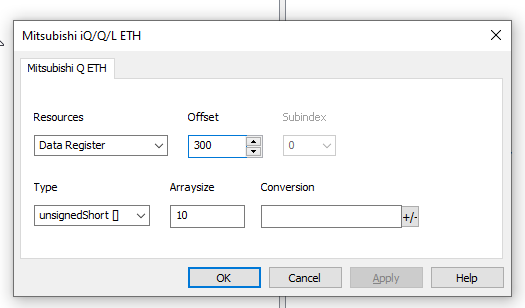
Resources=Data Register corresponds to Mitsubishi’s D device.
Type=unsignedShort to access the “D” device in 16 Bit Format.
Let’s set the offset to 300. This tag will access the D300 of Mitsubishi IQ-R device.
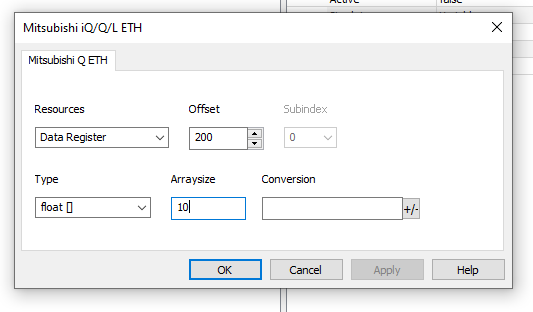
Set Type to float[] and Arraysize=10. This means that this Tag will access 10 real data from D200. (D200-D219)
Done!
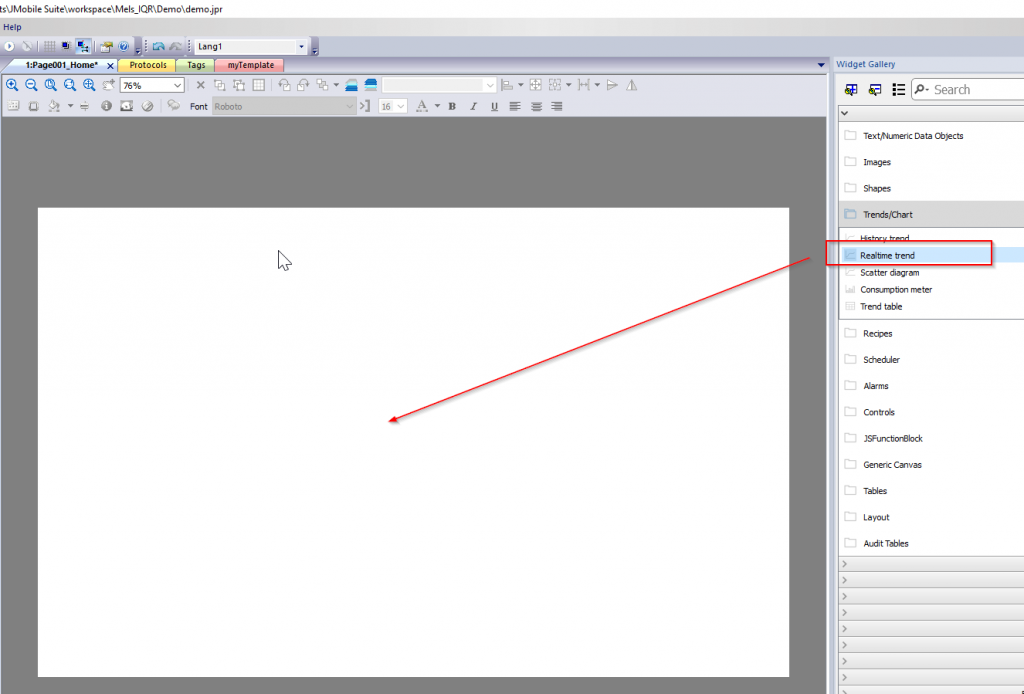
Add RealTime Trend
Let’s add a Trend Object to the screen. Add Widget Gallery>Trends/Chart>Realtime Trend on the right. It is impossible to explain all the configuration items in the article, so I will Catch-up only the important and often use parts.
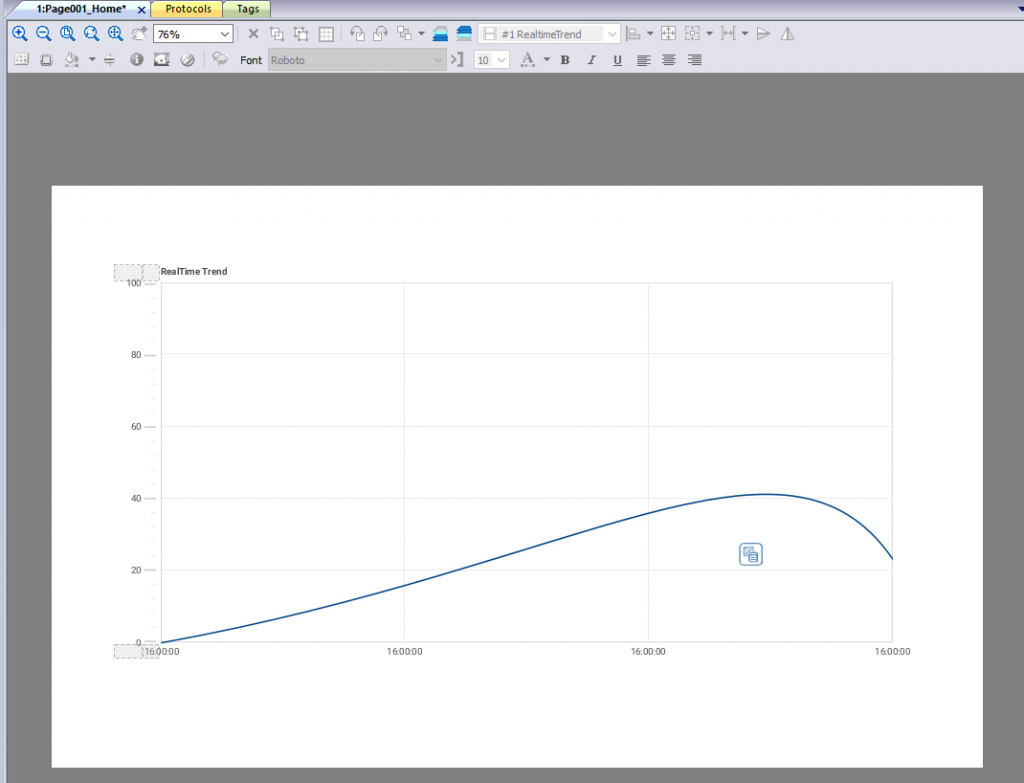
Realtrend has been added to the project.
Clicking on Trend to bring up the Properties screen on the right, where you can configure Trend’s detailed settings.
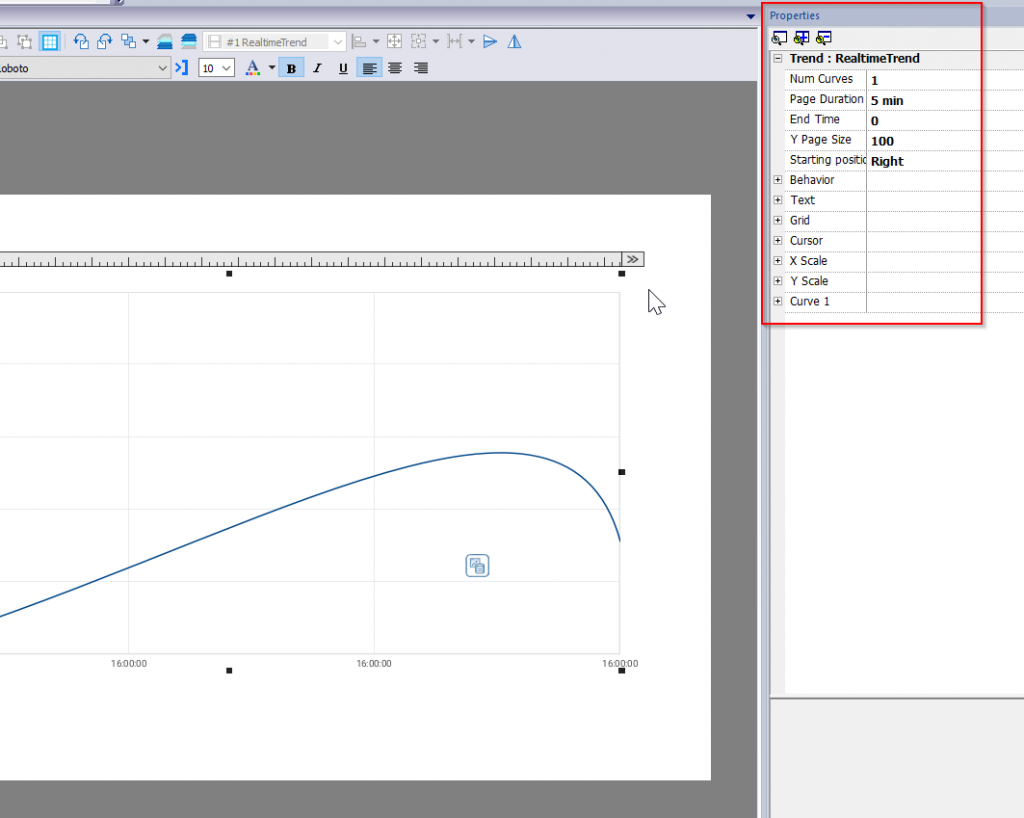
Total Numbers of Curves
The Num Curves item is the total number of lines displayed by the corresponding Trend.
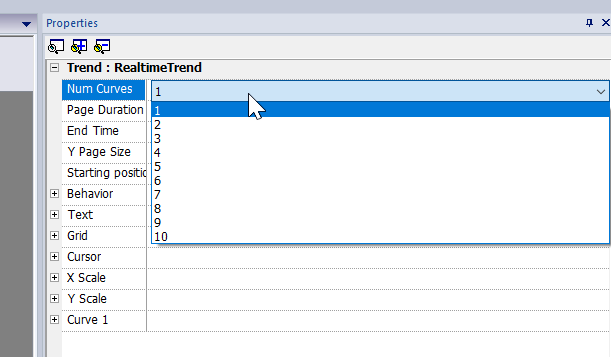
For example, if you set 4, you can display 4 curves in your trend.
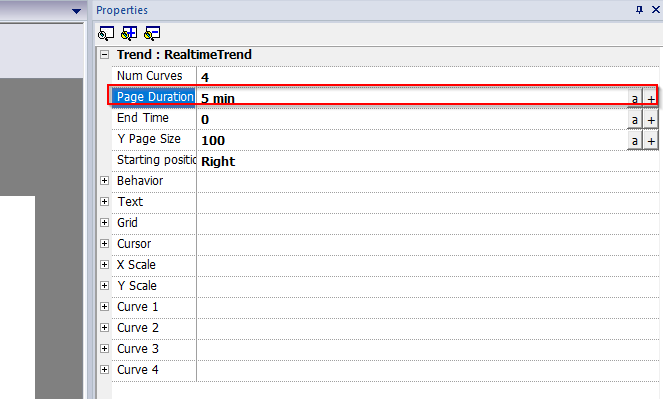
Page Duration
Here you can set the maximum time that can be displayed in one Realtime Trend.
Default is 5 minutes.
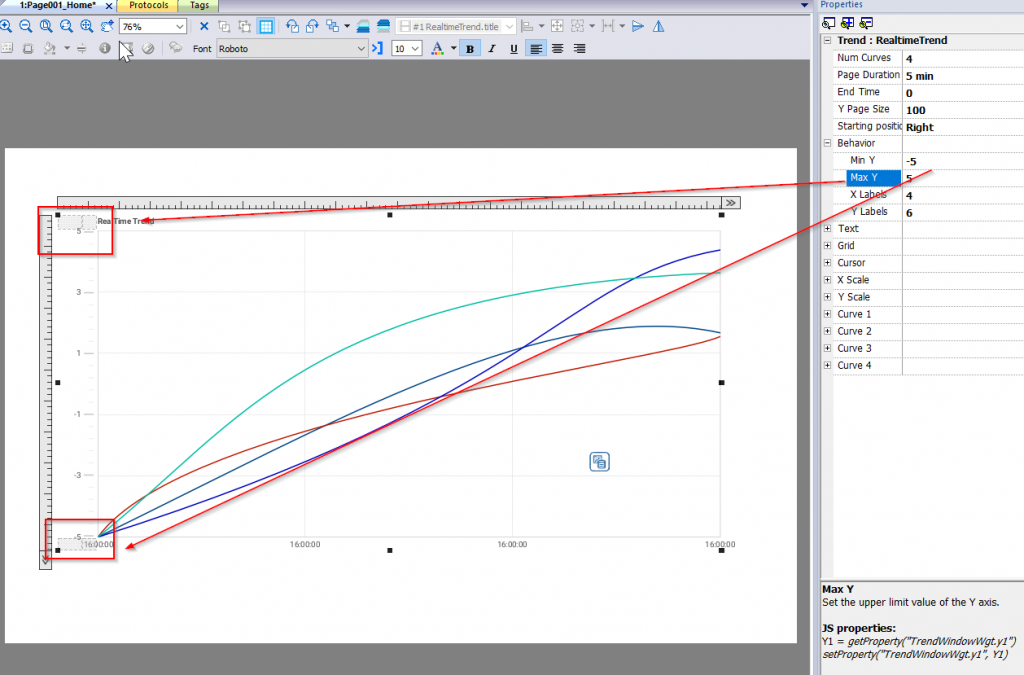
Min/Max Y
Min/Max Y is for setting the lower and upper limits of the Y axis.
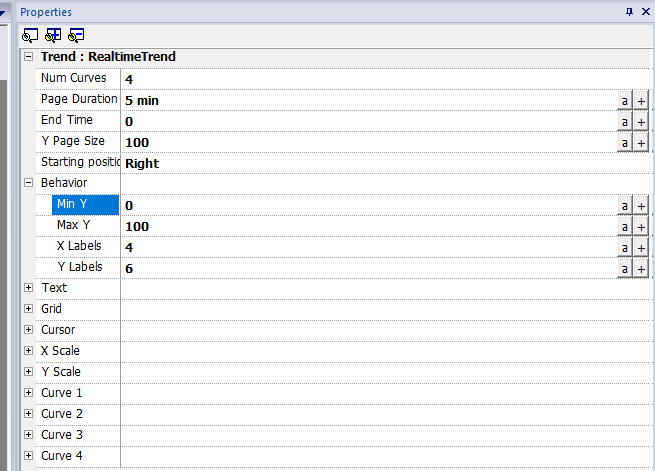
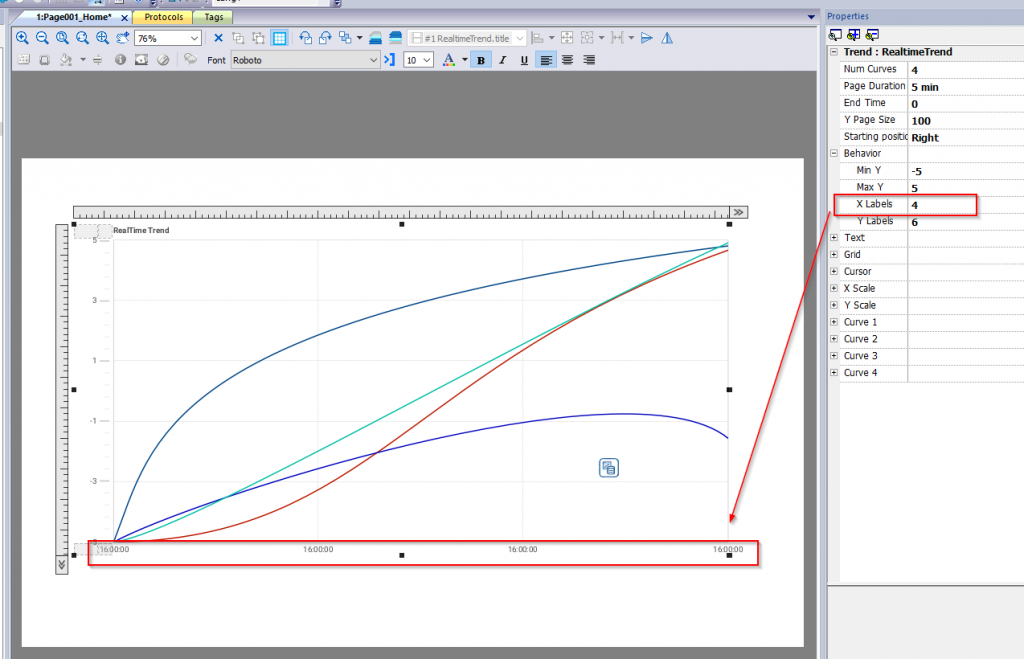
X Labels
Here you can set the number of X-axis time displays for Realtime Trend.
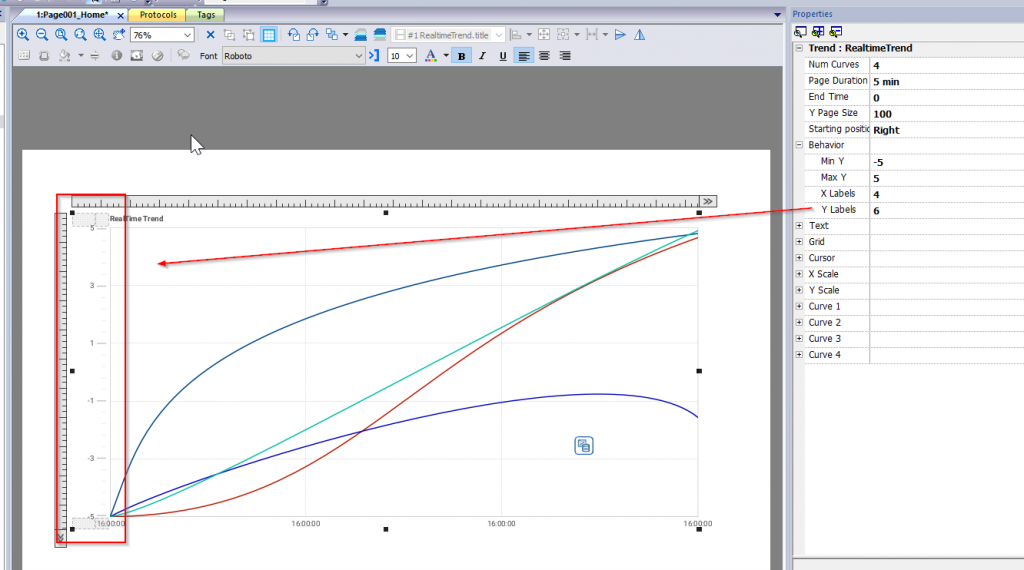
Y Labels
Here you can set the number of current price displays on the RealTime Trend axis.
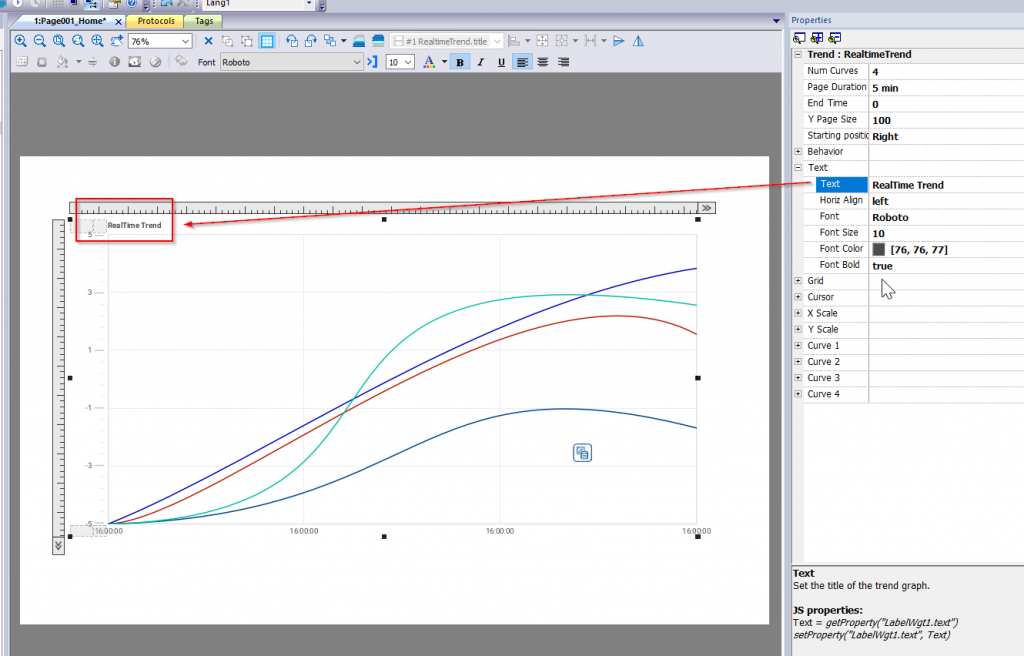
Text
Here you can set the title of Realtime Trend.
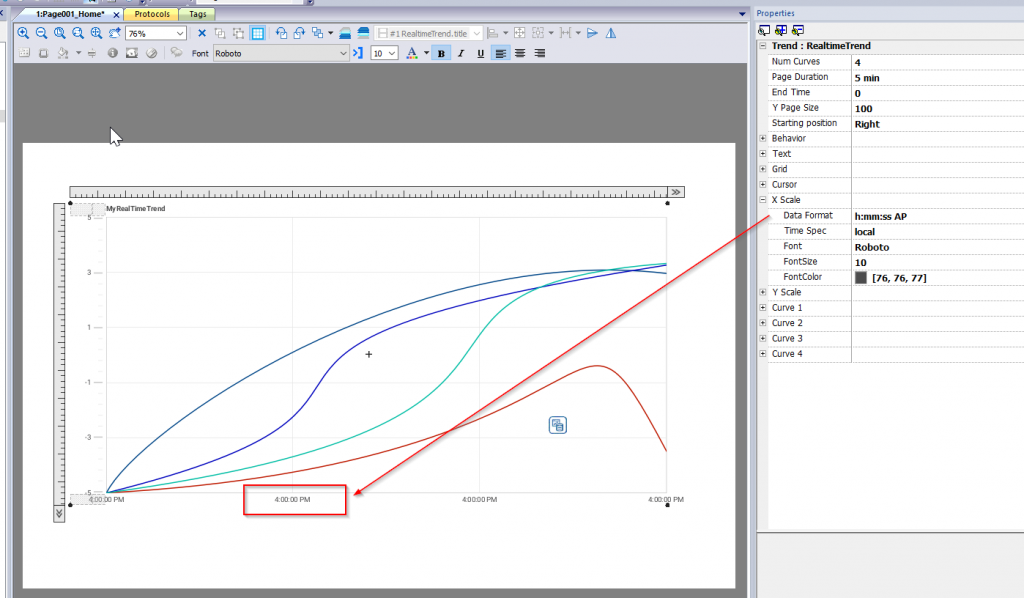
Data Format
Here you can set the Format for the X-axis time display.
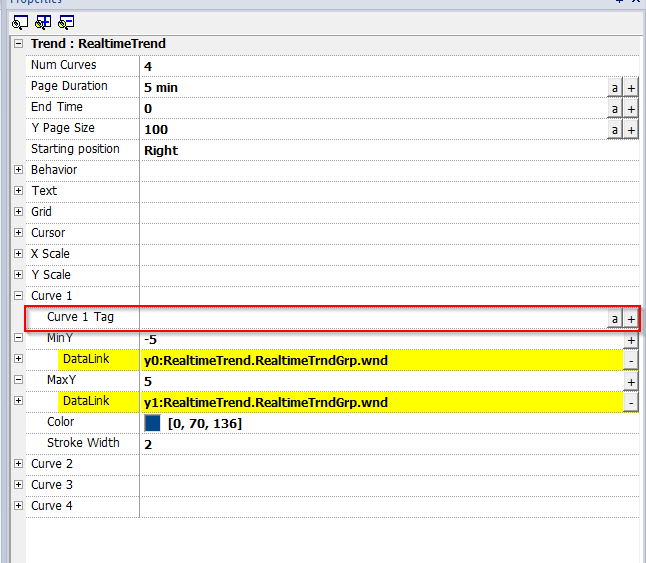
Curve Tag
Curve X Tag allows you to set a Tag to be associated with the corresponding Curve.
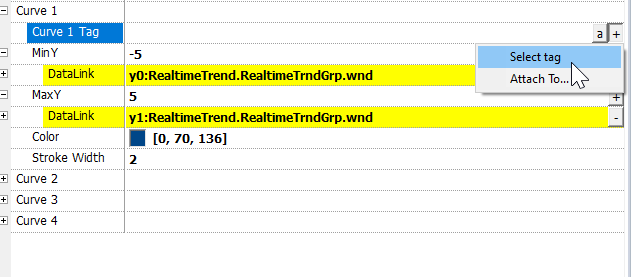
Click the + button>Select Tag.
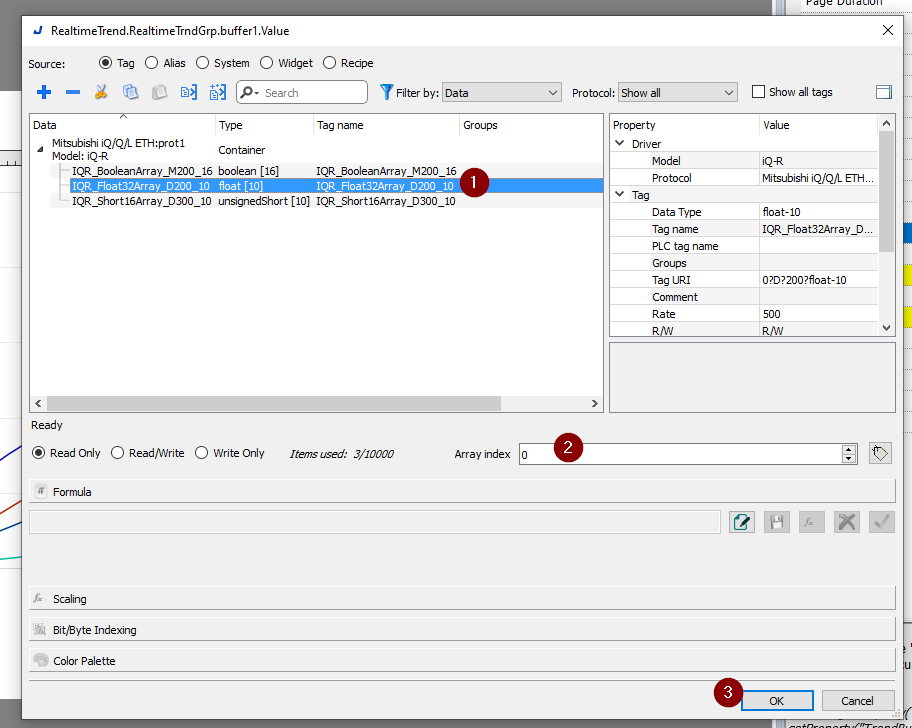
This time you can choose an array Tag of real data and set the number of the Index from Array Index.In this Example,0=D200,D201/D1=D202,D203..etc.
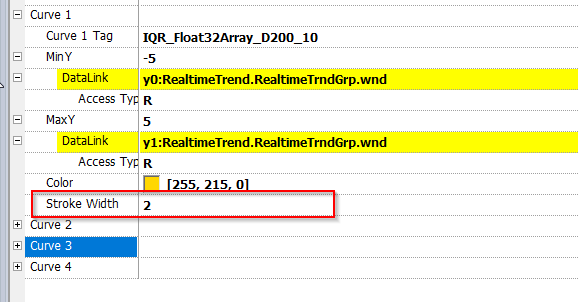
Color
You can set the color of the curve.
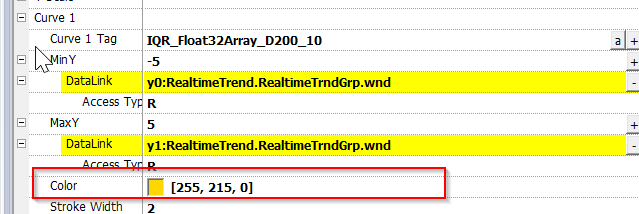
Sroke Width
Here you can set the Curve line thickness.
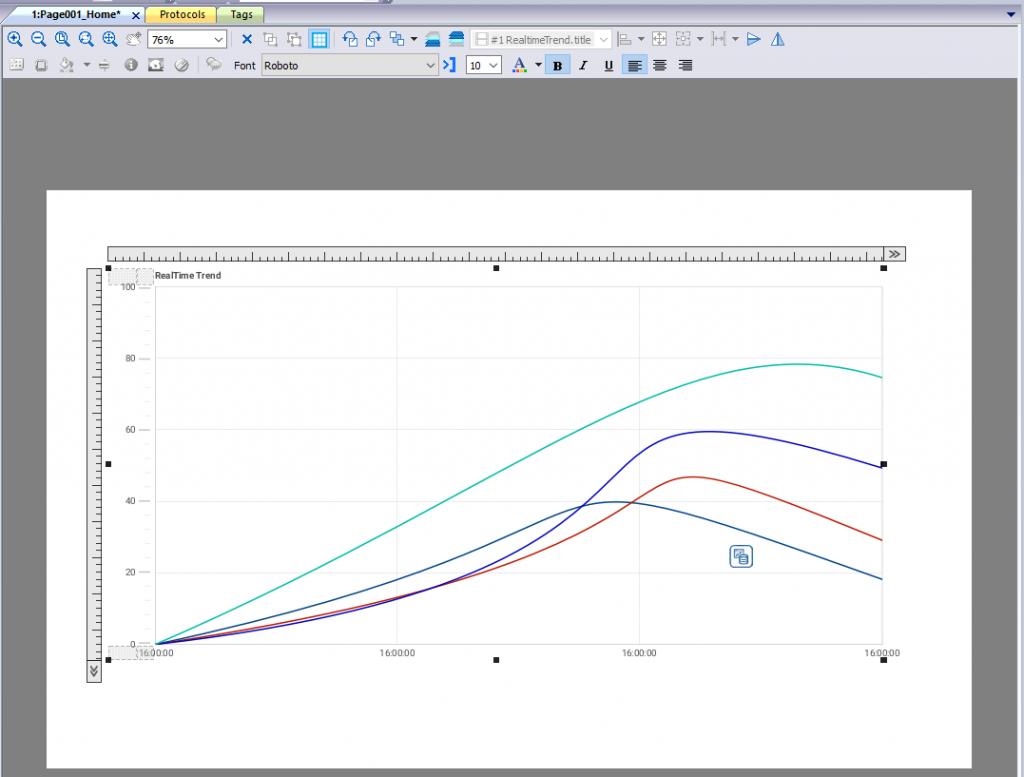
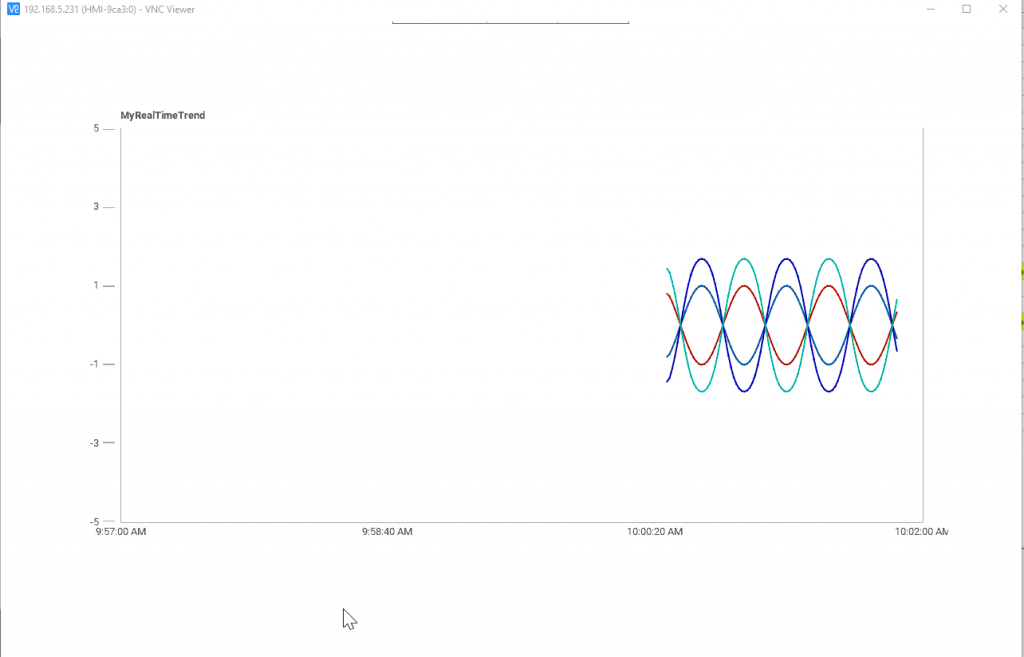
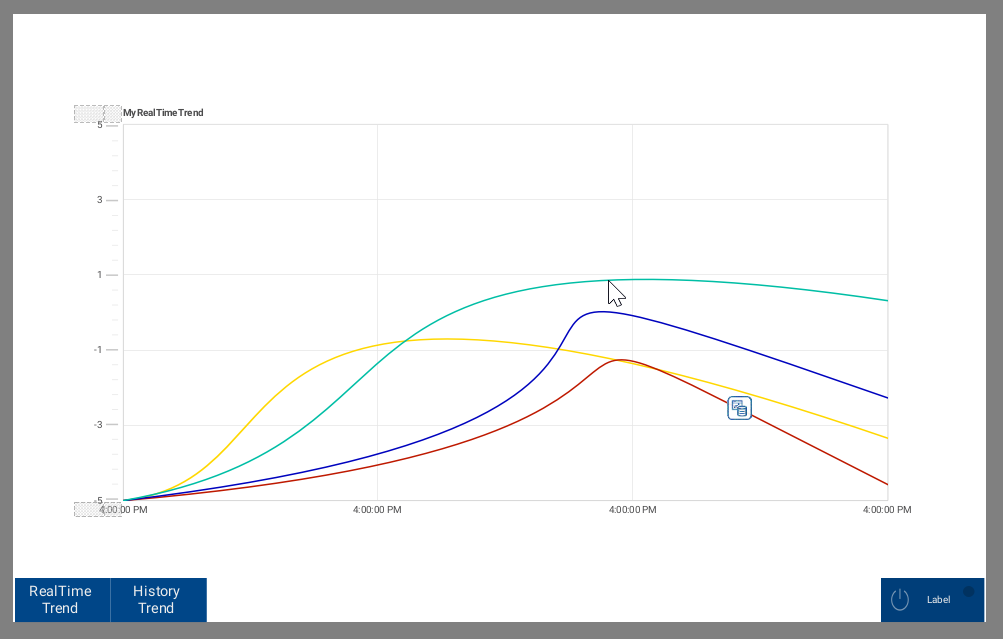
Result
Done!Trend of RealTime is displayed.
Add History Trend
Next, add a “History Trend” – It is a function to store your data in local storage.
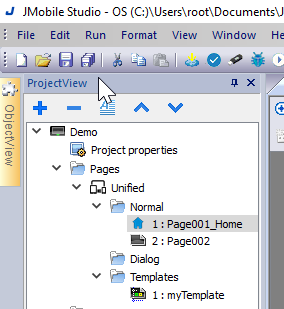
Add New Page
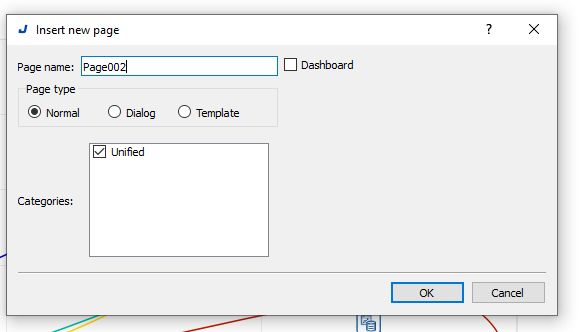
Create a new page by going to Pages>Unified>Normal>Right click>Insert new page in Unified.
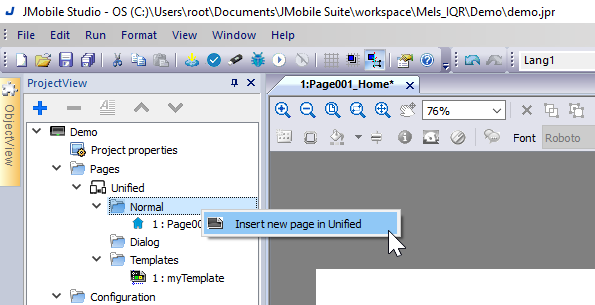
Enter a name for the page.
Add Trends
To create a History Trend, Trends must be created; add new Trends using the Configuration>Trends>+ button.
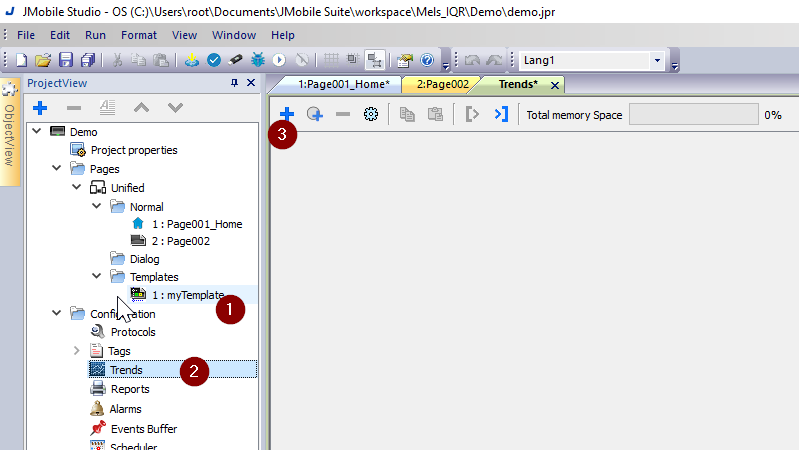
Done!
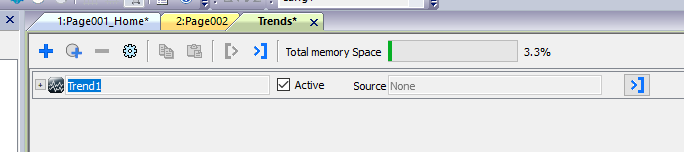
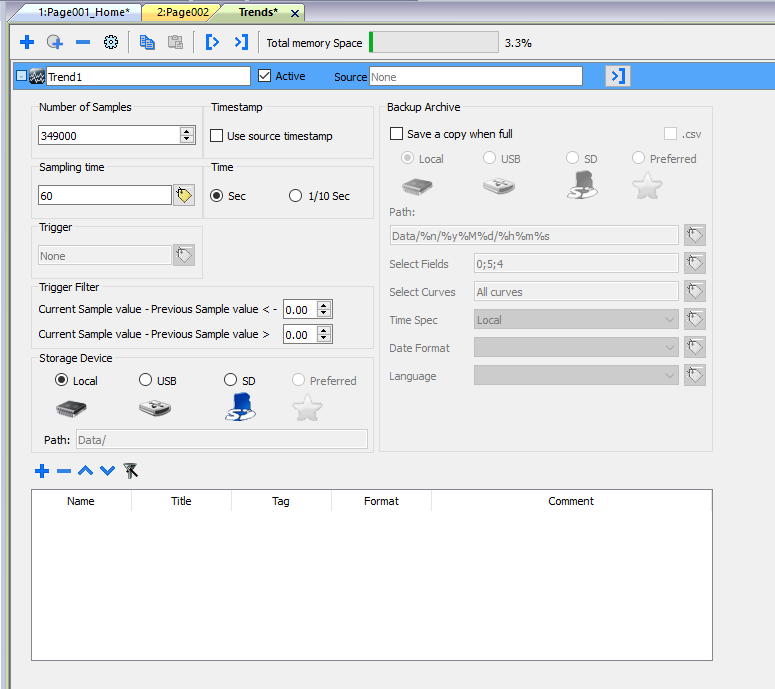
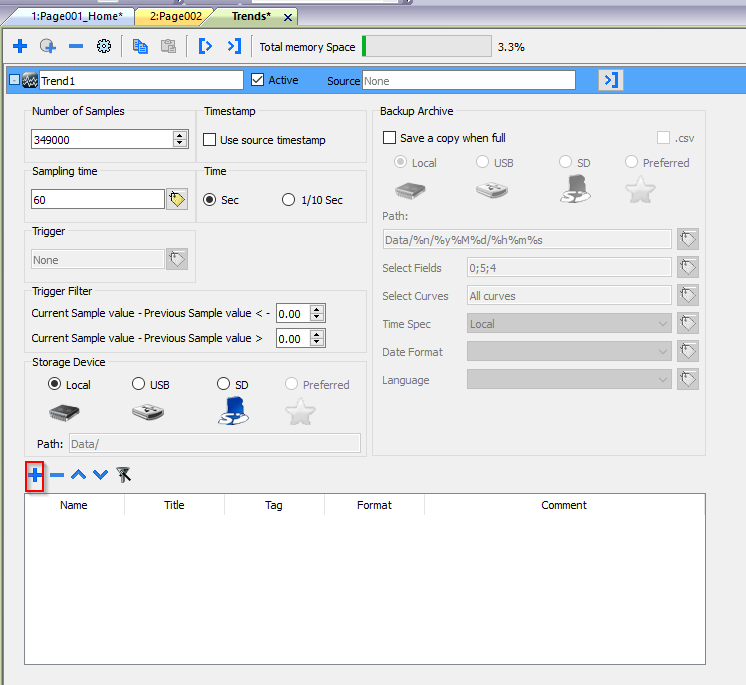
Double-click on Trends to display the configuration.
Add Data
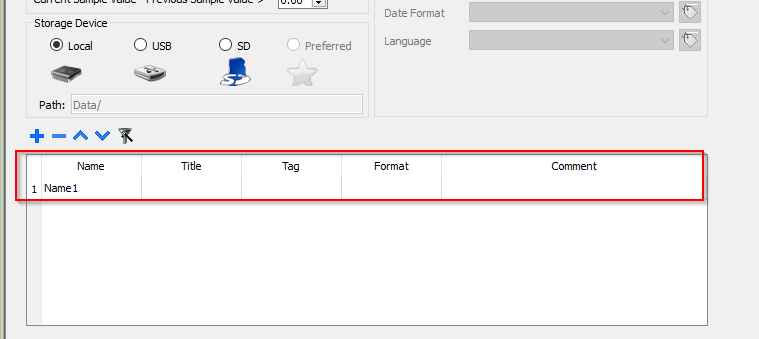
Use the + button at the bottom to add the Tag you wish to record.
New data has been added.
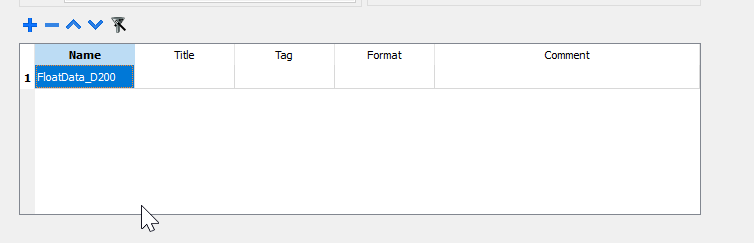
Name
Rename the data with an easy-to-understand name.
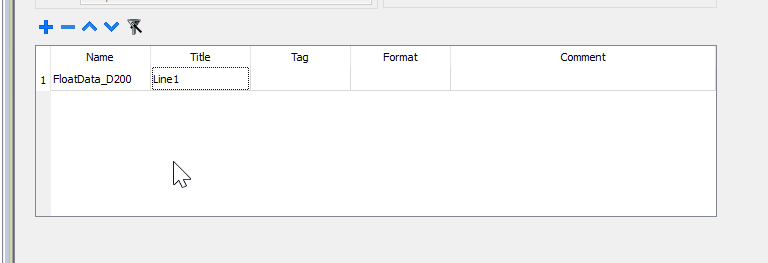
Title
Setup the title of your data.
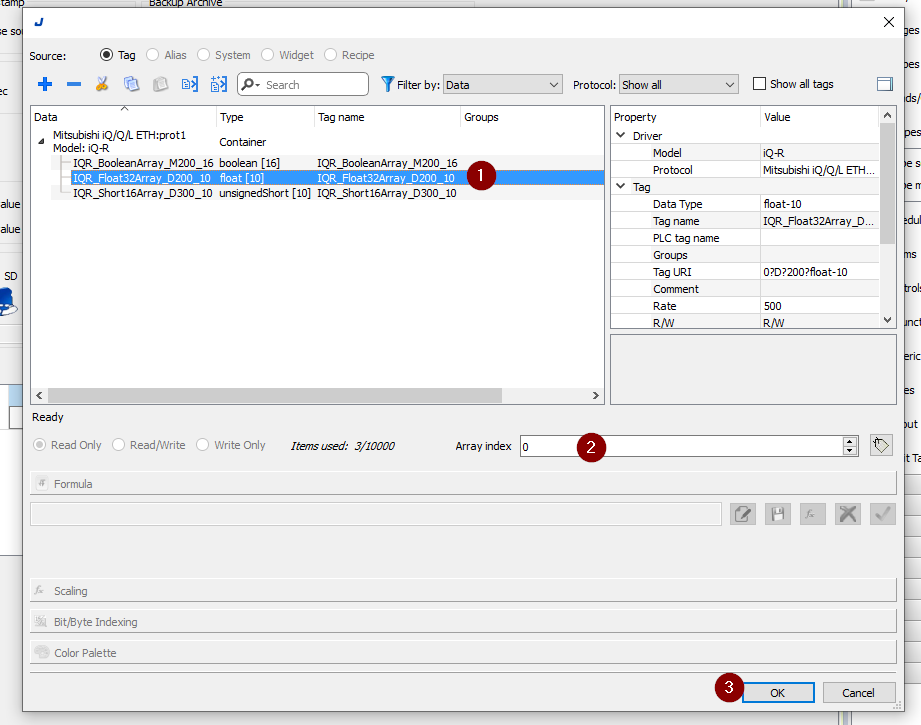
Tag
You can set the actual Tag to be connected.
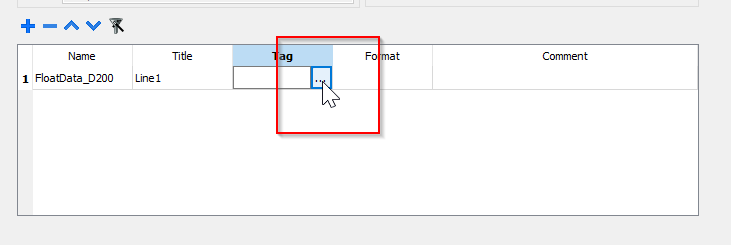
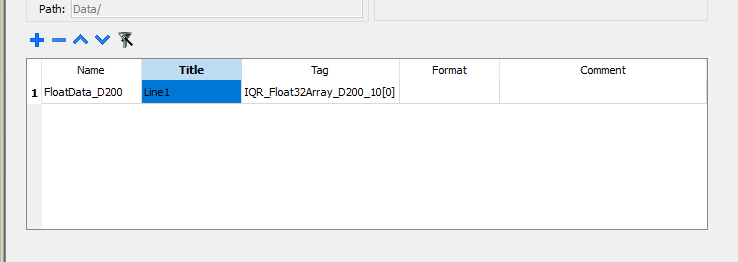
Select “Tag” > “Array Index” since the tag constructed in this article is an Array Format > “OK” to save the data. (Array Index=0 means that D200 and D201 are accessed.)
Done!
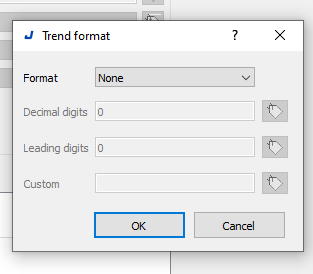
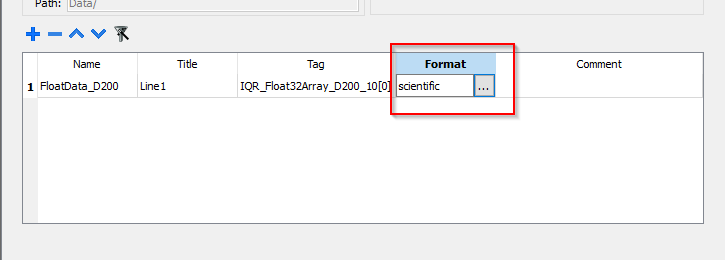
Format
Set the Format of the Tag.
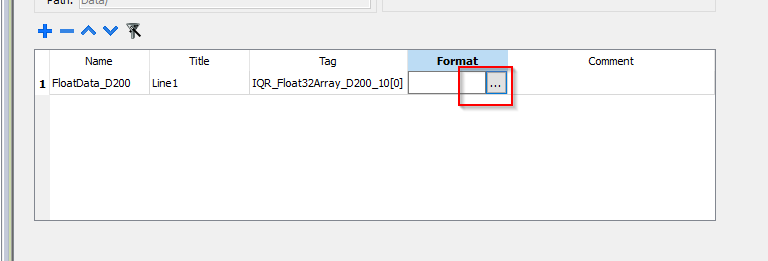
Format is set to Default None.
SCIENTIFIC will be a real number FORMAT.
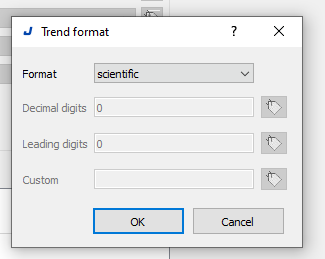
Done!
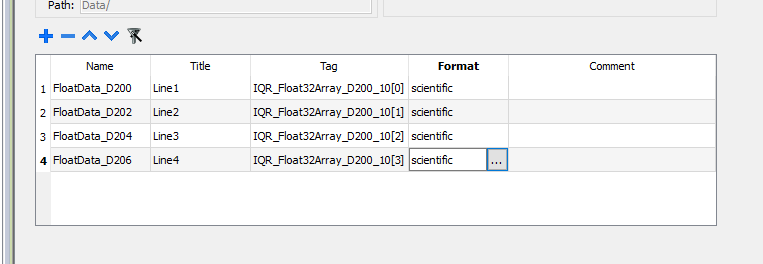
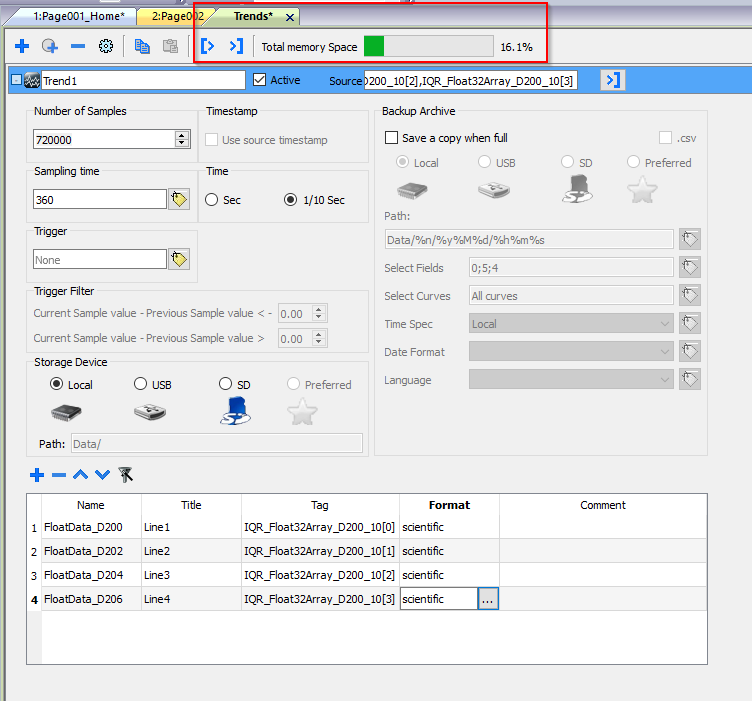
We have set up four such real number data.
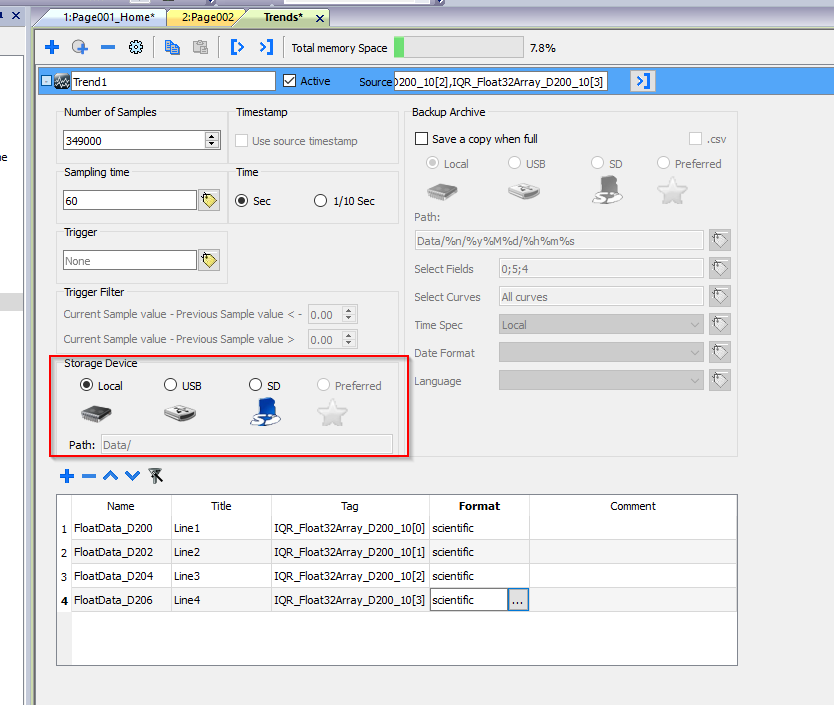
Storage Device
Storage Device allows you to set the destination for data storage. In this case, Local is selected.
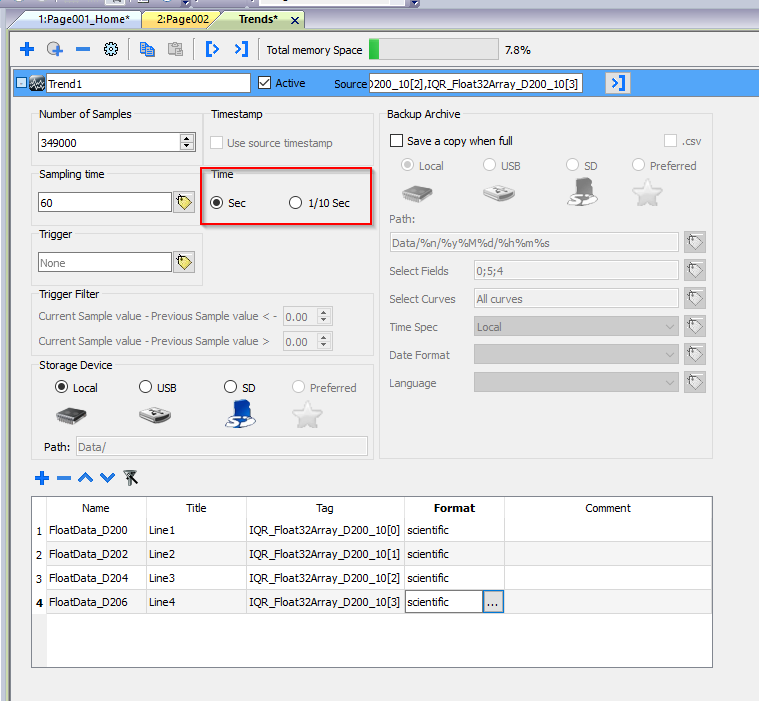
Time
Sets the unit of Sampling Time.
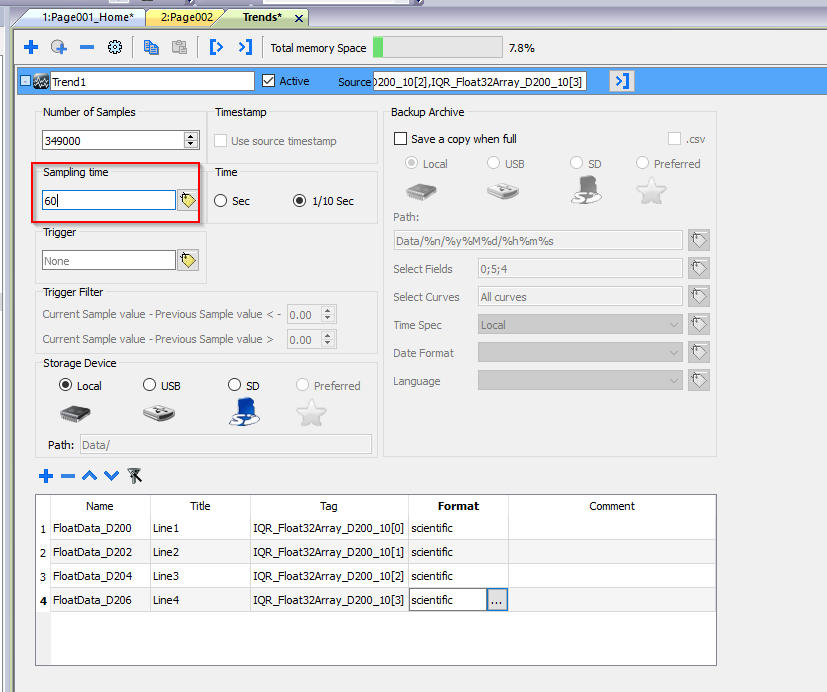
Samping Time
Set the Sampling Time. This number is set together with the Time Field.
Number of Samples
Trend1 is the total number of Samples to be acquired.
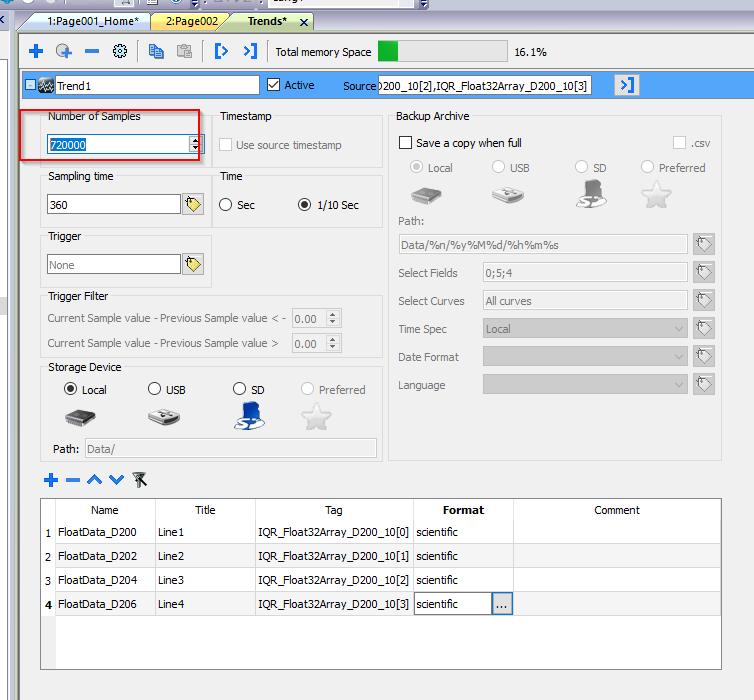
Total memory Space
Finally, check the memory capacity used by this Trend.
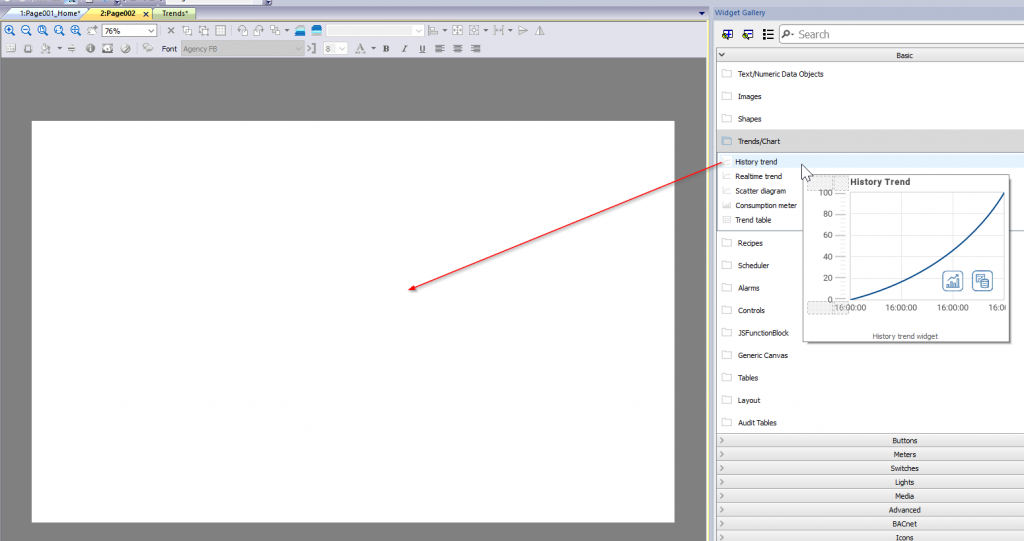
Drop
From Widget Gallery, add Trends/Chart>History Trend to your project.
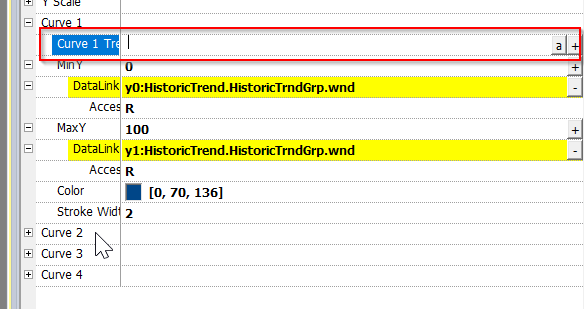
Curve X Tag
Set the Tag to be associated with the corresponding Curve using the + button in the Curve X Tag.
Select the data you just added in Trend >OK.
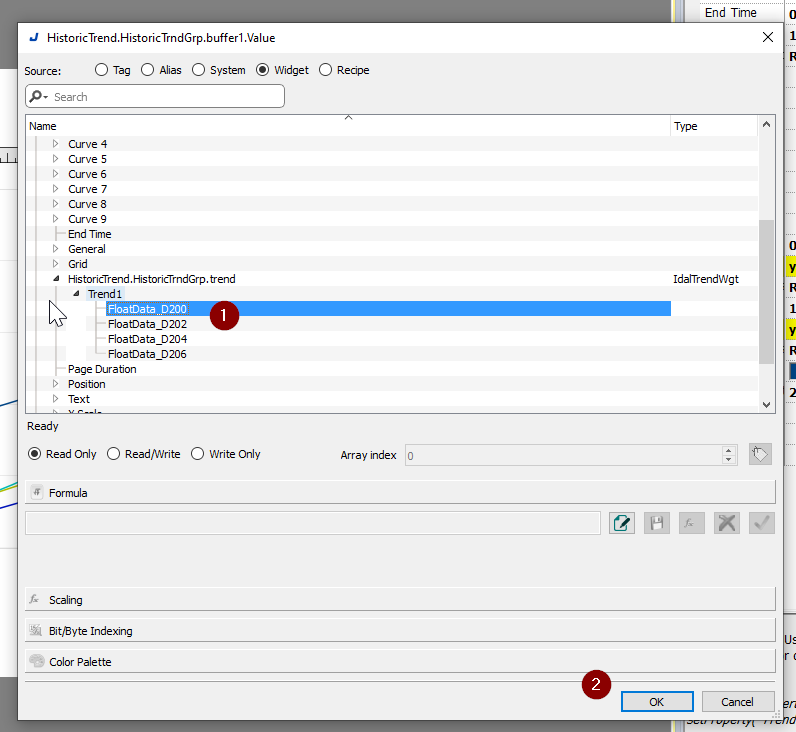
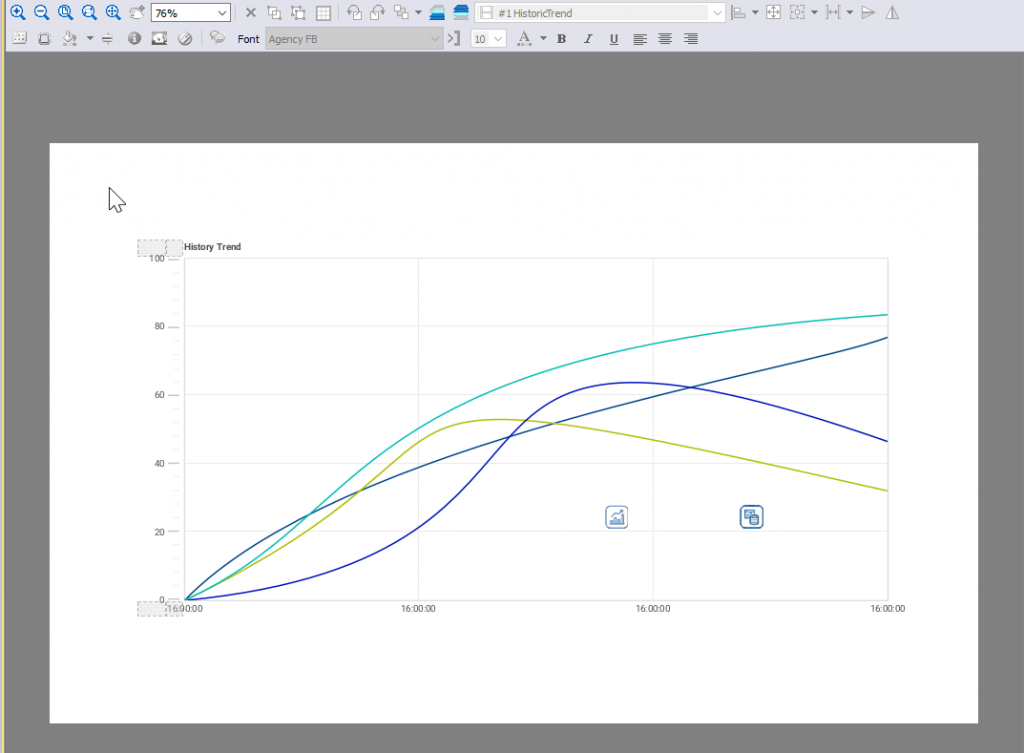
Done!
Add Template
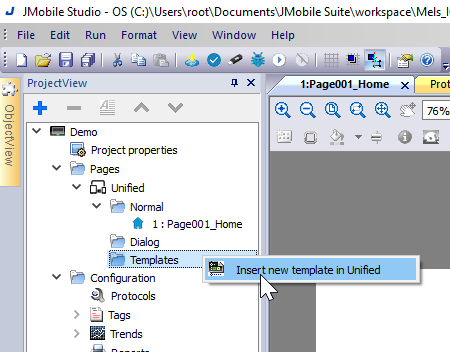
Templates are a common feature in HMI to SHARE the same common screen to multiple screens.Right click the Templates>insert new template in Unified.
Enter the Template name and OK.
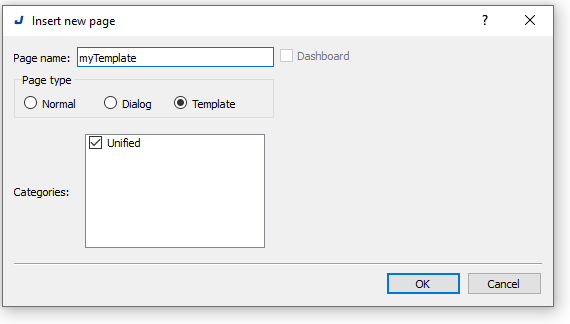
Template has been created.

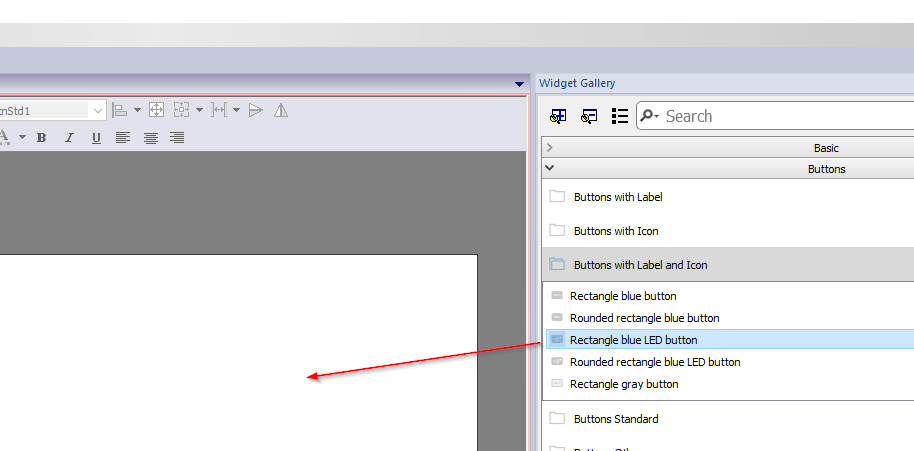
Add Screen Jump Button
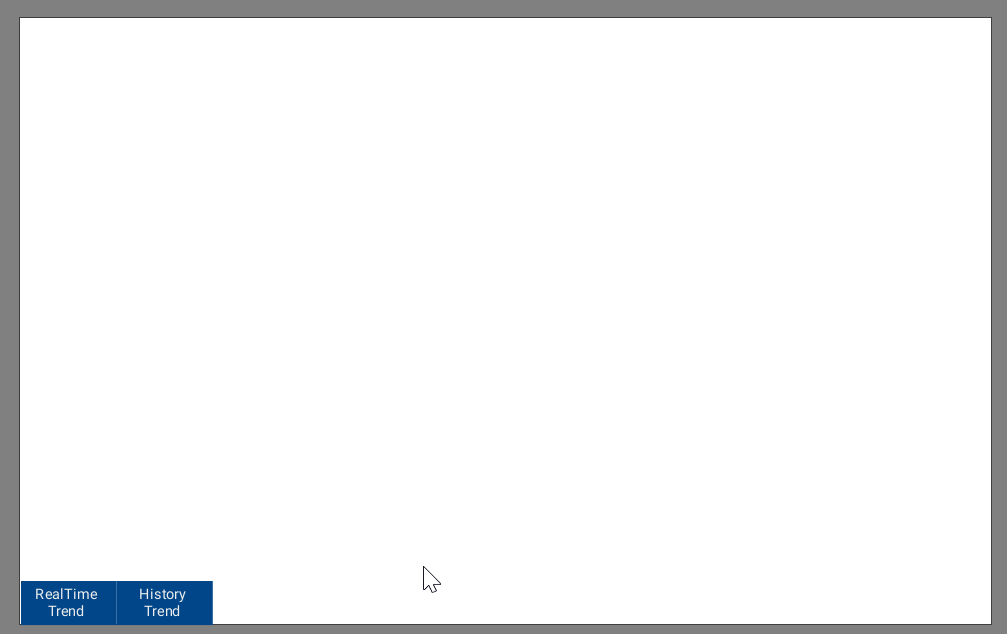
Add a button from the Widget Gallery.
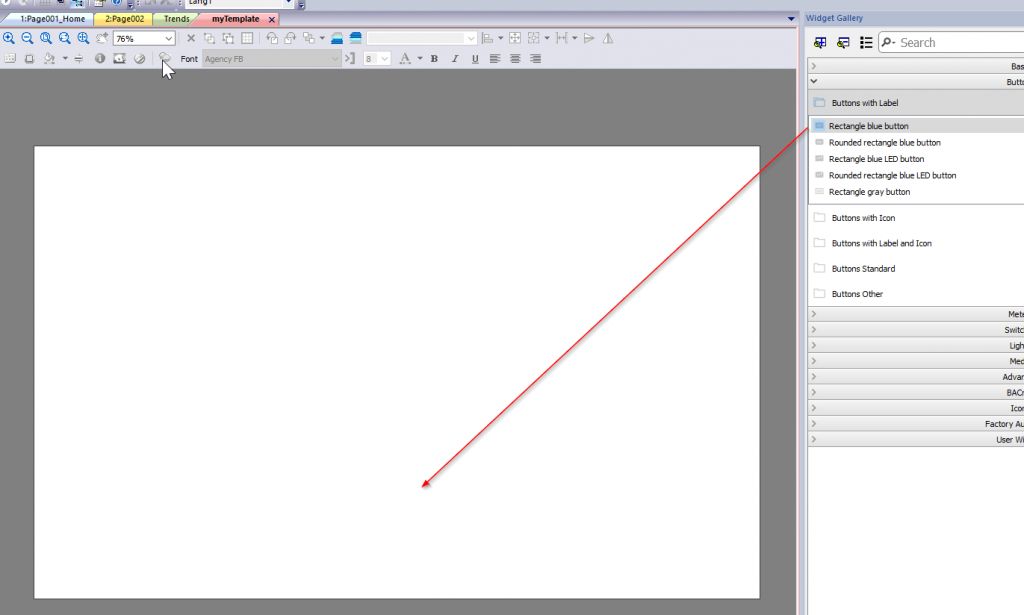
Done!
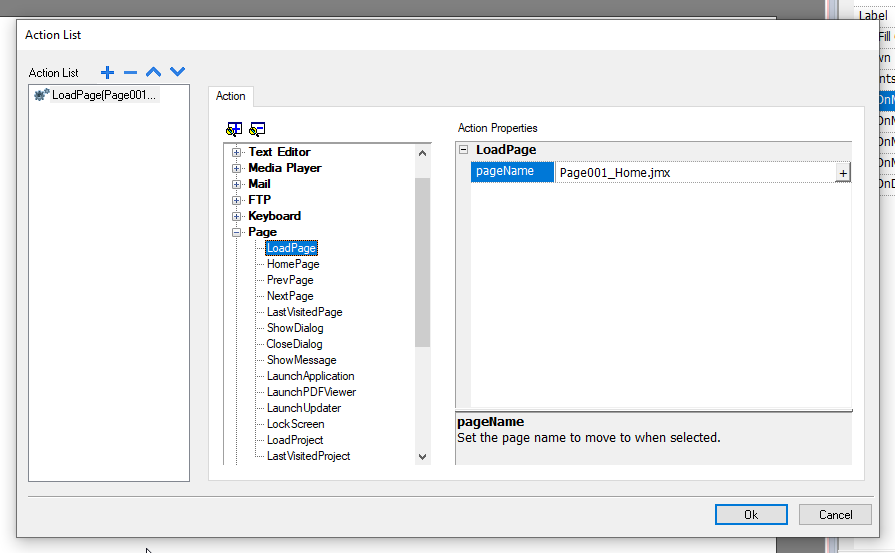
With the button selected, open the Properties screen and click the + button next to >Event>OnMouseClick Action.
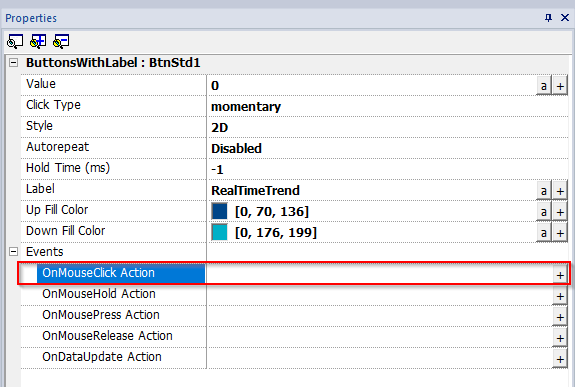
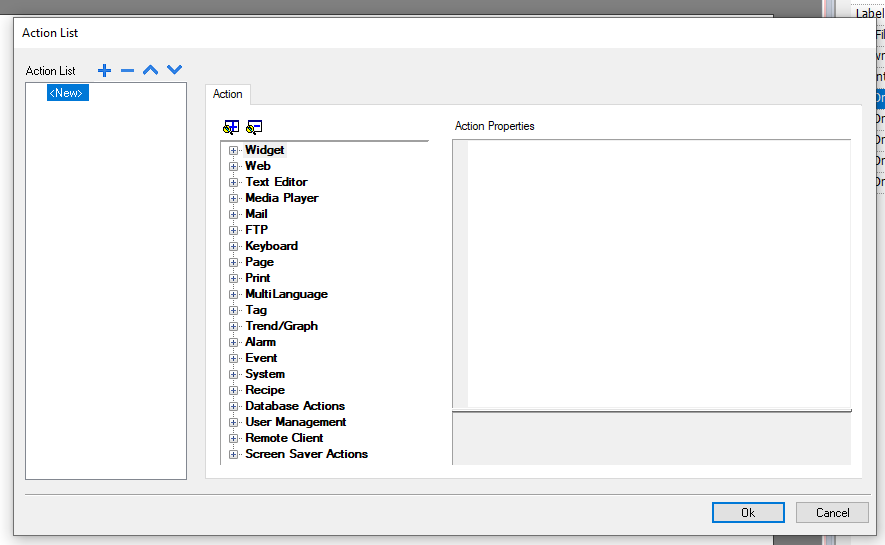
The Action List screen is now displayed.
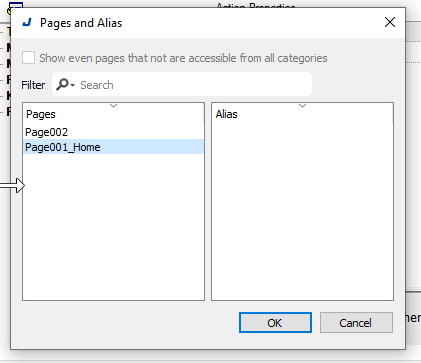
Click the + button under Page>LoadPage>pageName.
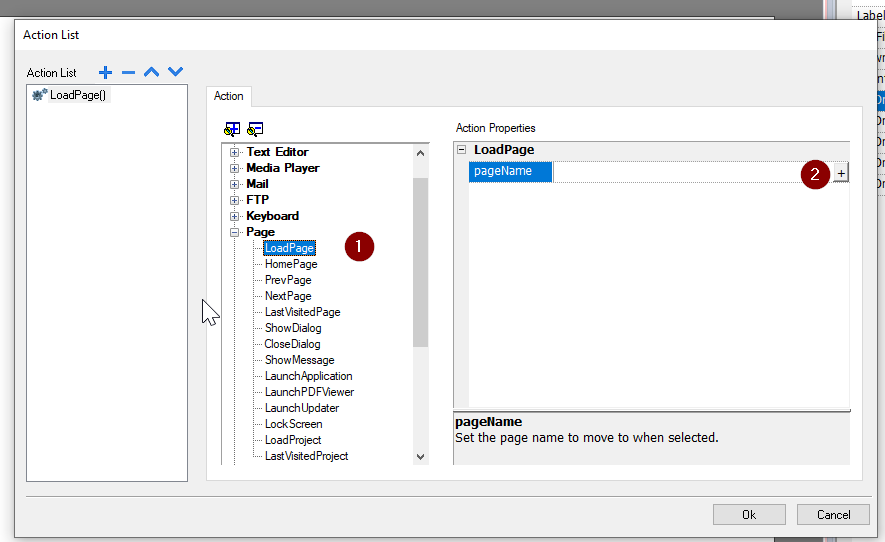
Once the button is clicked, select the screen you wish to switch to.
Done.
Add Push Button
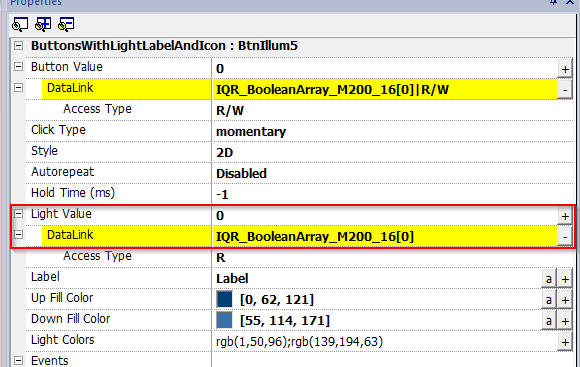
Next, add a Push button and set SetBit Action and ResetBit Action to Events>OnMousePress Action and OnMouseRelease Action.
Create an operation so that pressing the button >sets the Bit and releasing it >resets it.
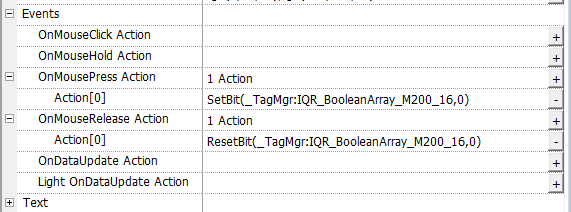
Light Value is actually set to the same Tag as the Button Action.
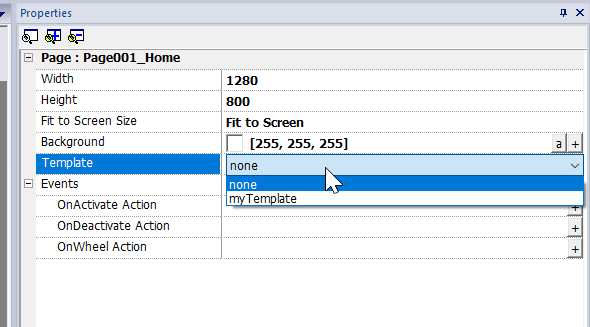
Configure Template
Finally, set a Template to Screen.
Just click on the Template options from the Properties and choose your Template.
Done!
RESULT
RealTime Trend and History Trend can also be displayed, and M200 can be turned on and off repeatedly at the click of a button.